
Opinion
US Economy to Ride Tax Cut Tailwind—But Tariff Turbulence Complicates the Flight Path
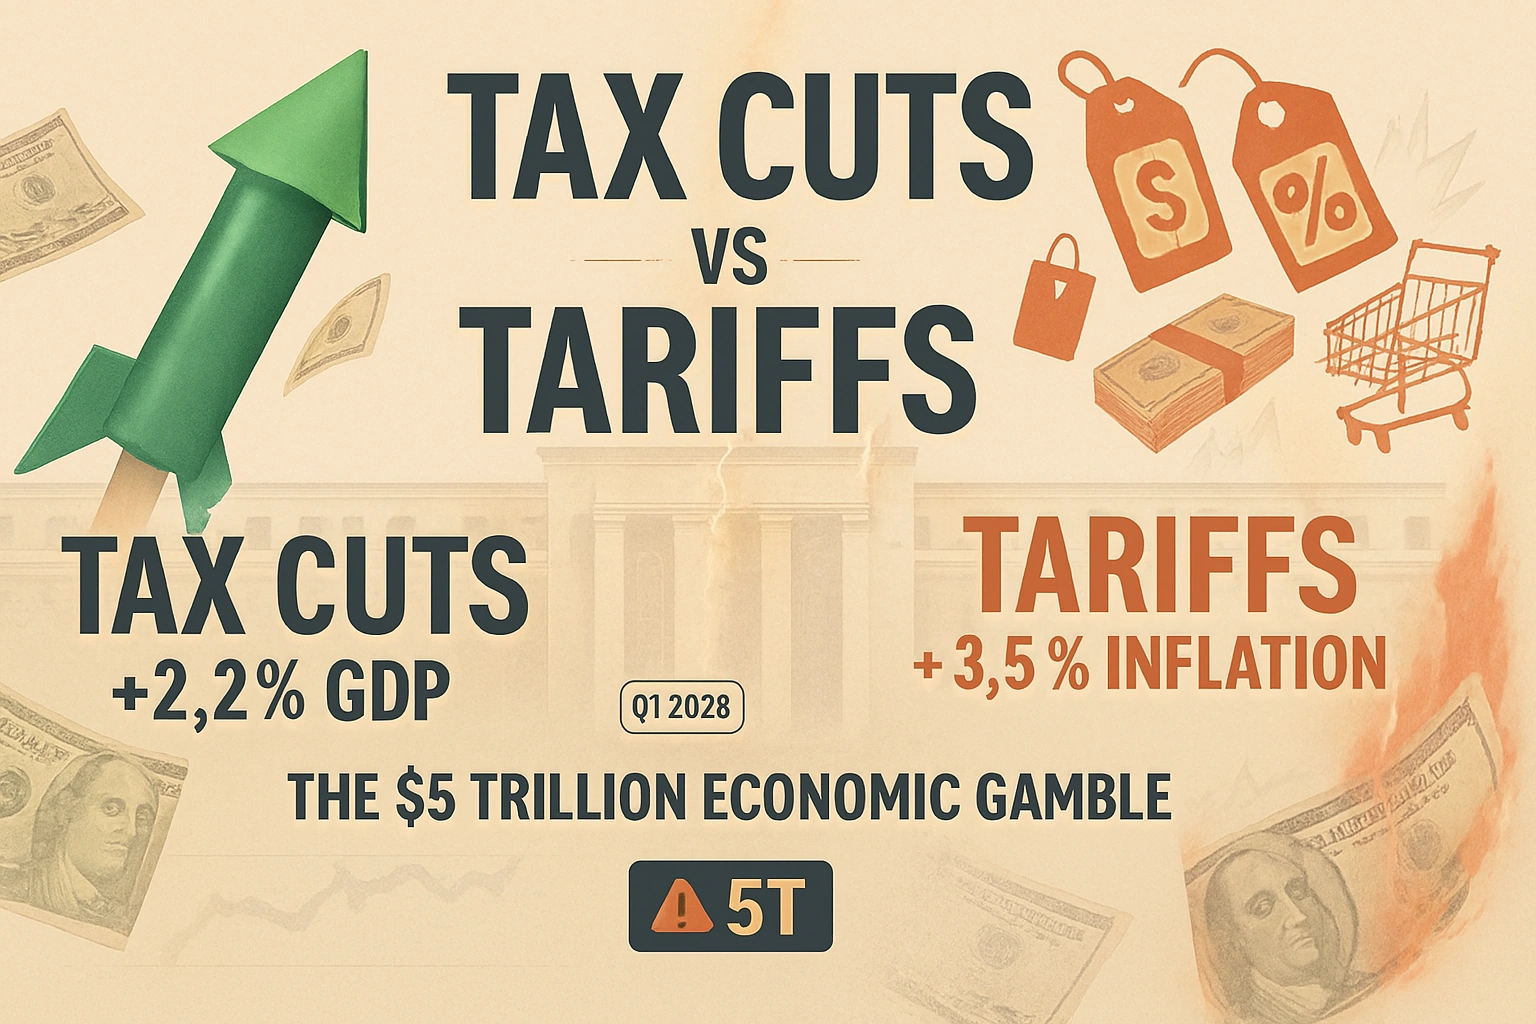
The impact of Trump’s tariffs on prices is projected to peak in the first half of the year, but the $5 trillion tax stimulus may propel growth despite short-term inflationary pressures
When Sarah Chen opened the invoice for her Chicago manufacturing firm’s imported steel components in March 2025, the numbers told a story playing out across American boardrooms: a 15% tariff-induced price increase that would squeeze margins through the spring. But when her accountant calculated the company’s 2025 tax liability in July—after the One Big Beautiful Bill Act became law—she discovered her effective tax rate had dropped by 2.3 percentage points, freeing up capital for the equipment investment she’d postponed for two years.
Chen’s experience captures the dual economic forces shaping 2025 and beyond: historic tax cuts colliding with the most aggressive tariff regime since the 1930s. The Congressional Budget Office projects real GDP growth of 1.4 percent in 2025 and 2.2 percent in 2026, reflecting a near-term drag from trade barriers followed by a tax-fueled acceleration. But beneath these headline numbers lies a more complex reality—one where the timing, magnitude, and distribution of benefits and costs will determine whether America’s economy enters 2027 on strengthened footing or stumbles under the weight of elevated borrowing costs and persistent inflation.
The Tax Cut Engine: $5 Trillion in Fuel
On July 4, 2025, President Trump signed the One Big Beautiful Bill Act, the most sweeping fiscal legislation of his second term. According to the Tax Foundation, the major tax provisions would reduce federal tax revenue by $5 trillion between 2025 and 2034 on a conventional basis. When accounting for economic growth effects, the dynamic score falls to $4 trillion, meaning economic growth pays for about 19 percent of the major tax cuts.
The legislation extends and expands the 2017 Tax Cuts and Jobs Act provisions that were scheduled to expire. For individual filers, the standard deduction will jump by $750 to $16,100 for single filers in 2026. The seven individual income tax brackets remain at their reduced rates, preventing what would have been an automatic tax increase for millions of Americans.
But the law goes further with targeted provisions that benefit specific constituencies. Workers receiving tips can now deduct up to $25,000 of tip income from their taxable income, a provision Trump campaigned on extensively. The child tax credit increased from $2,000 to $2,200 per child for 2025, while parents of children born between 2025 and early 2029 gain access to government-seeded savings accounts with an initial $1,000 deposit.
For businesses, the impact is substantial. The legislation makes permanent the 20% deduction for pass-through entities like partnerships and sole proprietorships, alongside 100% bonus depreciation for equipment investments. These provisions address long-standing complaints from the business community about the uncertainty created by temporary tax code provisions.
The Penn Wharton Budget Model estimates that before economic effects, these proposals would reduce revenues by $6.8 trillion over the 2025-2034 budget window. The discrepancy between various estimates reflects different assumptions about behavioral responses and the scope of provisions modeled.
“J.P. Morgan estimates the announced measures could boost Personal Consumption Expenditures prices by 1–1.5% this year, and the inflationary effects would mostly be realized in the middle quarters of the year. Fed Chair Jerome Powell emphasized that inflation from goods should peak in the first quarter or so, effectively a one-time shift in the price level rather than an ongoing inflation problem.”
How this translates into economic growth depends on several transmission mechanisms. Lower marginal tax rates increase the after-tax return to work, potentially boosting labor supply. Reduced corporate taxation raises the after-tax return on investment, encouraging capital formation. And households with more disposable income tend to increase consumption, stimulating aggregate demand.
The Tax Foundation projects the One Big Beautiful Bill Act would increase long-run GDP by 1.2 percent—a meaningful but not transformative boost. Historical precedent from the 2017 tax cuts offers a reality check. Research found that the corporate tax cut reduced corporate tax revenue by 40 percent and increased corporate investment by 11 percent, while the tax cut increased economic growth and wages by less than advertised by the Act’s proponents.
The Tariff Headwind: Inflation’s Spring Surge
If tax cuts represent the economy’s accelerator, tariffs function as a brake—one applied with increasing force through early 2025. President Trump invoked emergency economic powers to implement what J.P. Morgan chief U.S. economist Michael Feroli describes as a dramatic escalation: This takes the average effective tariff rate from around 10% to just over 23%.
The architecture is complex. A baseline 10% universal tariff applies to nearly all trading partners, with significantly higher rates targeting specific countries and products. The effects ripple through the economy in ways that are only partially visible in real-time data.
Federal Reserve Bank of St. Louis researchers quantified the impact using personal consumption expenditures data. They found that over the June-August 2025 period, tariffs explain roughly 0.5 percentage points of headline PCE annualized inflation and around 0.4 percentage points of core PCE inflation. This represents a meaningful but not catastrophic contribution to inflation running above the Federal Reserve’s 2% target.
The Tax Foundation calculates that the tariffs amount to an average tax increase of $1,200 per US household in 2025 and $1,400 in 2026—a hidden levy that falls disproportionately on lower-income households who spend a larger share of their budgets on goods.
Harvard Business School’s Pricing Lab documented the differential impact across product categories. Between March and September 2025, the price of imported goods rose about 4.0 percent while domestic goods rose 2.0 percent. Categories showing especially steep increases include clothing accessories, jewelry, and household tools—items that feature prominently in household budgets.
How will Trump’s tax cuts affect the economy?
The Tax Foundation projects Trump’s One Big Beautiful Bill Act will reduce federal revenue by $5 trillion between 2025-2034, increasing long-run GDP by 1.2 percent. The Congressional Budget Office forecasts real GDP growth of 1.4% in 2025, rising to 2.2% in 2026 as tax provisions that reduce effective marginal rates on labor income boost work incentives and business investment accelerates.
The inflation impact exhibits a distinct timeline. J.P. Morgan estimates the announced measures could boost Personal Consumption Expenditures prices by 1–1.5% this year, and the inflationary effects would mostly be realized in the middle quarters of the year. This timing reflects the lag between tariff implementation and the pass-through to consumer prices as businesses work through existing inventories and negotiate new supply arrangements.
Fed Chair Jerome Powell emphasized this temporal dimension in his December press conference, noting that inflation from goods should peak in the first quarter or so assuming no major new tariff announcements. He characterized tariffs as likely to be relatively short lived, effectively a one time shift in the price level rather than an ongoing inflation problem.
This distinction—between a one-time price level increase and sustained inflation—matters profoundly for monetary policy. If Powell’s assessment proves correct, the tariff shock will fade from year-over-year inflation calculations by late 2026, allowing price pressures to normalize. But if tariffs trigger second-round effects through wage increases or inflation expectations becoming unanchored, the problem becomes more persistent.
The Federal Reserve’s Impossible Calculus
Perhaps no institution faces a more difficult navigation challenge than the Federal Reserve, which confronts simultaneous threats to both sides of its dual mandate: maximum employment and stable prices.
In December 2025, the Federal Open Market Committee lowered its key overnight borrowing rate by a quarter percentage point, putting it in a range between 3.5%-3.75%. But the decision was anything but unanimous—three members dissented, the highest number since September 2019. Governor Stephen Miran favored a larger half-point cut to support the weakening labor market, while Kansas City Fed President Jeffrey Schmid and Chicago Fed President Austan Goolsbee preferred holding rates steady out of inflation concerns.
This division reflects genuine uncertainty about the economy’s trajectory. The Congressional Budget Office projects the unemployment rate will rise from 4.1 percent at the end of 2024 to 4.5 percent by the end of 2025 and then fall to 4.2 percent by the end of 2026 as tax cut provisions that reduce effective marginal tax rates on labor income increase work incentives.
Powell acknowledged the bind directly: There’s no risk-free path for policy as we navigate this tension between our employment and inflation goals. If the Fed maintains elevated rates to combat tariff-induced inflation, it risks deepening labor market weakness. But if it cuts rates aggressively to support employment, it could validate higher inflation expectations and lose credibility.
The Committee’s latest economic projections show the committee continues to expect inflation to hold above its 2% target until 2028, a sobering assessment that reflects both tariff impacts and the stimulative effects of tax cuts on aggregate demand. For 2026, the Fed penciled in just one additional rate cut—a stark contrast with market expectations earlier in the year for more aggressive easing.
Powell repeatedly blamed tariffs for the inflation overshoot, stating that it is really tariffs that are causing most of the inflation overshoot. But he also stressed the Fed’s commitment to its mandate: Everyone should understand that we are committed to 2% inflation, and we will deliver 2% inflation.
The Fed finds itself in the uncomfortable position of having to look through supply-side price increases caused by tariffs while remaining vigilant that these don’t morph into broader inflation. Historical precedent from the 1970s oil shocks—when the Fed initially accommodated supply-driven inflation, only to face a far more painful disinflation later—weighs heavily on policymakers’ minds.
Net Economic Impact: Reading the Scorecard Through 2027
Synthesizing these opposing forces requires examining consensus forecasts from institutions with different methodological approaches. The picture that emerges shows near-term weakness giving way to moderate acceleration, but with considerable uncertainty bands.
The Congressional Budget Office, in projections released in September 2025, shows real GDP growth decreasing from 2.5% in 2024 to 1.4% this year. The downgrade from its January forecast reflects the negative effects on output stemming from new tariffs and lower net immigration more than offset the positive effects of provisions of the reconciliation act this year.
But 2026 tells a different story. CBO projects real GDP growth rises to 2.2 percent, reflecting the reconciliation act’s boost to consumption, private investment, and federal purchases and the diminishing effects of uncertainty about tariffs. The Federal Reserve Bank of Philadelphia’s Survey of Professional Forecasters, polling 33 economists, found consensus expectations of real GDP to grow at an annual rate of 1.9 percent in 2025 and 1.8 percent in 2026.
Goldman Sachs takes a more optimistic view in its 2026 outlook, forecasting 2.6% GDP growth driven by three factors: fading tariff impacts, tax cut stimulus (including an estimated $100 billion in additional tax refunds), and more favorable financial conditions from Fed rate cuts and deregulation initiatives.
On employment, the outlook remains mixed. The unemployment rate has drifted higher through 2025 as businesses navigate policy uncertainty around trade, immigration, and government downsizing. While the tax cuts’ labor supply incentives should support employment growth, the adjustment process takes time.
Real wage growth—nominal wage increases adjusted for inflation—represents perhaps the most important metric for household welfare. The CBO expects nominal wage growth to moderate but remain positive, while inflation gradually declines toward target. This implies modest real wage gains for workers, though the distribution varies significantly by income level and industry exposure to tariffs.
Corporate earnings present a sector-specific picture. Companies with primarily domestic operations and low import dependency benefit from both lower tax rates and reduced competition from foreign producers. The S&P 500 reached new highs in late 2025, reflecting optimism about tax-enhanced profitability. But retailers, manufacturers dependent on imported components, and export-oriented firms face margin compression from tariffs and potential foreign retaliation.
Winners, Losers, and the Distribution Question
No fiscal policy of this magnitude affects all Americans equally. The distributional consequences reveal important equity considerations that transcend partisan debates.
The Urban-Brookings Tax Policy Center analyzed the original 2017 tax cuts and found that the top 5% of earners would get 45% of the benefits if extended. While the 2025 legislation adds provisions like tip income deductions that benefit lower earners, the basic structure remains tilted toward higher-income households who pay the lion’s share of income taxes.
Consider the math for different household types. A single parent earning $45,000 annually receives modest benefit from the slightly higher standard deduction and child tax credit—perhaps $300-500 in reduced tax liability. A married couple earning $250,000 sees benefits exceeding $5,000 from bracket relief alone, before accounting for other provisions.
Meanwhile, tariff costs fall regressively. Lower-income households spend a larger share of their budgets on goods subject to tariffs—clothing, household items, electronics. The Tax Foundation’s estimate of $1,200-1,400 in average household costs masks wide variation: a $35,000 household loses 3-4% of purchasing power, while a $150,000 household loses 0.8-1%.
Industry and occupational groups face divergent fortunes. Domestic manufacturers without import dependencies—particularly in industries protected by tariffs—gain on multiple fronts: lower taxes, reduced foreign competition, and potentially higher prices. Construction workers benefit from permanent full expensing provisions that encourage building investment. Financial services firms profit from increased lending as businesses deploy tax savings.
Conversely, retailers dependent on imported goods face a squeeze. Major companies including Walmart and Dollar General have announced price increases as they pass costs to consumers. Consumer goods companies like Procter & Gamble, Kraft Heinz, and Conagra have announced they are raising prices as a result of tariff costs.
Geographic distribution matters too. High-tax states like New York, California, and New Jersey see residents benefit from the increased SALT deduction cap, raising the deduction to $40,000 from $10,000. But these states also contain concentrations of import-dependent businesses and price-sensitive consumers.
Global Ripples: Trade Partners React
America’s fiscal choices reverberate globally through multiple channels. The tariff regime has already triggered retaliatory measures from major trading partners. China, the EU, and others have implemented countermeasures targeting U.S. exports, with agriculture particularly vulnerable.
The Peterson Institute for International Economics models suggest the combined effect of U.S. tariffs and foreign retaliation could offset more than two-thirds of the long-run economic benefit of Trump’s proposed tax cuts. This underscores how trade policy can substantially erode the gains from pro-growth tax reform.
Currency markets have responded to the shifting policy mix. The dollar initially strengthened on expectations of higher growth and interest rates, but then by May 10, it had depreciated by 5 percent relative to most major currencies, reflecting concerns about fiscal sustainability and potential capital outflows.
For Europe, the impact manifests through reduced export demand and investment uncertainty. J.P. Morgan’s Raphael Brun-Aguerre noted that activity has been running at an annualized rate of 0.9% in the first half of 2025, and we expect activity to moderate in the second half of the year with a negative direct and indirect impact from tariffs.
Supply chain realignment represents perhaps the most significant long-term effect. Businesses are reassessing their global footprints, with many considering nearshoring to Mexico or friendshoring to allied nations. This restructuring involves substantial costs and takes years to fully implement, creating ongoing uncertainty that weighs on investment decisions.
Scenarios: Base, Bull, and Bear Cases
Given the interplay of tax cuts, tariffs, monetary policy, and unpredictable factors like geopolitical developments, economic forecasting requires scenario analysis with assigned probabilities.
Base Case (55% probability): Tax cuts drive GDP growth to 2.0-2.3% in 2026 after a sluggish 1.4-1.5% in 2025. Tariff inflation peaks in Q1 2026 around 3.5% (core PCE) before moderating to 2.4-2.6% by year-end. The Federal Reserve cuts rates modestly—two quarter-point reductions in 2026—while maintaining a cautious stance. Unemployment stabilizes around 4.3-4.5% as labor market adjusts. The combined deficit impact reaches approximately $3.4 trillion over a decade after accounting for tariff revenues and economic growth effects. Stock markets continue gradual appreciation on earnings growth, though volatility persists around policy announcements.
Bull Case (25% probability): Trade negotiations produce meaningful tariff rollbacks by mid-2026, reducing inflation pressures faster than expected. Tax cut stimulus exceeds consensus forecasts as business investment responds strongly to full expensing provisions. GDP growth reaches 2.6-2.8% in 2026, unemployment falls to 4.1%, and inflation returns to near-target by late 2026. The Fed cuts rates more aggressively—four reductions through 2026—as dual mandate tensions ease. Productivity gains from AI and technology adoption begin materializing. Fiscal costs come in lower than projected as dynamic revenue effects prove stronger. Markets rally 12-15% in 2026 on improving fundamentals.
Bear Case (20% probability): Tariffs escalate further with major retaliation from trading partners, pushing peak inflation to 4.5-5% in early 2026. Tax cuts fail to generate expected investment response as elevated uncertainty keeps businesses cautious. GDP growth stagnates at 1.0-1.3% through 2026, while unemployment rises to 4.8-5.0%. The Federal Reserve faces impossible tradeoff: cutting rates risks unanchoring inflation expectations, while holding firm deepens recession risk. Long-term interest rates spike as bond markets react to ballooning deficits, adding $725 billion in extra debt service over the decade. Markets correct 15-20% on stagflation concerns. Political gridlock prevents policy adjustments.
Timeline: Quarter-by-Quarter Roadmap
Q1 2026 (January-March): Peak tariff inflation pressure as businesses fully pass through costs accumulated in 2025. Core PCE inflation likely reaches 3.3-3.5%. Tax refund season delivers approximately $100 billion to households from 2025 provisions. Federal Reserve holds rates steady at January meeting, evaluating incoming data. Labor market shows early stabilization with unemployment around 4.4%. Congressional debates over deficit begin intensifying.
Q2 2026 (April-June): Inflation begins moderating as tariff base effects fade from year-over-year calculations. GDP growth accelerates to 2.3-2.5% annualized rate as tax cut stimulus gains traction and businesses complete inventory adjustments. Federal Reserve likely implements first rate cut of the year, signaling confidence that tariff inflation is transitory. Consumer spending strengthens on improved real wage growth. Housing market shows renewed activity on lower mortgage rates.
Q3 2026 (July-September): Economic picture clarifies with six months of post-tax-cut data. Inflation target of 2.5-2.7% core PCE suggests Fed successfully navigated dual mandate tensions. Business investment data reveals whether full expensing provisions are generating anticipated capital formation. Trade deficit trends indicate whether tariffs achieved administration’s rebalancing goals. Unemployment stabilizes around 4.2-4.3%.
Q4 2026 (October-December): Fed delivers potential second rate cut if inflation and labor market data cooperate. Markets begin pricing 2027 outlook. Congressional Budget Office releases updated 10-year projections incorporating actual policy effects. Financial markets assess whether deficit trajectory is sustainable. Holiday retail sales provide critical real-time indicator of consumer health.
Critical Indicators to Monitor
Several data points will provide early signals of which scenario is unfolding:
Monthly CPI and PCE Reports: Track month-over-month changes in core inflation, particularly goods categories most exposed to tariffs. Sequential deceleration would confirm Powell’s transitory thesis.
Employment Situation Reports: Beyond headline payroll numbers, watch labor force participation rates and real wage growth (nominal wages minus inflation). Strong participation suggests tax cuts are incentivizing work.
Business Investment Data: Equipment and intellectual property investment figures reveal whether companies are deploying tax savings productively or hoarding cash amid uncertainty.
Import/Export Prices: Leading indicators of tariff pass-through and retaliation effects. Stabilization would signal trade tensions easing.
Consumer Confidence Surveys: Forward-looking household sentiment about income prospects and inflation expectations.
Federal Reserve Minutes and Fed Speak: Watch for shifts in committee consensus about inflation persistence versus labor market fragility.
Long-term Treasury Yields: Bond market’s assessment of fiscal sustainability. Sustained moves above 4.5% on 10-year notes would signal deficit concerns.
The Fiscal Reckoning Ahead
Beyond 2026 lies a longer-term question that transcends the immediate growth-versus-inflation debate: fiscal sustainability. The CBO projects debt held by the public will rise from 100 percent of GDP in 2025 to 118 percent by 2035, exceeding any level in American history.
The One Big Beautiful Bill Act adds materially to this trajectory. On a dynamic basis—accounting for economic growth effects—the Tax Foundation estimates the OBBB would increase federal budget deficits by $3.0 trillion from 2025 through 2034, and increased borrowing would add $725 billion in higher interest costs over the decade.
This matters because bond markets have finite patience for fiscal expansion, particularly when growth expectations don’t justify borrowing levels. The experience of the United Kingdom in 2022, when ambitious tax cuts sparked bond market turmoil and forced policy reversal within weeks, serves as a cautionary tale.
The counter-argument holds that reasonable debt-to-GDP ratios depend on growth rates and borrowing costs. If tax cuts generate sustained productivity improvements and GDP growth remains above interest rates, the debt dynamics remain manageable. Proponents point to decades of fiscal space afforded by reserve currency status and deep capital markets.
What’s incontrovertible is that interest costs are rising rapidly as a share of the federal budget. This crowds out other spending priorities and reduces fiscal flexibility for future crises. The political economy challenge—how to address long-term fiscal imbalances when short-term incentives favor tax cuts and spending increases—remains unresolved.
What This Means for Stakeholders
For Households: The net effect depends critically on income level and consumption patterns. Higher earners with diversified investments and professional incomes gain unambiguously from tax cuts. Middle-income families see modest benefits that may be partially offset by tariff-driven price increases on goods. Lower-income households face challenging math: nominal tax benefits often prove smaller than real income erosion from inflation.
The prudent household strategy involves locking in lower borrowing costs where possible (refinancing mortgages, consolidating high-interest debt), building emergency savings to weather labor market volatility, and maintaining flexibility in spending patterns as relative prices shift.
For Businesses: The calculus varies dramatically by sector, import dependency, and customer base. Companies should scenario-plan across tariff persistence versus rollback, model cash flows under different Fed rate paths, and evaluate whether full expensing provisions justify accelerated capital investment. Supply chain diversification—while costly—may provide valuable optionality if trade policy remains volatile.
Service businesses with domestic operations benefit cleanly from tax cuts without significant tariff exposure. Manufacturers must weigh reduced tax rates against higher input costs. Retailers face margin compression that may require pricing power or operational efficiency gains to offset.
For Investors: Portfolio construction should account for regime change from the low-rate, low-inflation era. Fixed income faces ongoing repricing as long-term rates adjust to fiscal realities. Equity valuations near record highs embed optimistic assumptions about earnings growth that may not materialize if stagflation risks increase.
Sector rotation strategies favor domestically-oriented companies with pricing power and low import sensitivity. Technology companies face mixed signals: tax benefits and deregulation support valuations, but some face tariff headwinds on components and consumer electronics. Defensive sectors with inflation-linked revenues (utilities, real estate) may outperform if inflation persists above target.
For Policymakers: The challenge is navigating political economy constraints while addressing legitimate economic concerns. Tariffs provide visible action on trade imbalances but carry significant welfare costs. Tax cuts deliver tangible benefits to constituents but worsen long-term fiscal position.
The optimal policy package would likely involve targeted rather than universal tariffs, offsetting revenue losses from tax cuts with base-broadening reforms rather than deficit spending, and pairing near-term stimulus with credible long-term fiscal consolidation. Political realities make such packages difficult to assemble.
Conclusion: Threading the Needle
As 2026 unfolds, the U.S. economy faces an unusual combination of forces: aggressive fiscal stimulus colliding with trade-induced inflation, an uncertain monetary policy response, and longer-term fiscal clouds on the horizon. The most likely outcome—captured in the base case scenario—sees the tax cut tailwind eventually overcoming tariff headwinds after a bumpy first half, delivering moderate growth with inflation gradually returning toward target.
But the probability distribution is wide. Success requires multiple things going right simultaneously: tariffs causing only temporary inflation without second-round effects, tax cuts spurring productive investment rather than consumption or financial engineering, the Federal Reserve threading its dual mandate needle, and fiscal discipline emerging before bond markets force it.
History offers mixed lessons. Supply-side tax cuts in the 1980s coincided with strong growth but also soaring deficits and eventual tax increases. The 2017 tax cuts generated modest economic gains less dramatic than advertised. Tariff regimes—from Smoot-Hawley in the 1930s to more recent steel tariffs—typically impose welfare costs exceeding any protection benefits.
What’s different this time is scale and simultaneity. Never since World War II has the United States combined such aggressive fiscal expansion with trade barriers of this magnitude while starting from elevated debt levels and near-full employment. We are, in a meaningful sense, conducting a macroeconomic experiment in real time.
The most honest assessment acknowledges uncertainty while identifying mechanisms and monitoring signals. The tax cuts will boost after-tax incomes and may spur investment—that’s economically sound. Tariffs will raise prices and distort resource allocation—that’s equally certain. The Federal Reserve can manage one-time price level shifts if inflation expectations remain anchored—that’s theoretically correct but operationally challenging.
For businesses and households, the prudent response involves flexibility: maintaining liquidity, diversifying risk, and avoiding bets that require a specific policy outcome. For policymakers, it demands intellectual honesty about tradeoffs, responsiveness to incoming data, and willingness to adjust course if outcomes diverge from forecasts.
The U.S. economy enters 2026 with considerable underlying strength: dynamic businesses, flexible labor markets, technological leadership, and resilient consumers. The question is whether policy choices harness these strengths or create headwinds that offset them. The answer will emerge quarter by quarter through 2026, providing lessons for generations of economists and policymakers to study.
One thing seems certain: the debate over whether tax cuts or tariffs represent sound economic policy will continue long after we know which forecast proved most accurate. What matters now is clear-eyed analysis of facts as they emerge, rigorous assessment of competing interpretations, and humility about the limits of economic prediction in a complex, dynamic system.
The economy is about to tell us which story is correct. We should listen carefully to what it says.
Discover more from The Economy
Subscribe to get the latest posts sent to your email.


Introduction
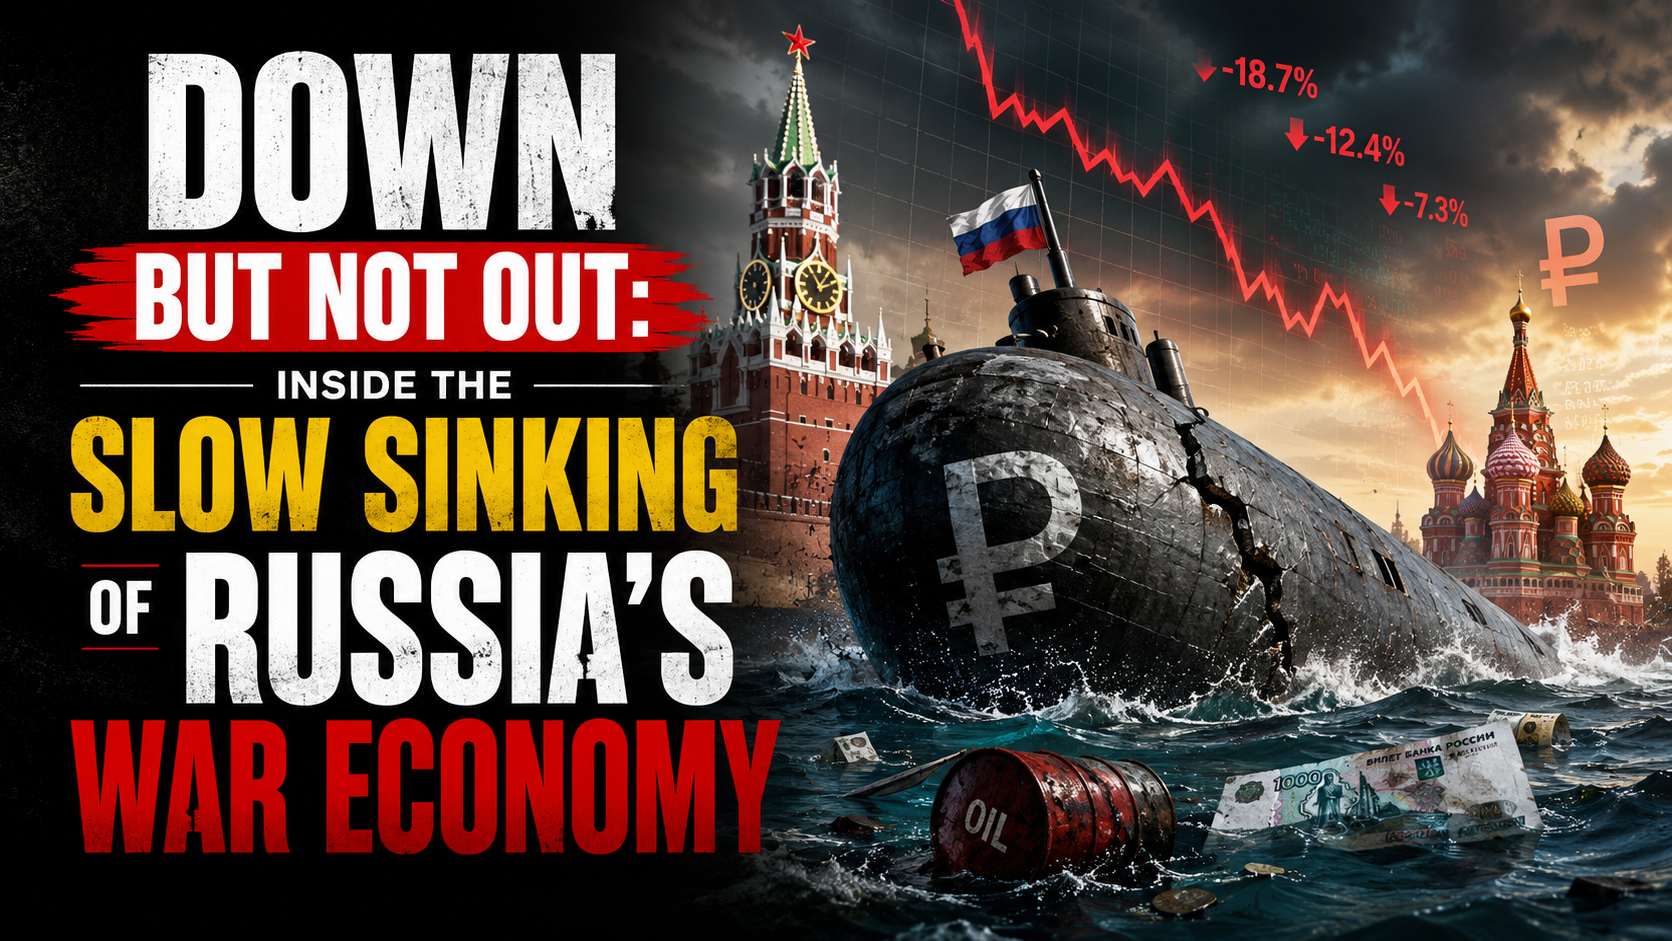
The European Council formally extended its economic sanctions against Russia for another full year on 25 June 2026, keeping restrictive measures in place until 31 July 2027 (Council of the EU). More than four years into the war, the headline story of Russia’s economy has shifted from whether sanctions would work to a more nuanced question: how much longer can the Kremlin keep financing the war before the accumulated strain becomes impossible to hide behind favorable official statistics.
The Sanctions Architecture, Renewed Again
The EU’s economic measures against Russia, first introduced in 2014 and dramatically expanded after the February 2022 full-scale invasion, now span trade, finance, energy and dual-use technology restrictions, alongside asset freezes and travel bans on a broad range of individuals and entities (Council of the EU). Since February 2022, the EU has adopted 20 separate sanctions packages, and the European Council has explicitly stated it remains determined to keep weakening Russia’s war economy by further reducing its energy revenues, curbing shadow-fleet oil shipping operations and constraining its banking system (Council of the EU). Separately, on 3 July 2026 the EU sanctioned six individuals connected to the poisoning and death of opposition figure Alexei Navalny, underscoring that the sanctions regime continues to expand on human-rights grounds as well as economic ones (Council of the EU Sanctions Timeline).
The Headline Numbers Beijing-Style Optimism Can No Longer Explain Away
Russia’s GDP is now put at roughly $2.51 trillion, the world’s eleventh-largest economy — comparable in size to South Korea despite Russia’s vastly larger landmass and resource base — with 2026 growth projected at just 1.0% and inflation running at 5.2% (Statistics of the World). More pessimistic estimates put full-year 2026 growth even lower, at around 0.4%, which would be worse than 2025’s already-weak 1% expansion and would mark a sharp deceleration from the 4.1% growth Russia posted in 2023 as it forged new trading relationships to route around initial sanctions (Forbes).
Oil and gas revenues — historically around half of Russia’s state income — have fallen to roughly a quarter, a deliberate outcome of Western sanctions strategy that targets how much Russia earns from exports rather than blocking those exports outright (Stockholm School of Economics/SITE). Russia’s oil and gas budget revenues reportedly halved in January 2026 alone, with crude prices falling below $73 a barrel before the Middle East conflict briefly reversed the trend, sending Brent surging more than 55% to near $120 a barrel at its peak (Forbes).
The Middle East War: A Temporary Lifeline With Long-Term Costs
The spike in oil prices tied to the Iran conflict, combined with a period of eased US sanctions enforcement on Russian oil under President Trump, offered Moscow unexpected fiscal breathing room in mid-2026 (Forbes). But that same conflict has undermined Russia’s longer-term energy diversification ambitions in the region: two Russian-backed power plant projects in Iran have been put on hold, along with oil and gas exploration work and plans to build new transit routes linking Russia to India via Iran (Forbes).
The Gap Between Official Statistics and Underlying Reality
Perhaps the most important analytical point from recent research is not about any single data point but about the reliability of Russian statistics themselves. Torbjörn Becker of the Stockholm Institute of Transition Economics has argued the real test of sanctions is not whether they end the war overnight, but how much they erode the Kremlin’s capacity to finance it — and by that measure, the evidence points to deeper strain than headline GDP figures suggest (Stockholm School of Economics/SITE). Becker notes that Russia’s economy grew only modestly in 2022 despite oil prices rising sharply that year — a gap between expected and actual performance that implies a considerably larger hidden economic hit than the official contraction figures showed (Stockholm School of Economics/SITE). Compounding the problem, Russian authorities have stopped publishing several key statistics since 2022, making independent assessment of inflation, consumption and real economic conditions increasingly difficult — leading Becker to conclude that “statistics have become part of the narrative” rather than a neutral measure of economic reality (Stockholm School of Economics/SITE).
The Military-Civilian Economic Split
A recurring theme across recent analysis is the growing bifurcation between Russia’s overheating military-industrial sector and a stagnating civilian economy. This imbalance has pushed interest rates higher and forced the liquidation of a striking 71% of Russia’s gold reserves to help fund continued war spending (Forbes). Russia’s total fossil fuel export revenue is estimated at roughly €734 million per day, underscoring just how central hydrocarbon income remains to the entire war financing model even as that revenue stream shrinks (Forbes).
The Counter-Narrative: Wages Still Rising
It would be inaccurate to describe Russia’s economy as in freefall. CSIS research notes that Russian salaries rose 17.8% in nominal terms and 8.7% in real terms in 2024 compared to 2023, with disposable incomes up 6.1% in 2023 and 7.3% in 2024 — growth rates not seen in Russia in almost two decades (CSIS). Government budget projections still expect real salaries to rise, albeit at a decelerating pace: 7% in 2025, 5.7% in 2026 and 4.1% in 2027 — a marked slowdown from the 2024 peak but still roughly double the pre-invasion decade average (CSIS). This wage growth, driven substantially by wartime labor shortages and military-adjacent spending, is precisely the kind of headline-stabilizing data point that has allowed Putin to argue publicly that sanctions have failed to cripple his economy (Fortune) — even as think tanks describe the broader trajectory as pushing Russia toward what one report calls an “economic, political, and military abyss” (Fortune).
What Comes Next
Renewed legislative pressure in Washington — including the Sanctioning Russia Act introduced with strong bipartisan support — signals appetite in the US for tightening the screws further, even as the loss of a key congressional champion for that effort has complicated the political path forward (TIME). Whether the EU’s renewed sanctions regime, continued oil price pressure, and constrained reserves ultimately force a shift in Kremlin calculus toward negotiation remains the central open question for 2027.
Key Takeaways
- The EU has extended Russia sanctions for a further year, through 31 July 2027, continuing a regime built from 20 separate packages since 2022.
- Russia’s 2026 GDP growth is forecast between 0.4% and 1.0%, a sharp deceleration from 2023’s 4.1% post-shock rebound.
- Oil and gas revenue’s share of Russian state income has fallen from roughly half to about a quarter as Western sanctions target export earnings specifically.
- Russia has liquidated a large share of its gold reserves to sustain war financing amid a widening split between an overheating military sector and a stagnating civilian economy.
- Official Russian statistics likely understate the true economic strain, according to independent economists who cite a widening gap between reported and expected performance.
Sources: Council of the EU, Council of the EU Sanctions Timeline, Stockholm School of Economics/SITE, Forbes, Statistics of the World, CSIS, Fortune, TIME
Discover more from The Economy
Subscribe to get the latest posts sent to your email.
The Federal Reserve’s independence faces its most serious test in decades: a Justice Department investigation into Chair Jerome Powell over building-renovation costs, a Supreme Court case over Trump’s attempt to fire Governor Lisa Cook, and an incoming chair nomination openly tied to Trump’s demand for rates cut “by a lot” — all unfolding as the Fed tries to keep monetary policy decisions separate from the White House.
An institutional crisis hiding inside a rate-cut story
Most financial coverage this year has framed the Federal Reserve story as a simple tug-of-war over interest rates. That framing understates what is actually happening: a structural challenge to the 111-year-old convention that US monetary policy sits outside presidential control — a convention every advanced economy has treated as a prerequisite for market credibility.
The three fronts of the fight
1. The Powell investigation. In January, federal prosecutors served grand jury subpoenas tied to Powell’s congressional testimony about roughly $2.5 billion in cost overruns on the Fed’s headquarters renovation. Powell called the inquiry a “pretext” for punishing the central bank for not cutting rates as quickly as the administration wants, and warned it should be viewed “in the broader context of the administration’s threats and ongoing pressure” on the institution (CNBC). Every living former Fed chair signed a joint statement calling the probe an unprecedented attempt to use prosecutorial pressure to undermine central bank independence (NBC News).
2. The Lisa Cook case. The Supreme Court has separately taken up whether Trump can remove Fed Governor Lisa Cook over mortgage-fraud allegations she denies — a case with direct bearing on whether a president can reshape the Fed’s voting board outside the normal confirmation process (Euronews).
3. The succession fight. Trump has said publicly that Powell’s replacement — due when his term as chair ends in 2026 — should be someone who “believes in lower interest rates, by a lot” (Bloomberg). Analysts note this is a break from decades of precedent in which presidents, whatever their private preferences, avoided direct pressure on the Fed’s leadership pipeline.
Why markets are watching the mechanics, not just the rhetoric
It’s worth noting a structural check that has received less attention than it deserves: the Fed chair casts only one of twelve votes on the Federal Open Market Committee. Appointing a more compliant chair does not, by itself, guarantee the rate cuts Trump wants — any change still requires majority support across the full committee (CBS/AOL).
That has not stopped the market repricing. Following Powell’s Jackson Hole remarks suggesting the Fed could act if the labour market kept weakening, traders moved to price an 85% probability of a September rate cut, sending the S&P 500, Nasdaq and Dow higher while the dollar index and Treasury yields fell — a reaction some economists read as evidence that political pressure is already bleeding into policy expectations, independent of the FOMC’s actual vote (Barchart).
At the same time, inflation data complicates the picture for anyone expecting an easy capitulation. The Fed’s preferred inflation gauge, the PCE price index, sat at 2.8% year-over-year as of November — still above the Fed’s 2% target — while the FOMC’s December dot plot showed a more cautious rate path than markets had previously expected, with the median policymaker view placing the federal funds rate in the low-to-mid 3% range by the end of 2026 (CNBC).
Why it matters beyond the US
Central bank independence is not a purely domestic US concern. The dollar’s role as the world’s reserve currency, and Treasury yields’ function as the global risk-free benchmark, mean that any erosion in perceived Fed independence has second-order effects on borrowing costs from London to Karachi. Emerging-market central banks — including the State Bank of Pakistan and Bank Indonesia — routinely calibrate their own policy against expected Fed moves; a Fed seen as politically compromised makes that calibration harder and potentially more volatile for every economy that prices debt off US Treasuries.
RSM chief economist Joe Brusuelas has predicted Powell will use his public platform to mount “an erudite but accessible defense of central bank independence” at upcoming FOMC press conferences — a sign that Fed leadership itself views the institutional question, not just the rate decision, as the story that matters (AOL/CBS).
What to watch next
- Whether the DOJ investigation into Powell produces formal charges or fizzles amid criticism of its timing
- The Supreme Court’s ruling on the Cook removal case, which could set precedent for presidential authority over independent agency officials generally
- Trump’s formal nomination for the next Fed chair, and how openly that nominee campaigns on a specific rate target
- Whether the FOMC’s committee-based voting structure continues to act as a moderating check regardless of who chairs the meetings
The rate-cut headlines will keep coming. The more consequential story is whether the institutional guardrails around the Fed — designed explicitly to keep monetary policy insulated from electoral cycles — hold through 2026.
Discover more from The Economy
Subscribe to get the latest posts sent to your email.

Most headlines on Russia’s economy in July 2026 focus on the latest sanctions package or oil price cap negotiation. The more important story is structural: the model Russia has used to fund its war for four years is showing real signs of running out of road.
The core finding
A research brief from the Center for Strategic and International Studies (CSIS) argues Putin is pushing Russia toward an “economic, political, and military abyss,” according to Fortune. While Russia’s economy remains large — roughly $2.6 trillion — growth is slowing and shrinking on a quarterly basis, with 2026 growth projected at just 0.4%, worse than 2025’s 1% growth, which itself narrowly avoided recession.
Analysts describe Russia’s approach as a form of “military Keynesianism” — the state investing heavily in militarizing the economy while extending financial support to households affected by the war. But per Fortune’s reporting, “after more than four years of war, that well is running dry.” Russia’s fiscal reserves are dwindling, and 71% of the country’s gold reserves have been liquidated to sustain spending.
The number that matters most: oil and gas budget share
The most underreported data point here: the share of oil and gas receipts in Russia’s federal budget revenue fell to just 23% in 2025 — the lowest share in two decades — according to the Oxford Institute for Energy Studies, cited by Fortune. To compensate, Russia has turned to expansive taxation, including raising VAT from 20% to 22% — a move that has proven unpopular domestically.
This matters because Russia’s economy has historically been described, correctly, as fossil-fuel dependent — with oil and gas taxation making up 44% of federal revenues in the decade before the Ukraine invasion, and still around 24.5% over the first three quarters of 2025, according to a Brookings Institution analysis. A further slide to 23% signals the sanctions and diversification pressure are compounding, even as Russia continues finding workarounds through its “shadow fleet.”
The Iran-war reprieve was temporary — and it’s over
The Iran war offered Russia a brief lifeline: Brent crude surged more than 55% at its peak, nearing $120 a barrel, after President Trump eased some sanctions on Russian oil, per Fortune. But that chaos also undermined Russia’s own long-term energy and infrastructure projects in the Middle East — two Russian-linked power plants in Iran were put on hold, along with oil and gas exploration and plans to link Russia to India via Iran through new transit routes. Since then, oil prices have normalized as demand softened and the Strait of Hormuz reopened, removing that temporary cushion.
The sanctions escalation now in motion
The pressure is intensifying on multiple fronts simultaneously. US senators unveiled a sweeping bipartisan Russia sanctions bill in mid-July, which would impose mandatory sanctions on Russian political and military leaders including President Putin, and up to a 100% tariff on the top five countries — including China and India — that purchase Russian crude oil and natural gas, according to CNN. Separately, the EU has been racing to avoid an automatic upward revision of its Russian oil price cap, which would otherwise jump from $44.10 to roughly $58 per barrel if a new sanctions package wasn’t agreed by July 15, per Euronews.
Analysis from the Center for European Policy Analysis notes the outcome depends heavily on whether India and China accept the risk of secondary sanctions: “If China stands firm, Moscow’s dependence on Beijing deepens,” per CEPA. If Russian seaborne oil exports were to fall to near-zero, the budget would lose roughly a quarter of its revenue — an extreme but non-trivial scenario given the pace of legislative and diplomatic pressure building in July 2026.
Why this matters beyond Russia
For countries positioned between Western sanctions regimes and continued Russian energy purchases — including India, and by extension trade partners like Pakistan whose remittance and trade flows intersect with Gulf and South Asian energy markets — the trajectory of Russia’s budget dependency and the secondary-sanctions risk attached to its buyers is a live variable, not a settled one. A further deterioration in Russia’s oil-and-gas revenue share would likely accelerate Moscow’s reliance on China specifically, reshaping regional energy-trade alignments well beyond the Russia-Ukraine conflict itself.
FAQ
What percentage of Russia’s federal budget comes from oil and gas? 23% in 2025 — the lowest share in two decades, according to the Oxford Institute for Energy Studies.
What is Russia’s projected GDP growth for 2026? 0.4%, according to CSIS research cited by Fortune — down from 1% growth in 2025.
What is “military Keynesianism” in the context of Russia’s economy? A term analysts use to describe Russia’s strategy of heavy state investment in militarizing the economy alongside financial support for war-affected households, functioning as a form of stimulus that is now showing signs of fiscal strain.
Discover more from The Economy
Subscribe to get the latest posts sent to your email.

China Politburo July 2026: Stimulus Signals Explained

Andy Burnham, UK Gilts and Mortgages: July 2026 Explainer

Pakistan’s 2026 Monsoon Floods Threaten Fragile Economic Recovery as Inflation Nears 9%

Pakistan Gulf Investment Outflows 2026: Peace Deal Stakes Explained

Canada Trade Diversification 2026: China, Indonesia, UAE Deals Explained

US Forced-Labour Tariffs on 60 Countries: The Hidden Trade Shock of 2026

Global Central Banks 2026: Fed, BoE and BoJ Decisions Could Reshape Markets

Gulf Capital Retreat From Pakistan 2026: UAE Loan Freeze & What It Means

Pakistan’s Most Reliable Export Is Its People: Remittances Hit $41.6 Billion, Overtaking Total Exports

Indonesia’s Confidence Problem: Record Investment, a Sinking Rupiah, and a Widening Credibility Gap

Down But Not Out: Inside the Slow Sinking of Russia’s War Economy

China’s Growth Slips to a Four-Year Low: Why Beijing Still Won’t Pull the Stimulus Trigger

The Johor-Singapore Corridor: How Malaysia Became Southeast Asia’s AI Infrastructure Powerhouse

Canada’s Economy ‘On Pause’: Inside the CUSMA Deadline That Passed Without a Deal

Carry Trade Unwind 2026: How the Yen’s Snapback Triggered a Global Margin Call

AI Bubble Warning 2026: Why BIS, IMF and Bank of England Fear a Market Crash

BRICS De‑Dollarization Strategy Takes Shape with $15 Billion Local‑Currency Push

The AI Super Bubble Is Ready to Burst

Russia Bans Diesel Exports 2026: Global Fuel Market Impact Explained

Strait of Hormuz Blockade 2026: Oil Prices Surge 9% as US-Iran Conflict Reignites

Private Credit Warning: Most BDCs Turn Unprofitable in 2026, Reuters Finds

Bitcoin $150k Milestone Achieved as US Sovereign Crypto Pivot Looms

IMF Cuts Pakistan Growth Forecast, Raises Inflation to 8.4%
Gulf Capital Retreat From Pakistan 2026: UAE Loan Freeze & What It Means

India Economic Rise 2026: How the Subcontinent Toppled Japan

Strait of Hormuz 2026: Why Markets Still Don’t Trust It’s Open

China Housing Market Turnaround: White‑List Model Stabilises Prices

Chipmakers Just Lost 6.7% in Two Days: Inside the Great AI Trade Rotation
-

 Markets & Finance7 months ago
Top 15 Stocks for Investment in 2026 in PSX: Your Complete Guide to Pakistan’s Best Investment Opportunities
-

 Analysis5 months ago
Johor’s Investment Boom: The Hidden Costs Behind Malaysia’s Most Ambitious Economic Surge
-

 Analysis5 months ago
Top 10 Stocks for Investment in PSX for Quick Returns in 2026
-

 Analysis6 months ago
Brazil’s Rare Earth Race: US, EU, and China Compete for Critical Minerals as Tensions Rise
-

 Banks6 months ago
Best Investments in Pakistan 2026: Top 10 Low-Price Shares and Long-Term Picks for the PSX
-

 Investment7 months ago
Top 10 Mutual Fund Managers in Pakistan for Investment in 2026: A Comprehensive Guide for Optimal Returns
-

 Global Economy7 months ago
15 Most Lucrative Sectors for Investment in Pakistan: A 2025 Data-Driven Analysis
-

 Global Economy7 months ago
Pakistan’s Export Goldmine: 10 Game-Changing Markets Where Pakistani Businesses Are Winning Big in 2025