
Global Economy
US Businesses and Consumers Shoulder 90% of Tariff Costs, NY Fed Research Reveals—Undercutting Trump’s Claims

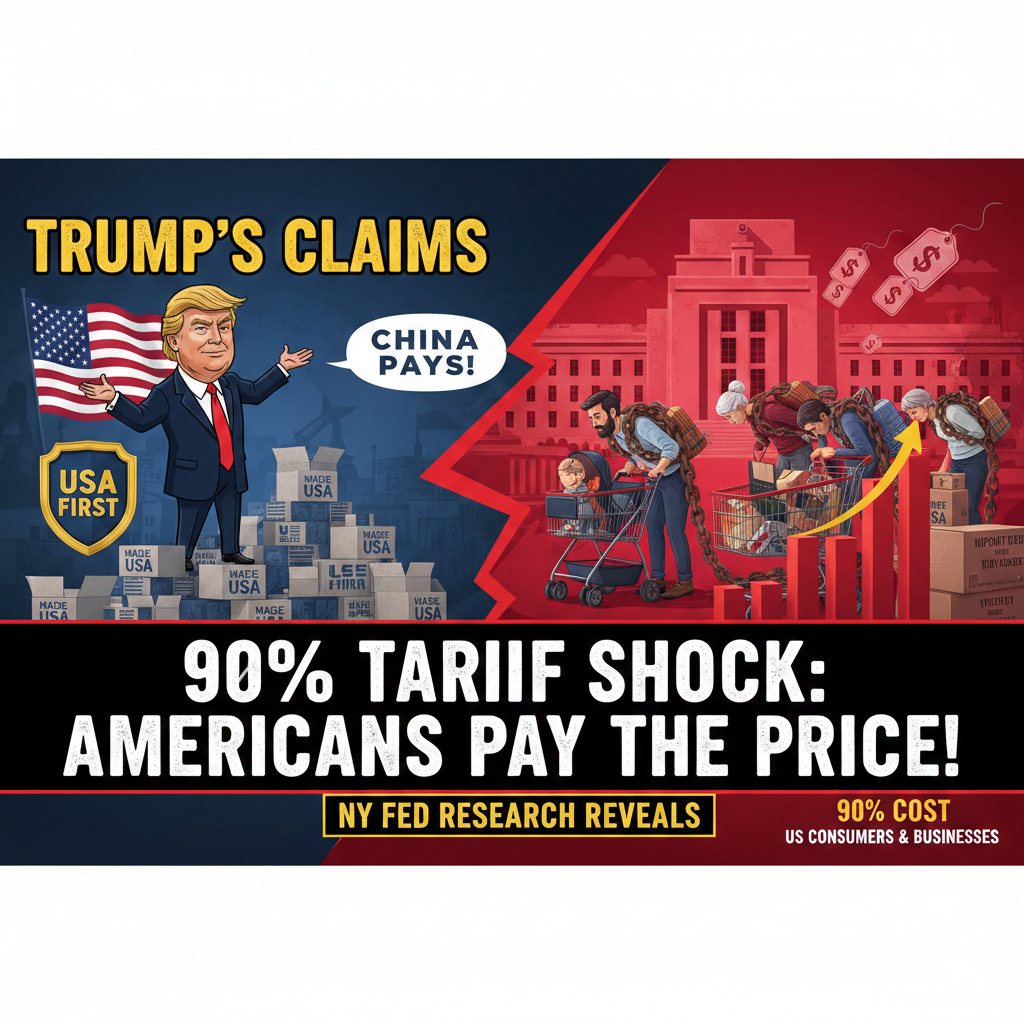
As prices at the checkout line keep climbing, new Federal Reserve data exposes an uncomfortable economic truth: Americans—not China or Europe—are footing the bill for President Trump’s tariff policies.
When Susan Martinez, a small business owner in suburban New Jersey, noticed her wholesale costs for imported electronics jump by 18% last spring, she faced an impossible choice: absorb the hit to her already-thin profit margins or pass the increase to customers still reeling from years of high inflation. She chose survival—raising prices by 12% and watching foot traffic drop.
Martinez’s predicament isn’t unique. It’s the lived experience of businesses across the New York-Northern New Jersey region that have faced difficult decisions about whether to absorb tariffs through lower profits or raise prices to recover higher costs, according to a groundbreaking May 2025 study from the Federal Reserve Bank of New York. The findings directly contradict the Trump administration’s central claim that foreign nations bear the brunt of import duties.
The Data Doesn’t Lie: Who Really Pays for Tariffs?
The numbers are stark and unequivocal. Roughly three-quarters of manufacturers and service firms passed along at least some of their tariff-induced cost increases to consumers, with nearly a third of manufacturers and almost half of service companies transferring the full cost, the NY Fed’s Regional Business Surveys revealed in June 2025.
But the economic pain doesn’t stop there. More recent analysis from the Kiel Institute for the World Economy, published in January 2026, found that Americans are paying 96% of the cost of tariffs, while foreign exporters are absorbing about 4%—a finding based on analyzing over 25 million shipment records from more than $4 trillion in U.S. imports.
Tariff Burden Distribution: Who Pays What?
| Time Period | US Consumers | US Businesses | Foreign Exporters | Source |
|---|---|---|---|---|
| June 2025 | 22% | 64% | 14% | Council on Foreign Relations |
| August 2025 | 37% | 51% | 9% | Goldman Sachs |
| Mid-2026 (Projected) | 67% | 8% | 25% | Council on Foreign Relations |
| Overall 2025 | ~40% | ~56% | ~4% | Kiel Institute |
The progression tells a troubling story: by the middle of 2026, importers will bear only about 8% of tariff costs, with the consumer share rising to 67% and the exporter burden increasing to about 25%. In the end, U.S. consumers will shoulder roughly two-thirds of Trump’s tariffs—a far cry from the “China pays” narrative promoted during campaign rallies.
The Speed of Economic Pain: How Fast Did Prices Rise?
Perhaps most striking is how rapidly businesses translated tariff costs into higher prices for American households. The NY Fed found that over half of both manufacturers and service firms raised prices within a month of experiencing tariff-related cost increases—many within a day or week.
This swift transmission demolished any hope that businesses might absorb costs long enough for trade negotiations to reduce duties. Instead, companies acted decisively to protect profit margins, knowing customers had few alternatives as tariffs hit entire product categories simultaneously.
The Federal Reserve’s real-time monitoring confirms this pattern. The Fed constructed theoretical predictions of tariff effects based on implemented tariff changes and the prevalence of imports in each category, then tracked whether actual price data matched predictions. The answer was a resounding yes—tariffs showed up quickly in consumer prices, adding approximately 0.4 percentage points to the core Personal Consumption Expenditures price index by late 2025.
The Household Tax Americans Didn’t Vote For
Research from the nonpartisan Tax Foundation quantifies the impact in terms every family can understand: Trump’s tariffs amount to an average tax increase per US household of $1,000 in 2025 and $1,300 in 2026. For context, that’s more than many families saved from recent tax cuts—a point not lost on economists tracking real household incomes.
The Tax Policy Center’s analysis goes further, breaking down impacts by income level. The average federal tax rate will rise by 1.9 percentage points for households in the bottom quintile—compared with a 1.4 percentage point increase for those in the top quintile. In other words, tariffs function as a regressive tax, hitting lower-income Americans disproportionately hard.
Household Impact by Income Level (2026 Estimates)
| Income Quintile | Average Tariff Burden | Effective Tax Rate Increase |
|---|---|---|
| Bottom 20% | $900 | +1.9 percentage points |
| Middle 20% | $1,400 | +1.7 percentage points |
| Top 20% | $3,200 | +1.4 percentage points |
| Top 1% | $8,500 | +1.2 percentage points |
Source: Tax Policy Center, January 2026
While wealthier households pay more in absolute dollars, the burden as a share of income falls heaviest on working- and middle-class families—precisely the demographic Trump promised to protect.
Trump’s Claims vs. Economic Reality
The disconnect between presidential rhetoric and economic evidence has rarely been more pronounced. Throughout 2025 and into 2026, President Trump repeatedly insisted that foreign countries pay U.S. tariffs. “The claim that foreign countries pay these tariffs is a myth,” countered Julian Hinz, research director at the Kiel Institute.
The confusion stems partly from how tariffs technically work. As U.S. Customs and Border Protection bills the U.S. importer directly, it is the importer which pays the tariffs. That importer then faces the same choice Susan Martinez confronted: accept lower profits, negotiate price cuts from foreign suppliers, or raise prices for American consumers.
Economic theory and decades of empirical evidence predict the outcome—and recent data confirms it. A paper by Alberto Cavallo and coauthors, cited by Trump himself to defend his policies, actually undermines his claims. The retail pattern points to higher prices for imported items, with spillovers into domestic prices as well, with the authors emphasizing that retail tariff pass-through is 24 percent, contributing roughly 0.76 percentage points to the all-items Consumer Price Index by October 2025.
The Manufacturing Jobs Mirage
Beyond consumer prices, Trump justified tariffs as essential to reviving American manufacturing and reshoring jobs lost to overseas production. The results? Exactly opposite.
Manufacturing employment has declined by approximately 59,000 jobs since Trump’s April tariff announcement, with durable goods manufacturers—those making cars, appliances, and electronics—bearing the brunt, according to Labor Department figures through late 2025.
The broader employment picture looks similarly grim. U.S. job openings fell to 6.54 million in December, the lowest level in more than five years, while total manufacturing employment has dropped each month since April, according to data compiled by NewsNation from federal sources.
Manufacturing Employment Trends (2025)
| Month | Change from Prior Month | Jobs Lost Since April |
|---|---|---|
| April 2025 | 0 (baseline) | 0 |
| August 2025 | -18,000 | -35,000 |
| December 2025 | -12,000 | -59,000 |
Source: Bureau of Labor Statistics
The irony is palpable: policies designed to protect American workers have instead created exactly the job losses they were meant to prevent. A respondent from the petroleum and coal industry reported: “No major changes at this time, but going into 2026, we expect to see big changes with cash flow and employee head count. The company has sold off a big part of the business that generated free cash while offering voluntary severance packages to anyone”, according to the Institute for Supply Management’s November survey.
Inflation’s Unwelcome Return
Just as the Federal Reserve appeared to be winning its battle against post-pandemic inflation, tariffs threw a wrench into monetary policy. Chair Powell said at a panel that “in effect, we went on hold when we saw the size of the tariffs and essentially all inflation forecasts for the United States went up materially as a consequence of the tariffs”.
The inflationary impact manifests across multiple channels:
Direct Price Increases: The Federal Reserve Bank of St. Louis researchers found that tariffs accounted for 0.5 percentage points of headline inflation and 0.4 percentage points of core inflation between June and August 2025.
Goods Sector Revival: After years of deflationary pressures helping offset sticky services inflation, core goods prices rose by 1.4% year-over-year in late 2025—the highest non-pandemic increase since 2011. Companies exhausting their pre-tariff inventories were forced to pass higher costs directly to consumers.
Broad Category Effects: The Yale Budget Lab estimates that current tariff policies cost each household $1,800 on average in 2025, with apparel prices rising 17% and food prices climbing 2.8% due to tariffs alone.
Looking ahead, PCE inflation is expected to average about 2.6% for 2025, but with businesses passing on more tariff costs to consumers, inflation forecasts show a rise to 2.7% in 2026, according to Morningstar’s analysis.
Sector-by-Sector Breakdown: Where Tariffs Hit Hardest
Not all industries felt tariff impacts equally. The NY Fed’s survey revealed telling patterns:
Automotive Sector: Perhaps hardest hit, with J.P. Morgan estimating car prices would increase by $4,711 with the 25% tariff on imported vehicles. Companies like Stellantis and major European manufacturers faced impossible choices about production location versus market access.
Retail and Consumer Goods: One large retailer’s average costs had increased around 20% year-over-year because of tariffs, and it was trying to determine how it would distribute these increases, according to commentary from the Cleveland Fed.
Technology and Electronics: Supply chain disruptions combined with direct tariff costs to create double-digit cost increases for many tech importers and retailers.
Agriculture and Food: Despite being shielded from some tariff categories, food prices climbed 2.8% due to tariffs alone, as import costs for ingredients and processing equipment rippled through supply chains.
Business Adaptation Strategies: Survival Tactics
Faced with tariff shocks, companies deployed various survival strategies beyond simple price increases:
Supply Chain Reshuffling: A significant share of businesses reported increasing purchases from within the United States and a similar share reported a decline in imported goods, though this proved difficult for products without domestic alternatives.
Inventory Front-Loading: Just under a third of manufacturers and service firms reported increasing their inventory levels, partly to get ahead of rising tariffs and build a buffer against potential supply shortages.
Strategic Pricing: Some businesses raised prices on non-tariffed goods alongside tariffed items, taking advantage of an escalating pricing environment to increase prices more broadly—similar to how firms raised dryer prices when only washers faced tariffs in 2018-19.
Margin Compression: Unable to fully pass through costs, many businesses accepted lower profitability, with Goldman Sachs estimating that companies that use or sell imported goods bear a larger share of tariff costs than the net 22% figure suggests.
The Counterargument: Are There Any Benefits?
Proponents argue tariffs could eventually yield benefits, despite short-term pain:
Domestic Manufacturing Investment: Trump points to announced factory investments and claims of an “American economic miracle” in recent Wall Street Journal commentary, crediting tariffs with creating growth momentum.
National Security: Some industries critical to defense and infrastructure might justify protection from foreign competition, even at economic cost.
Negotiating Leverage: Tariffs as bargaining chips could theoretically yield better trade agreements, though analysts and foreign governments expressed confusion over the administration’s tariff strategies and openness to negotiation.
Trade Deficit Reduction: Import restrictions mechanically reduce trade deficits, though economists debate whether bilateral trade balances matter for overall prosperity.
However, these potential benefits must be weighed against documented costs: manufacturing job losses, higher consumer prices, squeezed business margins, elevated inflation, and strained relationships with trading partners. The evidence through early 2026 suggests costs far outweigh benefits for the American economy.
What This Means for 2026 and Beyond
As the calendar turns to 2026, several economic forces are colliding:
Escalating Consumer Impact: With businesses exhausting pre-tariff inventories, core goods prices rose only about a percentage point cumulatively in 2025, but import prices including tariff-related costs were up nearly 10%, meaning US businesses have been footing almost all the tariff bills—but that pretariff inventory is running out.
Federal Reserve Dilemma: The worsening growth and inflation outcomes leave the Fed with a challenging dilemma—absent labor market deterioration, there is a strong case for rates to be on hold indefinitely, yet the more challenging business environment increases the chances of just such a labor market deterioration.
Legal Uncertainty: The Supreme Court is evaluating the legality of Trump’s use of emergency powers to impose sweeping tariffs, with a decision expected in early 2026 that could reshape or eliminate large portions of the tariff regime.
Election Year Politics: With tariffs emerging as a kitchen-table issue affecting household budgets, the political sustainability of current policies faces growing scrutiny from both voters and some Republican lawmakers who threaten to rebel on Trump tariff votes.
The Bottom Line
The economic evidence is overwhelming and consistent across multiple research institutions: American consumers and businesses are bearing the vast majority of tariff costs—somewhere between 88% and 96%, depending on the study and time period. Foreign exporters are absorbing only a small fraction, contrary to repeated claims from the White House.
For ordinary Americans like Susan Martinez, the data translates into everyday financial stress: higher prices at checkout, reduced purchasing power, and economic uncertainty. For manufacturers, it means job losses rather than the promised renaissance. For the Federal Reserve, it complicates the already-delicate task of managing inflation without triggering recession.
“The claim that foreign countries pay these tariffs is a myth” isn’t just an academic point—it’s the difference between economic policy based on evidence versus wishful thinking. As 2026 unfolds, American households will continue feeling the very real costs of that distinction.
Discover more from The Economy
Subscribe to get the latest posts sent to your email.


Banks
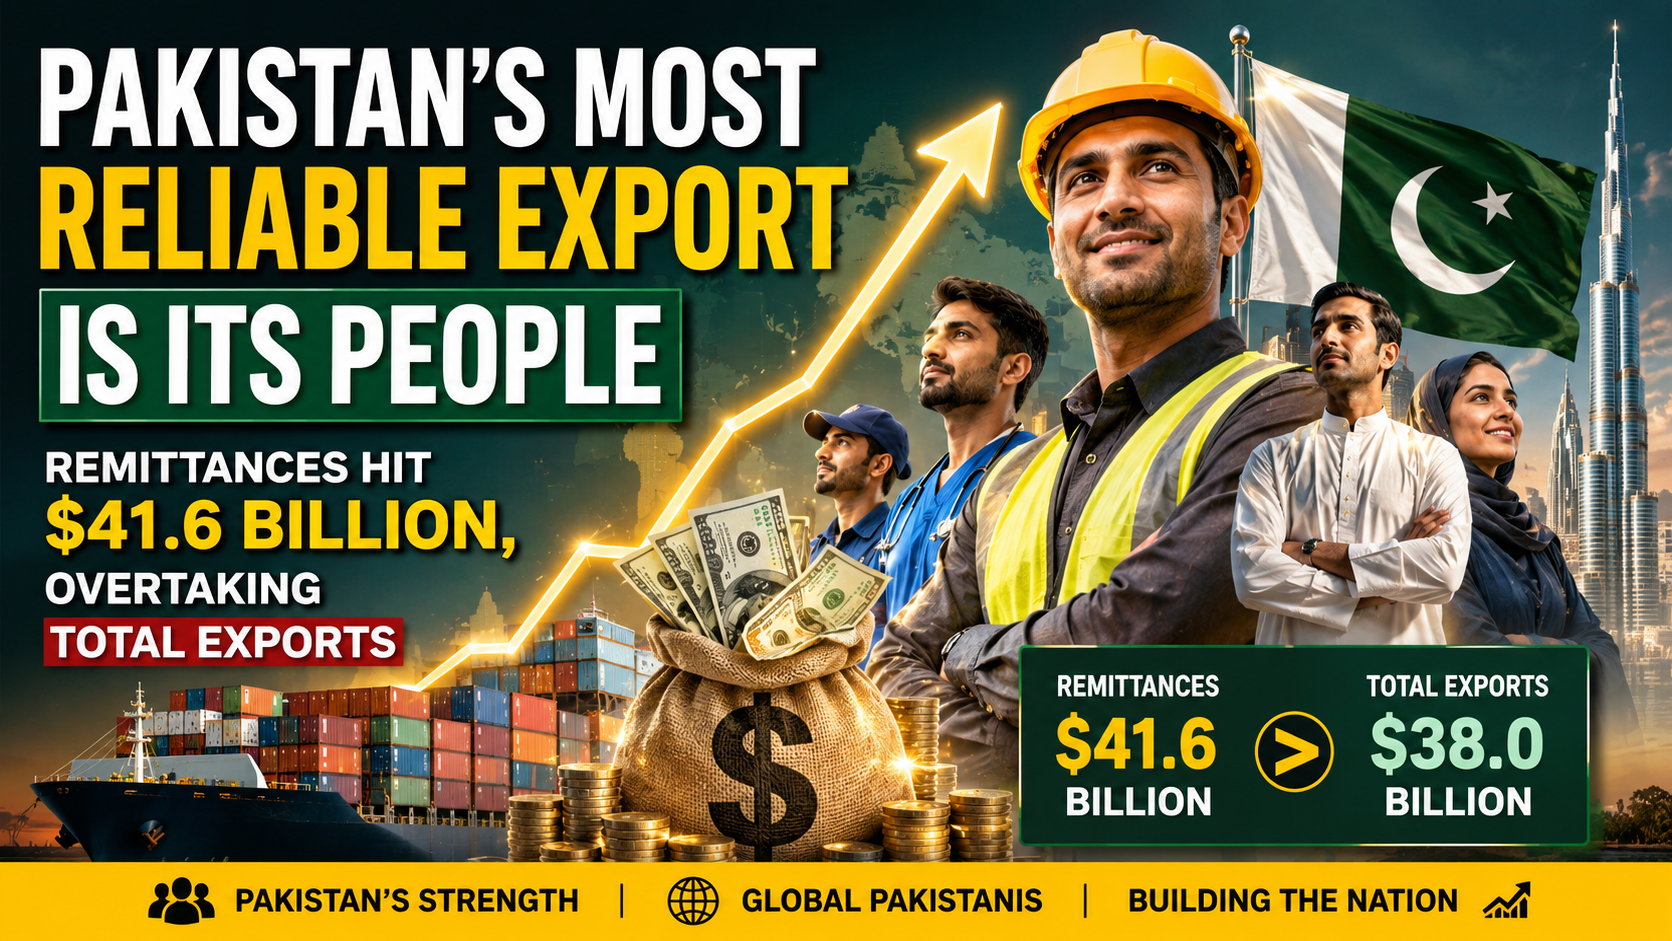
Pakistan’s Most Reliable Export Is Its People: Remittances Hit $41.6 Billion, Overtaking Total Exports
Introduction
For the first time in the country’s history, money sent home by Pakistan’s overseas workers has exceeded the value of everything Pakistan actually sells abroad. Remittances hit a record $41.6 billion in the fiscal year ending June 30, 2026, according to State Bank of Pakistan data — surpassing total merchandise exports for the same period and cementing a structural shift that economists are increasingly uneasy about (VOI World/State Bank of Pakistan).
The Numbers Behind the Milestone
Remittance inflows rose 8.6% year-on-year in FY26, up from $38.3 billion in FY25 (VOI World). Some reporting puts the full 11-month figure even higher at $38 billion before the final month was tallied, with May 2026 alone contributing $4.25 billion — an amount roughly equal to what the entire country spends on imports in a single month (Express Tribune). A separate Express Tribune report puts the full FY26 total even higher, at $41.58 billion, an increase of nearly $3.29 billion over the prior year, delivered “without structured educational, training or welfare support” for the overseas workforce generating it (Express Tribune — Remittances Without Structured Support).
Saudi Arabia remained the single largest source of remittances in June 2026 at $829.6 million, followed by the UAE ($792.3 million), the United Kingdom ($514.9 million) and the United States ($296.8 million), with Italy and Oman each contributing more than $100 million (VOI World). That geographic concentration matters: a substantial share of Pakistan’s remittance base originates from the Gulf, leaving the country’s external account exposed to labor market reforms, economic cycles and geopolitical developments concentrated in a single, currently volatile region (Business Recorder Editorial).
Exports Have Been Stuck for Years
The remittance surge stands in sharp contrast to Pakistan’s export performance, which has shown little sustained dynamism despite years of concessional financing, preferential tariff regimes and subsidized energy for exporters (Business Recorder Editorial). The textile sector — long considered the backbone of Pakistan’s export economy — has been stuck in a $15–18 billion annual range for years, even as a handful of forward-thinking textile groups have managed to grow exports and diversify product lines under the exact same operating conditions others cite as prohibitive (Express Tribune). Separately reported nine-month data for the fiscal year showed exports contracting 5.8% to $23.3 billion even as imports rose nearly 8% to $46.8 billion, widening the trade gap further (Minute Mirror).
Over the three fiscal years from 2023 to 2025, Pakistan received $95.8 billion in remittances compared with $91 billion in merchandise exports — a gap that reflects, according to Business Recorder analysis, a deliberate policy orientation that has effectively institutionalized remittances as the default tool for stabilizing the current account rather than addressing the underlying export weakness (Business Recorder Opinion).
The Dutch Disease Warning
Independent economists have begun explicitly framing this pattern as a precursor to Dutch disease — the phenomenon where a large, easy source of foreign currency inflow reduces the pressure and incentive to build a competitive tradeable export sector (Business Recorder Opinion). The policy dimension is not incidental: under IMF program conditions, a long-standing subsidy that had encouraged banks to actively mobilize remittance transfers was withdrawn in the 2026 Budget, contributing to a temporary slowdown in inflows during the early months of the fiscal year before the government released Rs30 billion from its contingency fund to help revive momentum (Business Recorder Opinion).
A Business Recorder editorial published in July 2026 was blunt about the implication: Pakistan’s overseas workers have effectively become the country’s “most reliable export,” with its own people functioning as its largest export commodity — a framing the editorial explicitly calls an unsustainable foundation for long-term development strategy (Business Recorder Editorial).
The Silver Linings
The remittance boom has provided genuine macroeconomic stabilization. Total liquid foreign reserves crossed $23.98 billion as of early July 2026, including $18.47 billion held by the State Bank of Pakistan itself, with the rupee holding relatively steady around Rs278 per dollar in the interbank market (Express Tribune — Remittances Without Structured Support). Inflation has also been easing, and large-scale manufacturing showed signs of recovery with 5.9% growth in earlier-reported data, while agricultural lending rose 14.4% during July–February, extending credit access to farmers (Minute Mirror). Separately, Pakistan has reportedly repaid roughly Rs4,722 billion in debt ahead of schedule and posted a historic milestone in IT sector exports, suggesting pockets of genuine structural improvement exist alongside the broader export stagnation (Radio Pakistan).
Why This Matters Beyond Pakistan
Pakistan’s experience is a useful case study for other remittance-dependent emerging economies navigating IMF program conditions. The core tension — using a reliable, low-effort capital inflow to paper over a harder structural problem in the tradeable goods sector — is not unique to Pakistan, but few economies illustrate the scale of the imbalance as starkly as a country where remittances now formally exceed total exports.
Key Takeaways
- Pakistan’s FY26 remittances hit a record $41.6 billion, surpassing total merchandise exports for the first time in the country’s history.
- Saudi Arabia and the UAE remain the largest single sources, concentrating external account risk in the Gulf region.
- Textile exports have been stuck between $15–18 billion annually for years despite sustained government support.
- Economists are increasingly framing the remittance-export imbalance as a Dutch disease risk rather than a stabilization success story.
- Reserves have strengthened to nearly $24 billion and the rupee has stabilized, but the underlying export competitiveness problem remains unresolved.
Sources: VOI World, Express Tribune — Remittances Dwarf Exports, Express Tribune — Remittances Without Structured Support, Business Recorder Opinion, Business Recorder Editorial, Minute Mirror, Radio Pakistan
Discover more from The Economy
Subscribe to get the latest posts sent to your email.
Markets & Finance
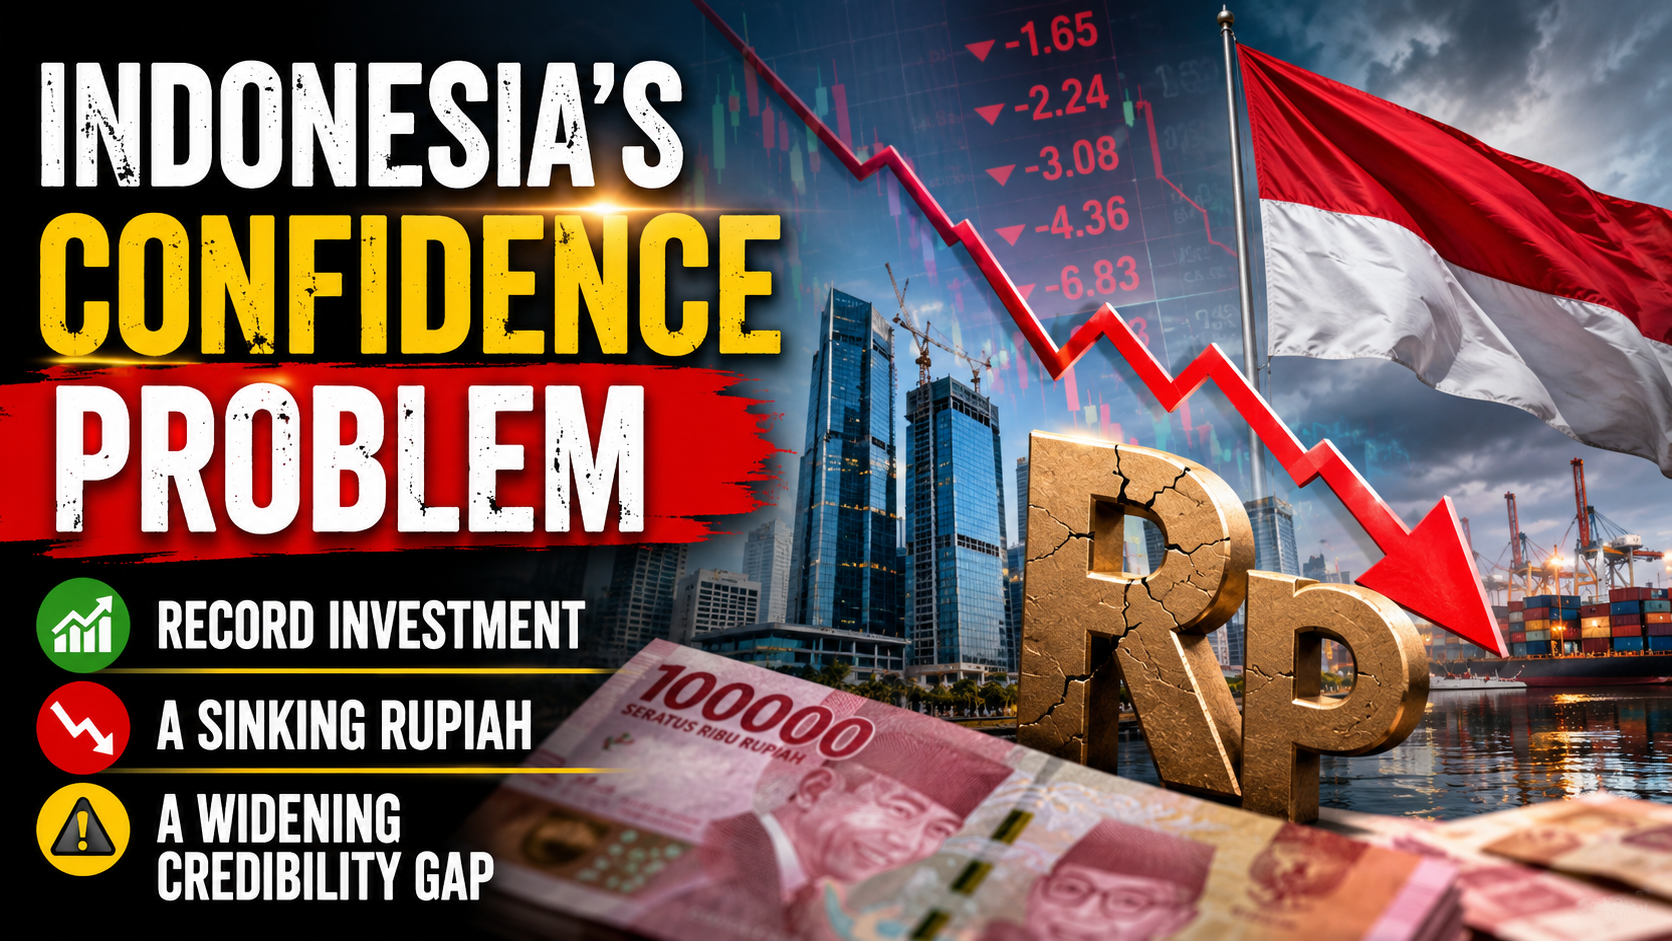
Indonesia’s Confidence Problem: Record Investment, a Sinking Rupiah, and a Widening Credibility Gap
Introduction
Indonesia’s economic story in mid-2026 is one of genuine contradiction. On one hand, the government posted a record Rp1,010.6 trillion ($56.1 billion) in realized investment for the first half of the year, up 7.2% from a year earlier and on pace to hit its full-year target (Antara News). On the other, the rupiah has been sliding toward Rp18,000 per US dollar, the state budget deficit has widened, and a growing chorus of domestic commentators is warning that Indonesia risks permanently losing what one Jakarta Post analysis called “the vital game of investor confidence” (The Jakarta Post).
The Investment Numbers Look Genuinely Strong
Indonesia’s Investment and Downstreaming Minister Rosan Roeslani reported that first-half 2026 investment realization reached 49.5% of the government’s full-year target of Rp2,041.3 trillion, creating 1.44 million jobs — a 15% increase in job creation compared to the first half of 2025 (Antara News). Domestic and foreign investment remained almost perfectly balanced, with foreign direct investment reaching Rp507.6 trillion (50.2% of the total) against Rp502.9 trillion in domestic investment (Antara News). Notably, investment outside the country’s most populous island, Java, exceeded inflows into Java itself for the first time in this dataset — Rp507.8 trillion versus Rp502.8 trillion — supporting the government’s long-standing goal of more balanced regional development (Antara News).
Singapore remained by far Indonesia’s largest source of foreign capital at $8.8 billion, followed by Hong Kong ($7.6 billion), China ($3.9 billion), Japan ($1.9 billion) and the United States ($1.7 billion) — together accounting for roughly 77.8% of all foreign direct investment into the country (Antara News). Second-quarter investment specifically rose 7.1% year-on-year to Rp511.8 trillion, with Minister Roeslani noting that investor commitment to Indonesia has held up despite significant “geopolitical and geoeconomic challenges” globally (The Jakarta Post).
But the Pace Is Slowing, and the Currency Is Under Pressure
Despite the record absolute figures, the Jakarta Post notes that investment growth in 2026 has been running at a distinctly slower pace than the country achieved in recent prior years, even as it remains on track to hit the annual target (The Jakarta Post). Meanwhile Bank Indonesia has had to actively respond to renewed rupiah weakness, attributing the currency’s slide toward Rp18,000 per dollar to hawkish signals from Federal Reserve officials and broader movements in the US dollar index (Samuel Sekuritas Daily Economic Insights). The state budget deficit reached Rp196.5 trillion in the first half of 2026, equivalent to 0.76% of GDP (Samuel Sekuritas Daily Economic Insights).
There has been some relief more recently: a 27.4% surge in second-quarter foreign direct investment helped strengthen the rupiah, with USD/IDR trading around 17,990 in mid-July as softer US inflation data reduced the odds of a near-term Fed hike (TMGM). Even so, the US dollar has retained broad support from escalating Middle East geopolitical tensions, keeping the rupiah’s recovery fragile rather than decisive (TMGM).
Why Growth Forecasts Keep Getting Trimmed
International lenders have grown more cautious about Indonesia’s growth trajectory for 2026. The OECD has held its outlook at 4.7% year-on-year — a clear deterioration from 2025’s realized 5.1% growth — with most major lending institutions clustering around the 5.0% threshold, implying a loss of momentum after Indonesia posted 5.61% growth in the first quarter of 2026 alone (Indonesia Investments). The deceleration is attributed to a softening labor market, weakening consumer confidence, and contracting retail sales in the second quarter (Indonesia Investments). High global oil prices are compounding the pressure on the government’s fiscal balance, since Indonesia continues to subsidize a significant portion of domestically sold fuel — a policy that transmits global energy volatility directly into the state budget rather than shielding consumers from it entirely (Indonesia Investments).
The Deeper Warning: A Confidence Problem, Not Just a Cyclical One
The most pointed recent critique comes from domestic commentary rather than foreign analysts. A Jakarta Post opinion piece published July 20, 2026 argues Indonesia must halt what it describes as erratic policymaking and institutional erosion before the country permanently damages its standing in the “vital game of investor confidence,” framing the rupiah’s weakness and shifting global market conditions as symptoms of a deeper credibility issue rather than purely external shocks (The Jakarta Post). That framing matters for how the strong headline investment numbers should be read: capital is still arriving, but the terms on which it arrives, and the confidence with which it stays, are visibly more fragile than the raw totals suggest.
Strategic Bright Spots
Not every recent development points toward strain. India secured access to Indonesian critical minerals through several major agreements signed during Prime Minister Narendra Modi’s visit to Jakarta, part of a broader push by Indonesia to leverage its resource base for deeper strategic partnerships (Samuel Sekuritas Daily Economic Insights). Indonesia is also pursuing energy independence through B50 biodiesel and compressed natural gas development, aimed explicitly at reducing reliance on imported LPG — a structural move that, if successful, would reduce exactly the kind of imported-energy vulnerability now straining the budget (Samuel Sekuritas Daily Economic Insights).
Key Takeaways
- Indonesia posted a record Rp1,010.6 trillion ($56.1 billion) in H1 2026 investment, up 7.2% year-on-year, with foreign and domestic capital nearly evenly split.
- The rupiah has weakened toward Rp18,000 per dollar on hawkish Fed signals, though a Q2 FDI surge has since provided partial relief.
- International lenders have trimmed Indonesia’s 2026 growth outlook to around 4.7–5.0%, down from 5.1% realized growth in 2025.
- The H1 2026 budget deficit reached 0.76% of GDP, pressured by continued fuel subsidies amid high global oil prices.
- Domestic commentary increasingly frames Indonesia’s challenge as a credibility and policymaking issue, not merely a cyclical external shock.
Sources: Antara News, The Jakarta Post — Investment Growth, The Jakarta Post — Confidence Game, Samuel Sekuritas Daily Economic Insights, Indonesia Investments, TMGM
Discover more from The Economy
Subscribe to get the latest posts sent to your email.
Introduction
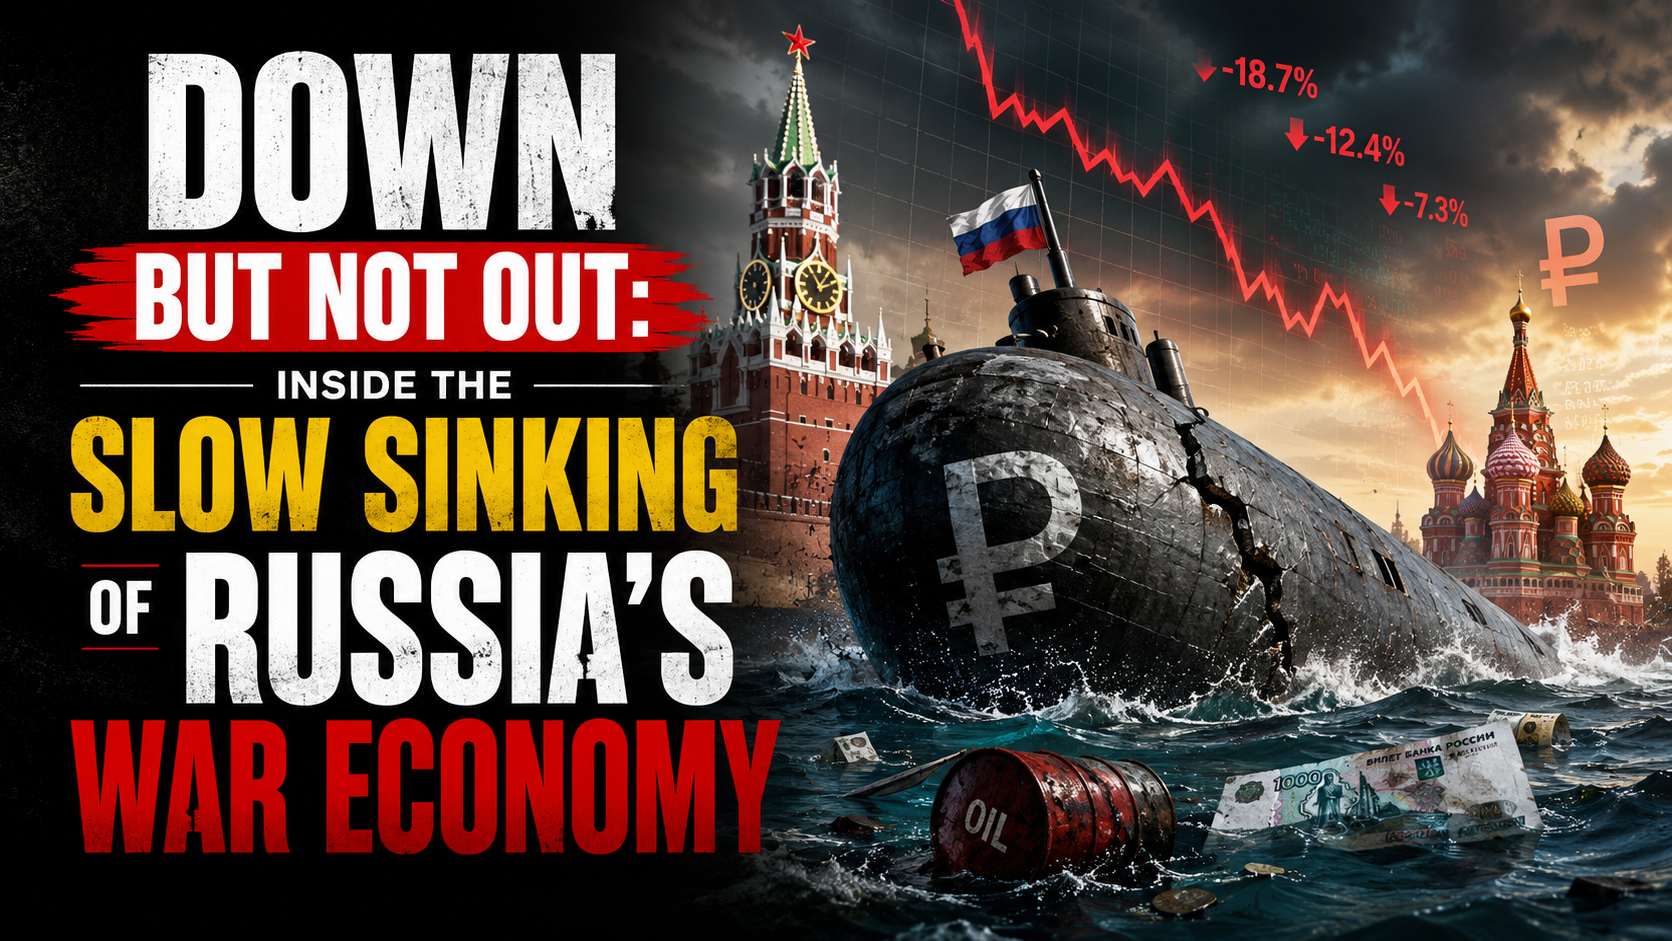
The European Council formally extended its economic sanctions against Russia for another full year on 25 June 2026, keeping restrictive measures in place until 31 July 2027 (Council of the EU). More than four years into the war, the headline story of Russia’s economy has shifted from whether sanctions would work to a more nuanced question: how much longer can the Kremlin keep financing the war before the accumulated strain becomes impossible to hide behind favorable official statistics.
The Sanctions Architecture, Renewed Again
The EU’s economic measures against Russia, first introduced in 2014 and dramatically expanded after the February 2022 full-scale invasion, now span trade, finance, energy and dual-use technology restrictions, alongside asset freezes and travel bans on a broad range of individuals and entities (Council of the EU). Since February 2022, the EU has adopted 20 separate sanctions packages, and the European Council has explicitly stated it remains determined to keep weakening Russia’s war economy by further reducing its energy revenues, curbing shadow-fleet oil shipping operations and constraining its banking system (Council of the EU). Separately, on 3 July 2026 the EU sanctioned six individuals connected to the poisoning and death of opposition figure Alexei Navalny, underscoring that the sanctions regime continues to expand on human-rights grounds as well as economic ones (Council of the EU Sanctions Timeline).
The Headline Numbers Beijing-Style Optimism Can No Longer Explain Away
Russia’s GDP is now put at roughly $2.51 trillion, the world’s eleventh-largest economy — comparable in size to South Korea despite Russia’s vastly larger landmass and resource base — with 2026 growth projected at just 1.0% and inflation running at 5.2% (Statistics of the World). More pessimistic estimates put full-year 2026 growth even lower, at around 0.4%, which would be worse than 2025’s already-weak 1% expansion and would mark a sharp deceleration from the 4.1% growth Russia posted in 2023 as it forged new trading relationships to route around initial sanctions (Forbes).
Oil and gas revenues — historically around half of Russia’s state income — have fallen to roughly a quarter, a deliberate outcome of Western sanctions strategy that targets how much Russia earns from exports rather than blocking those exports outright (Stockholm School of Economics/SITE). Russia’s oil and gas budget revenues reportedly halved in January 2026 alone, with crude prices falling below $73 a barrel before the Middle East conflict briefly reversed the trend, sending Brent surging more than 55% to near $120 a barrel at its peak (Forbes).
The Middle East War: A Temporary Lifeline With Long-Term Costs
The spike in oil prices tied to the Iran conflict, combined with a period of eased US sanctions enforcement on Russian oil under President Trump, offered Moscow unexpected fiscal breathing room in mid-2026 (Forbes). But that same conflict has undermined Russia’s longer-term energy diversification ambitions in the region: two Russian-backed power plant projects in Iran have been put on hold, along with oil and gas exploration work and plans to build new transit routes linking Russia to India via Iran (Forbes).
The Gap Between Official Statistics and Underlying Reality
Perhaps the most important analytical point from recent research is not about any single data point but about the reliability of Russian statistics themselves. Torbjörn Becker of the Stockholm Institute of Transition Economics has argued the real test of sanctions is not whether they end the war overnight, but how much they erode the Kremlin’s capacity to finance it — and by that measure, the evidence points to deeper strain than headline GDP figures suggest (Stockholm School of Economics/SITE). Becker notes that Russia’s economy grew only modestly in 2022 despite oil prices rising sharply that year — a gap between expected and actual performance that implies a considerably larger hidden economic hit than the official contraction figures showed (Stockholm School of Economics/SITE). Compounding the problem, Russian authorities have stopped publishing several key statistics since 2022, making independent assessment of inflation, consumption and real economic conditions increasingly difficult — leading Becker to conclude that “statistics have become part of the narrative” rather than a neutral measure of economic reality (Stockholm School of Economics/SITE).
The Military-Civilian Economic Split
A recurring theme across recent analysis is the growing bifurcation between Russia’s overheating military-industrial sector and a stagnating civilian economy. This imbalance has pushed interest rates higher and forced the liquidation of a striking 71% of Russia’s gold reserves to help fund continued war spending (Forbes). Russia’s total fossil fuel export revenue is estimated at roughly €734 million per day, underscoring just how central hydrocarbon income remains to the entire war financing model even as that revenue stream shrinks (Forbes).
The Counter-Narrative: Wages Still Rising
It would be inaccurate to describe Russia’s economy as in freefall. CSIS research notes that Russian salaries rose 17.8% in nominal terms and 8.7% in real terms in 2024 compared to 2023, with disposable incomes up 6.1% in 2023 and 7.3% in 2024 — growth rates not seen in Russia in almost two decades (CSIS). Government budget projections still expect real salaries to rise, albeit at a decelerating pace: 7% in 2025, 5.7% in 2026 and 4.1% in 2027 — a marked slowdown from the 2024 peak but still roughly double the pre-invasion decade average (CSIS). This wage growth, driven substantially by wartime labor shortages and military-adjacent spending, is precisely the kind of headline-stabilizing data point that has allowed Putin to argue publicly that sanctions have failed to cripple his economy (Fortune) — even as think tanks describe the broader trajectory as pushing Russia toward what one report calls an “economic, political, and military abyss” (Fortune).
What Comes Next
Renewed legislative pressure in Washington — including the Sanctioning Russia Act introduced with strong bipartisan support — signals appetite in the US for tightening the screws further, even as the loss of a key congressional champion for that effort has complicated the political path forward (TIME). Whether the EU’s renewed sanctions regime, continued oil price pressure, and constrained reserves ultimately force a shift in Kremlin calculus toward negotiation remains the central open question for 2027.
Key Takeaways
- The EU has extended Russia sanctions for a further year, through 31 July 2027, continuing a regime built from 20 separate packages since 2022.
- Russia’s 2026 GDP growth is forecast between 0.4% and 1.0%, a sharp deceleration from 2023’s 4.1% post-shock rebound.
- Oil and gas revenue’s share of Russian state income has fallen from roughly half to about a quarter as Western sanctions target export earnings specifically.
- Russia has liquidated a large share of its gold reserves to sustain war financing amid a widening split between an overheating military sector and a stagnating civilian economy.
- Official Russian statistics likely understate the true economic strain, according to independent economists who cite a widening gap between reported and expected performance.
Sources: Council of the EU, Council of the EU Sanctions Timeline, Stockholm School of Economics/SITE, Forbes, Statistics of the World, CSIS, Fortune, TIME
Discover more from The Economy
Subscribe to get the latest posts sent to your email.

Gulf Capital Retreat From Pakistan 2026: UAE Loan Freeze & What It Means

Pakistan’s Most Reliable Export Is Its People: Remittances Hit $41.6 Billion, Overtaking Total Exports

Indonesia’s Confidence Problem: Record Investment, a Sinking Rupiah, and a Widening Credibility Gap

Down But Not Out: Inside the Slow Sinking of Russia’s War Economy

China’s Growth Slips to a Four-Year Low: Why Beijing Still Won’t Pull the Stimulus Trigger

The Johor-Singapore Corridor: How Malaysia Became Southeast Asia’s AI Infrastructure Powerhouse

Canada’s Economy ‘On Pause’: Inside the CUSMA Deadline That Passed Without a Deal

Dubai’s Millionaire Magnet: How the UAE Turned Middle East Turmoil Into a Capital Safe-Haven Boom

Britain’s Sixth Prime Minister in a Decade: What Starmer’s Exit Means for Gilts, Sterling and Your Portfolio

Anthropic Offers Up to $600,000 Salary for Critical IPO Role as AI Giant Prepares for Wall Street Debut

EU Readies Crisis Team for Potential China Rare Earths Stand-Off as Supply Chain Risks Mount

Singapore Weighs Hedge Fund Tax Cuts to Counter Hong Kong’s Growing Financial Challenge

Facebook and Instagram Experience Global Outage

Inside the $1 Billion Tap-to-Pay Fraud Rings Targeting Banks and Retailers

Carry Trade Unwind 2026: How the Yen’s Snapback Triggered a Global Margin Call

AI Bubble Warning 2026: Why BIS, IMF and Bank of England Fear a Market Crash

Male Labor Force Participation Rate 2026: Why Men Are Leaving & Economic Impact

BRICS De‑Dollarization Strategy Takes Shape with $15 Billion Local‑Currency Push

Russia Bans Diesel Exports 2026: Global Fuel Market Impact Explained

The AI Super Bubble Is Ready to Burst

Strait of Hormuz Blockade 2026: Oil Prices Surge 9% as US-Iran Conflict Reignites

IMF Cuts Pakistan Growth Forecast, Raises Inflation to 8.4%

Private Credit Warning: Most BDCs Turn Unprofitable in 2026, Reuters Finds

India Economic Rise 2026: How the Subcontinent Toppled Japan
Gulf Capital Retreat From Pakistan 2026: UAE Loan Freeze & What It Means

Bitcoin $150k Milestone Achieved as US Sovereign Crypto Pivot Looms

Strait of Hormuz 2026: Why Markets Still Don’t Trust It’s Open

Chipmakers Just Lost 6.7% in Two Days: Inside the Great AI Trade Rotation
-

 Markets & Finance7 months ago
Top 15 Stocks for Investment in 2026 in PSX: Your Complete Guide to Pakistan’s Best Investment Opportunities
-

 Analysis5 months ago
Johor’s Investment Boom: The Hidden Costs Behind Malaysia’s Most Ambitious Economic Surge
-

 Analysis5 months ago
Top 10 Stocks for Investment in PSX for Quick Returns in 2026
-

 Analysis6 months ago
Brazil’s Rare Earth Race: US, EU, and China Compete for Critical Minerals as Tensions Rise
-

 Banks6 months ago
Best Investments in Pakistan 2026: Top 10 Low-Price Shares and Long-Term Picks for the PSX
-

 Investment7 months ago
Top 10 Mutual Fund Managers in Pakistan for Investment in 2026: A Comprehensive Guide for Optimal Returns
-

 Global Economy7 months ago
15 Most Lucrative Sectors for Investment in Pakistan: A 2025 Data-Driven Analysis
-

 Global Economy7 months ago
Pakistan’s Export Goldmine: 10 Game-Changing Markets Where Pakistani Businesses Are Winning Big in 2025