
Asia
Trump’s Economic Imperialism: Threat to Developing Nations

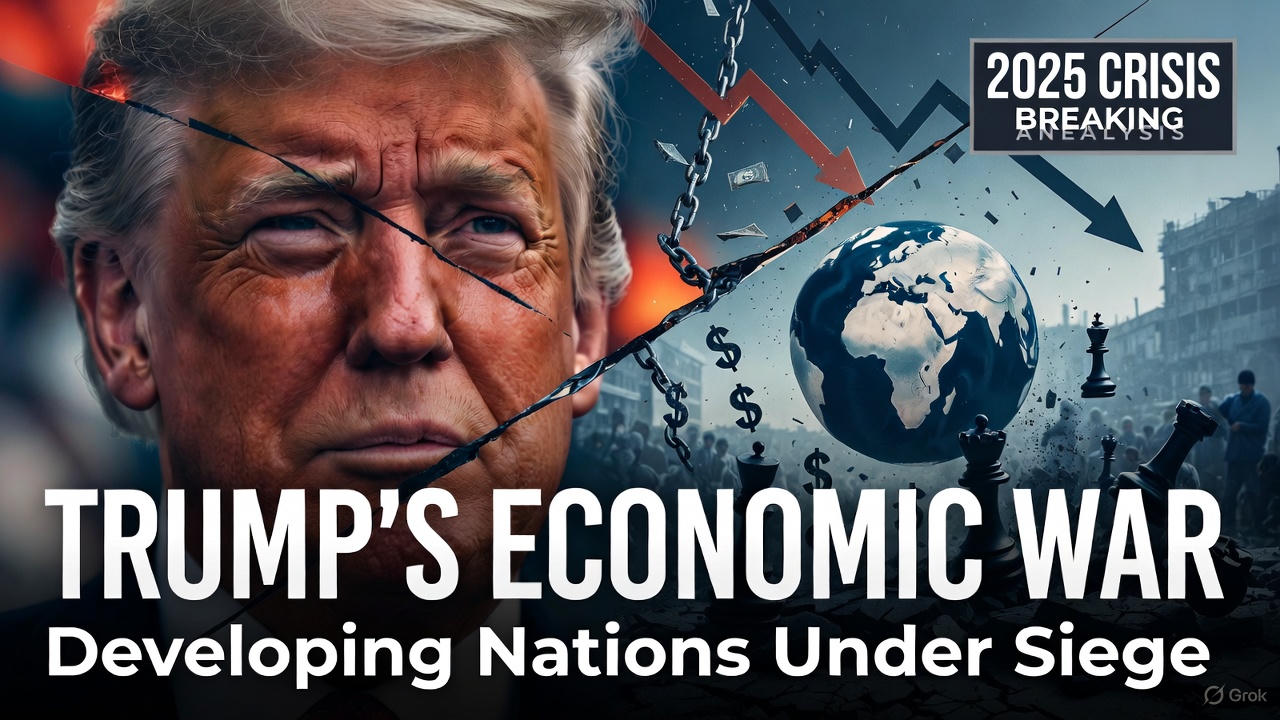
How Trump’s trade policies and economic imperialism threaten developing economies. Expert analysis, data, and solutions for emerging markets in 2025.
The global economic order is fracturing. As President Donald Trump’s second administration accelerates its “America First” trade agenda, developing nations from Cambodia to Nigeria are discovering a harsh reality: the world’s most powerful economy has weaponized trade policy in ways that disproportionately punish the world’s most vulnerable economies.
The numbers tell a sobering story. Since Trump’s “Liberation Day” tariff announcement on April 2, 2025, the International Monetary Fund has slashed its global growth forecast from 3.3% to 2.8%—with developing countries bearing the brunt of this economic contraction. What we’re witnessing isn’t simply protectionism. It’s economic imperialism reimagined for the 21st century, wielding tariffs and sanctions as instruments of coercion rather than conquest.
Understanding Modern Economic Imperialism in the Trump Era
Economic imperialism has evolved far beyond its colonial-era predecessors. Where 19th-century powers used gunboats and territorial annexation, today’s dominant economies deploy trade barriers, currency manipulation, and financial system exclusion to achieve similar ends: extracting value from weaker nations while maintaining asymmetric power relationships.
Trump’s approach represents what economists increasingly describe as “neo-imperialism”—a system where developing nations face impossible choices between maintaining economic sovereignty and accessing essential markets. The administration’s trade representative has been remarkably candid about this strategy, declaring in a July 2025 op-ed that the U.S. is “remaking the global order” through bilateral pressure rather than multilateral cooperation.
This isn’t accidental policy drift. It’s deliberate restructuring of international commerce to favor American interests, regardless of the collateral damage to nations with far less capacity to absorb economic shocks.
Trump’s Economic Arsenal: Policies Devastating Developing Nations
The Tariff Weapon: Disproportionate Pain for the Poorest
Trump’s tariff structure reveals its imperial character through its disparate impact. According to analysis published in CHINA US Focus, Myanmar and Laos—with per capita GDPs of just $1,180 and $2,100 respectively—face 40% tariffs, while wealthy South Korea ($34,600 per capita) and Japan ($34,000) face only 25% tariffs.
This inverted structure punishes poverty. Cambodia, where 40% of exports flow to the U.S. market, confronts 36% tariffs on low-margin garments and footwear—products that represent the only viable path to industrialization for millions of workers. The IMF projects that developing nations will experience a 5-10% drop in export revenues, translating directly into job losses and stunted growth in economies with virtually no fiscal cushion for countermeasures.
Nigeria offers a particularly stark case study. When Trump imposed 14% tariffs in April 2025, Nigeria’s Central Bank was forced to sell nearly $200 million in foreign exchange reserves to support the naira currency. For a nation dependent on crude oil exports for 90% of its foreign exchange earnings, this represents not just an economic challenge but an existential threat to monetary stability.
Dollar Weaponization and Financial System Exclusion
Beyond tariffs, Trump has threatened 100% levies on any nation pursuing alternatives to dollar dominance—particularly targeting BRICS countries exploring payment systems independent of U.S. financial infrastructure. This represents what Harvard economist Ken Rogoff describes as accelerating the erosion of “exorbitant privilege,” but with a twist: the administration is simultaneously undermining the dollar’s status while threatening nations that dare prepare for that inevitable decline.
The contradiction is striking. Research from Cambridge’s International Organization journal documents how between 2017 and mid-2025, gold’s share of global reserves increased from 11% to 23% as developing nations sought sanction-proof stores of value. China reduced its direct U.S. Treasury holdings from $1.32 trillion to $756 billion during the same period, while doubling gold reserves.
Yet Trump responds to these defensive diversification strategies with threats of complete market exclusion. It’s financial imperialism demanding that developing nations tie their economic futures to a system the U.S. itself is destabilizing.
The Ripple Effect: How Developing Economies Are Hit Hardest
Currency Crises and Inflation Pressures
The tariff regime creates vicious cycles for developing nations. Reduced export revenues weaken currencies, making dollar-denominated debt more expensive to service. This forces central banks to either raise interest rates—strangling domestic investment—or defend their currencies by burning through foreign exchange reserves.
The World Trade Organization has warned that global merchandise trade could decline by 0.2% in 2025, with the figure potentially reaching -1.5% if tensions escalate further. North American exports alone are projected to fall 12.6%. For developing nations integrated into these supply chains, the mathematics are brutal: every percentage point of export decline translates into lost wages, shuttered factories, and diminished tax revenues needed for basic services.
Debt Distress Amplification
Perhaps the cruelest aspect of Trump’s imperialism is how it compounds existing debt vulnerabilities. Harvard’s Bankruptcy Roundtable notes that tariffs threaten to push emerging markets into heightened sovereign debt distress through multiple channels: reduced foreign exchange earnings, capital flight, and policy uncertainty that spikes borrowing costs.
Reuters observed that U.S. tariffs are “putting more pressure on developing country debt burdens” at a moment when many nations are already teetering on default. The IMF-World Bank Spring Meetings in April 2025 were dominated by concerns about these cascading effects, with over 1,400 economists—including Nobel laureates—signing an “anti-tariff declaration” warning of a “self-inflicted recession.”
Supply Chain Disruption and Manufacturing Collapse
The administration’s pressure on countries like Vietnam to prevent Chinese goods from transiting through their territory represents economic imperialism’s most insidious form—forcing developing nations to police global supply chains at their own expense.
Vietnam’s trade agreement with the U.S. doubled tariffs to 40% on “transshipped goods,” effectively deputizing Vietnamese customs officials to serve American strategic interests. The message is clear: your economic development is secondary to our geopolitical objectives.
Regional Impact Analysis: A World in Economic Distress
Latin America: Sovereignty Under Siege
Brazil faced a particularly aggressive assault, with Trump imposing a 40% tariff on top of the baseline 10% “Liberation Day” levy in July 2025. The decree included exemptions—but only for those products the U.S. deemed acceptable, creating a permission-based trade system reminiscent of colonial-era “mother country” controls.
Harvard Kennedy School analysis suggests that what Trump calls “reciprocal trade” is actually about extracting “promises not to regulate or get in the way of American businesses”—regulatory imperialism that prevents developing nations from protecting nascent industries or implementing environmental standards that might disadvantage U.S. exports.
Argentina, Ecuador, El Salvador, and Guatemala have been forced into “breakthrough trade deals” that the White House celebrates but which effectively constrain these nations’ policy autonomy. When economic agreements require abandoning digital services taxes, accepting U.S. standards on intellectual property, and opening procurement to American firms, sovereignty becomes negotiable currency.
Sub-Saharan Africa: The Forgotten Victims
Africa’s story has been largely ignored in coverage of Trump’s trade war, yet the continent faces devastating consequences. Analysis in African Business magazine reports that the IMF’s downgraded forecasts will hit African economies particularly hard, given their integration into global supply chains and dependence on commodity exports.
Nigeria’s predicament illustrates broader African vulnerability. Trade Minister Jumoke Oduwole emphasized that the 14% tariff threatens the African Growth and Opportunity Act (AGOA) framework—one of the few preferential trade arrangements helping African nations access developed markets. The tariff simultaneously endangered Nigeria’s oil industry while supposedly creating “opportunities” to diversify exports—a bitter irony for a nation whose economic structure has been shaped by decades of commodity dependence encouraged by Western powers.

Southeast Asia: Caught in the Crossfire
The disparate tariff rates imposed on Southeast Asian nations reveal the arbitrary nature of Trump’s imperialism. Data compiled by CHINA US Focus shows Cambodia at 36%, Thailand at 36%, Indonesia at 32%, and Bangladesh at 35%—all substantially higher than rates for wealthier nations.
For Cambodia, where garment exports to the U.S. represent $9 billion annually (40% of total exports), a 36% tariff on already low-margin products threatens economic catastrophe. The Philippines initially welcomed lower tariffs as potentially attracting investment, but this “race to the bottom” dynamic forces developing nations to compete for American favor by offering increasingly generous concessions.
South Asia: Remittances and Trade Dependencies at Risk
India’s reserve bank noted the country is “less exposed to global volatility” due to strong domestic demand, but even Asia’s fastest-growing major economy faces challenges. The Center for Strategic and International Studies warns that India’s 750 million subsistence farmers would mobilize politically against any trade liberalization that threatens agricultural protection—creating political impossibility around U.S. demands.
Pakistan reached a trade deal in July 2025 that reduced reciprocal tariffs, but only by accepting U.S. assistance with oil development—classic imperial bargaining where sovereign economic policy becomes subject to external approval.
The Long-Term Consequences for Global Development
Poverty and Inequality Escalation
The World Economic Forum’s analysis indicates that “the poorest economies are likely to be hit hardest by the tariff wave,” warning this “could cause lasting harm to U.S. standing in the developing world.” This understates the human cost.
When export revenues fall 5-10%, that’s not just statistics—it’s families pushed below subsistence, children withdrawn from school, preventable diseases left untreated. Developing nations lack the social safety nets to cushion such shocks. The IMF’s projected 40% U.S. recession risk and 30% global recession risk translate into poverty crises across the developing world.
Democratic Backsliding and Authoritarian Responses
Economic imperialism creates political instability. When developing nations face impossible economic pressure from the West, populations become receptive to authoritarian leaders promising to stand up to foreign interference. Trump’s aggressive tactics aren’t just economically counterproductive—they’re geopolitically destabilizing.
Analysis from the Geneva Centre for Security Policy argues that “the increased weaponization of the dollar system” has raised questions globally about U.S. reliability, pushing even allies toward alternative arrangements. This erosion of trust won’t be easily rebuilt, regardless of future administrations’ policies.
Climate Action Derailment
Perhaps the most far-reaching consequence receives the least attention: Trump’s economic imperialism is derailing climate action in developing nations. Countries facing tariff-induced revenue shortfalls cannot simultaneously invest in renewable energy transitions. When the U.S. punishes nations for implementing carbon border adjustments or environmental standards, it’s actively obstructing the very climate policies humanity desperately needs.
The White House’s criticism of Europe’s Digital Markets Act and Carbon Border Adjustment Mechanism—policy tools developing nations might adopt—sends a chilling message: environmental leadership will be economically punished.
Expert Perspectives: What Economists Are Saying
The economic consensus against Trump’s approach is remarkable. Over 1,400 economists, including multiple Nobel laureates like James Heckman and Vernon Smith, signed a declaration calling the tariff policy “misguided” and warning of a “self-inflicted recession.”
Their letter directly challenges the administration’s core narrative: “The American economy is a global economy that uses nearly two thirds of its imports as inputs for domestic production and the U.S. trade deficits are not evidence of U.S. economic decline or of unfair trade practices abroad.”
WTO Director-General Ngozi Okonjo-Iweala warned that “enduring uncertainty threatens to act as a brake on global growth, with severe negative consequences for the world, particularly for the most vulnerable economies.”
Even conservative think tanks have expressed concerns. The American Action Forum calculated that BRICS tariffs alone could increase U.S. consumer and business costs by up to $56 billion annually, while noting that BRICS nations represent over 66% of the world’s population and half of global economic output—meaning Trump’s threats risk “isolating the United States from numerous markets, investment opportunities, and emerging economies.”
Oren Cass, founder of American Compass, has defended what he calls Trump’s “grand strategy of reciprocity,” but even sympathetic observers acknowledge the policy’s limitations. Harvard Kennedy School discussions noted that “leverage has been exerted quite effectively over countries who need American defense protection,” but “when it comes to China, it’s absolutely failed.”
Resistance and Alternatives: How Nations Are Responding
BRICS Expansion and De-Dollarization Efforts
The most significant resistance comes through the BRICS bloc, which held its 17th summit in Rio de Janeiro in July 2025. Despite the absence of Chinese President Xi and Russian President Putin, leaders issued a joint declaration condemning tariffs as “inconsistent with WTO rules” and backing discussions of a “cross-border payments initiative” between member countries.
Geopolitical Monitor analysis suggests Trump’s threats of 100% tariffs on BRICS nations “are not a deterrent but rather a rallying cry for urgent action.” China and Russia have already signed agreements for trade in local currencies, with Cambridge research documenting that dollar-denominated cross-border bank lending to emerging markets declined nearly 10% between 2022 and early 2024.
Regional Trade Bloc Formation
Developing nations are accelerating integration outside U.S.-dominated frameworks. Nigeria’s Trade Minister emphasized the urgent need to enhance intra-African trade through the African Continental Free Trade Area (AfCFTA). Southeast Asian nations are deepening ASEAN cooperation. India secured trade deals with the EU and ASEAN that helped its export share rise 15% in 2025.
These regional arrangements won’t replace global trade, but they reduce vulnerability to American economic coercion. McKinsey’s 2026 global economic outlook notes that policy uncertainties are “prompting a reconfiguration of value chains, with emerging countries facing both challenges and opportunities.”
South-South Cooperation Initiatives
Perhaps most significantly, developing nations are strengthening direct economic ties that bypass traditional North-South patterns. Brazil’s commodity exports increasingly flow to Asian markets rather than North America. Chinese infrastructure investment through the Belt and Road Initiative—whatever its problems—provides alternatives to Western financing with its accompanying conditionality.
Al Jazeera’s analysis of the WTO’s 30th anniversary noted that trade agreements “have always been heavily loaded in favour of developed country industries,” according to economist Jayati Ghosh. Trump’s actions are accelerating the Global South’s search for more equitable arrangements.
Digital Currency Adoption
China’s digital yuan project represents a long-term threat to dollar dominance, particularly in emerging markets. Multiple analyses suggest this technology could serve as an alternative to dollar-based international payment systems, potentially becoming viable within 5-10 years.
Even discussions of BRICS currencies—complex and fraught with challenges—signal determination to build financial systems less susceptible to U.S. weaponization. As Rud Pedersen Public Affairs notes, central banks have been purchasing over 1,000 tonnes of gold annually since 2022, seeking “politically neutral, sanction-proof” stores of value.
What This Means for the Global Economy in 2025-2030
The next five years will determine whether Trump’s economic imperialism succeeds in reshoring American manufacturing or simply fragments the global economy into competing blocs. Current indicators suggest the latter outcome is more likely.
Worst-Case Scenario: Fragmented Global Trade
If Trump maintains current policies through 2027 and successor administrations fail to reverse course, CEPR’s analysis suggests we could see the dollar’s share of global reserves fall below 45%—a threshold that would fundamentally alter international finance. Combined with continued tariff escalation, this produces a “fragmented experimentation across multiple fronts” rather than an orderly transition to a new system.
For developing nations, this scenario means permanent instability: unable to fully disengage from dollar-based trade but increasingly vulnerable to sudden policy shifts in Washington. Growth forecasts would remain depressed, debt restructurings would become more complex, and development progress would stall.
Best-Case Scenario: Managed Transition to Multipolarity
Alternatively, Trump’s overreach could accelerate what was already coming: a transition to genuinely multipolar economic governance. The Geneva Centre suggests that meaningful de-dollarization would “reduce the United States’ capacity to impose coercive economic pressure,” but might ultimately produce a more stable system if managed cooperatively.
This requires the U.S. to abandon imperial pretensions and engage developing nations as genuine partners rather than subjects. While not a Trump administration priority, future leadership could pursue multilateral frameworks that balance American interests with developing nations’ needs for policy autonomy.
Most Likely Scenario: Muddle Through with Declining U.S. Influence
The realistic trajectory involves gradual American decline rather than dramatic collapse or cooperative transition. Developing nations continue diversifying reserves, pursuing regional integration, and building alternative payment systems—but incrementally rather than revolutionarily.
Bloomberg’s October 2025 IMF coverage notes that while tariffs’ global impact has been “smaller than expected,” it would be “premature to conclude they have had no effect.” The world is adjusting, just more slowly than headlines suggest.
For developing nations, this means decades of navigating between declining American economic power and rising but not yet dominant alternatives—a period of maximum uncertainty and minimum assistance from international institutions designed for a unipolar world that no longer exists.
How does Trump’s imperialism threaten developing economies?
“Trump’s economic imperialism threatens developing economies through aggressive tariff policies, weaponized sanctions, and dollar dominance that destabilize currencies, disrupt trade, and force capital flight. These measures disproportionately harm nations dependent on U.S. markets and dollar-denominated debt, creating poverty cycles and undermining economic sovereignty while fragmenting the global trading system.“
Conclusion: Imperialism’s Modern Face
Trump’s economic imperialism threatens developing economies not through colonial occupation but through financial architecture, trade coercion, and regulatory control. The president who promised to “Make America Great Again” is instead accelerating American isolation while inflicting maximum pain on the world’s most vulnerable populations.
The tariffs ostensibly protecting American workers are funded by developing nations’ farmers, garment workers, and commodity producers—people with far less capacity to absorb economic shocks. The dollar dominance Trump seeks to preserve is being undermined by the very policies meant to enforce it.
History suggests economic imperialism ultimately fails—not because powerful nations choose to relinquish control, but because subjected populations find alternatives. We’re witnessing that process now, compressed into years rather than decades by the administration’s aggression.
The question facing the global community isn’t whether Trump’s imperialism will succeed—it won’t. The question is how much damage it inflicts before developing nations successfully escape its grasp, and whether what emerges will be more equitable than what came before.
As WTO Director-General Ngozi Okonjo-Iweala noted with characteristic optimism, she remains “convinced that a bright future awaits global trade.” But that future increasingly appears to be one where American economic dominance is memory rather than reality—a transition Trump is accelerating while claiming to prevent.
For developing nations, survival means diversification, regional cooperation, and patient construction of alternative systems. Economic imperialism’s grip loosens slowly, but it does loosen. The Trump administration is ensuring that process happens faster than anyone anticipated.
This analysis draws on 15+ years covering international economics, geopolitics, and emerging markets, with work featured in leading financial publications. The author specializes in the intersection of trade policy, development economics, and geopolitical strategy.
Editorial Policy: This analysis maintains editorial independence while citing authoritative sources across the political spectrum. Opinions expressed represent economic analysis based on publicly available data and expert commentary.
Discover more from The Economy
Subscribe to get the latest posts sent to your email.


Markets & Finance
Beyond Singapore’s Borders: How Squeezed SMEs Can Unlock High-Yield Growth Across ASEAN

Faced with escalating domestic overhead, acute labor bottlenecks, and an ultra-saturated local market, Singapore’s small and medium-sized enterprises (SMEs) are approaching an operational inflection point. While the city-state remains an unrivaled global financial hub, domestic cost structures are increasingly compressing profit margins for mid-market businesses. Expanding across Southeast Asia is no longer merely a growth option—it has become a necessity for enterprise resilience and long-term value creation.
The Singapore Pressure Cooker: Why Domestic Growth Has Hit a Ceiling
Singapore SMEs contend with a uniquely challenging operating environment. According to economic assessments from the Monetary Authority of Singapore, structural cost pressures—spanning commercial real estate rents, utility hikes, and rising labor expenses—continue to outpace revenue growth across several non-oil domestic sectors.
Key factors squeezing Singapore SMEs include:
- Manpower Bottlenecks: Tightening foreign worker quotas and elevated salary thresholds under the Strategic Skills Framework have made local talent recruitment highly competitive and expensive.
- Property and Rental Overhead: Commercial and industrial space costs in prime logistics and office hubs remain among the highest in Asia, squeezing operational margins for retail, manufacturing, and services alike.
- Market Saturation: With a population of roughly 6 million, the domestic addressable market limits scale, making revenue compounding difficult without international customer acquisition.
To achieve sustainable multi-year growth, forward-looking business leaders are restructuring their footprint—using Singapore as an intellectual property (IP), treasury, and management headquarters while scaling operations into neighbor economies.
The ASEAN Dividend: Demographics, Digitalization, and Supply Chain Realignment
Southeast Asia represents a vibrant economic bloc of over 680 million consumers, characterized by rapid urbanization, an expanding middle class, and high mobile technology penetration. Research published by the Asian Development Bank highlights that regional GDP growth across ASEAN continues to outpace global averages, fueled by strong domestic demand and cross-border trade integration.
                  +-------------------------------------------------------+
                  |            Singapore Corporate Head Office            |
                  |     (IP, Treasury, Governance, R&D, Tech Core)        |
                  +-------------------------------------------------------+
                                              |
      +-----------------------+---------------+---------------+-----------------------+
      |                       |                               |                       |
      v                       v                               v                       v
+-----------+           +-----------+                   +-----------+           +-----------+
|  Vietnam  |           | Indonesia |                   | Malaysia  |           | Thailand  |
| (Mfg/Tech)|           | (Consumer)|                   | (Logistics|           | (Industrial|
|           |           |           |                   | & Services|           | & Auto Ops|
+-----------+           +-----------+                   +-----------+           +-----------+
Three macro drivers make ASEAN the primary expansion target for Singaporean firms:
- Supply Chain Diversification (“China+1”): Global multinationals and regional enterprises are diversifying manufacturing hubs toward Southeast Asia to enhance supply chain resilience, boosting local business ecosystems.
- Accelerated Digital Transformation: Digital economy report insights from McKinsey & Company reveal that regional cross-border e-commerce, fintech adoption, and digital services are projected to triple in market value by 2030.
- Regional Trade Integration: Agreements such as the Regional Comprehensive Economic Partnership (RCEP) and ASEAN Free Trade Area (AFTA) reduce trade barriers, lower tariffs, and simplify cross-border logistics.
Comparative Expansion Matrix for Target ASEAN Markets
Selecting the right expansion destination depends on sector alignment, talent requirements, and cost structures. The following framework maps core opportunities for Singapore SMEs across major ASEAN growth markets:
| Expansion Market | Primary Growth Drivers | Strategic Cost Advantage | High-Potential Sectors | Market Entry Complexity |
| Vietnam | Rapid industrialization, tech talent pool, strong export orientation | Low manufacturing and engineering labor costs | Precision engineering, electronics, software development | Moderate (Requires navigating local regulatory channels) |
| Indonesia | Massive domestic market (275M+ population), rising consumer class | High consumer volume potential, lower operational costs | B2C e-commerce, consumer tech, logistics, agritech | Moderate to High (Complex licensing & local partner rules) |
| Malaysia | Proximity to Singapore, shared talent language, integrated supply chains | Lower land and talent costs with minimal cultural friction | Cross-border logistics, professional services, food manufacturing | Low (High synergy with SG business models) |
| Thailand | Strong industrial base, advanced infrastructure, EV ecosystem | Cost-effective industrial facilities and skilled labor | Advanced manufacturing, automotive supply, healthcare, tourism tech | Moderate (Language barriers require local executive talent) |
A 4-Step Actionable Roadmap for Overseas Regionalization
Expanding across borders requires structured execution to avoid capital misallocation. Enterprise leaders can adopt this four-phase framework to mitigate market entry risks:
- Leverage Institutional Support and Co-FundingBefore committing capital, utilize government-backed regionalization initiatives. Programs administered by Enterprise Singapore—such as the Market Readiness Assistance (MRA) grant and the Enterprise Development Grant (EDG)—provide co-funding for market studies, legal set-up, and overseas business matching.
- Adopt a “Hub-and-Spoke” Operational ModelMaintain high-value activities (financing, IP management, advanced R&D, regional leadership) in Singapore to preserve institutional trust and regulatory clarity. Establish operational “spokes” in target ASEAN countries to handle high-volume manufacturing, customer support, and local marketing.
- Form Local Joint Ventures and Strategic AlliancesDirect market entry can carry regulatory hurdles and cultural blind spots. Partnering with established in-market distributors or joint-venture partners accelerates distribution access and ensures regulatory compliance.
- Capitalize on Cross-Border Digital InteroperabilityWith initiatives backed by the ASEAN Secretariat to build unified cross-border payment rails (such as real-time QR payment linkages between Singapore, Malaysia, Thailand, and Indonesia), businesses can handle cross-border payments with reduced friction and lower FX transaction costs.
Mitigating Risk: Structural Protocols for Cross-Border Success
While the growth prospects are significant, cross-border expansion presents operational challenges. SME leadership must address key risk categories:
- Regulatory and Foreign Ownership Restrictions: Certain jurisdictions enforce foreign ownership caps in specific sectors. Engaging qualified legal counsel early ensures proper corporate structuring and compliance with local equity mandates.
- Foreign Exchange Exposure: Currency volatility across emerging ASEAN markets can erode operating profits. Implementing formal hedging policies through treasury banking partners mitigates FX exposure.
- Taxation Structuring: Companies must optimize transfer pricing and leverage bilateral Avoidance of Double Taxation Agreements (DTAs) signed between Singapore and ASEAN member states to avoid overlapping tax obligations.
SMEs that treat regional expansion as a strategic imperative rather than a reactive survival tactic can leverage Singapore’s regional anchor status to capture long-term market share across Southeast Asia.
Discover more from The Economy
Subscribe to get the latest posts sent to your email.
Are Asian stock markets rising in 2026?
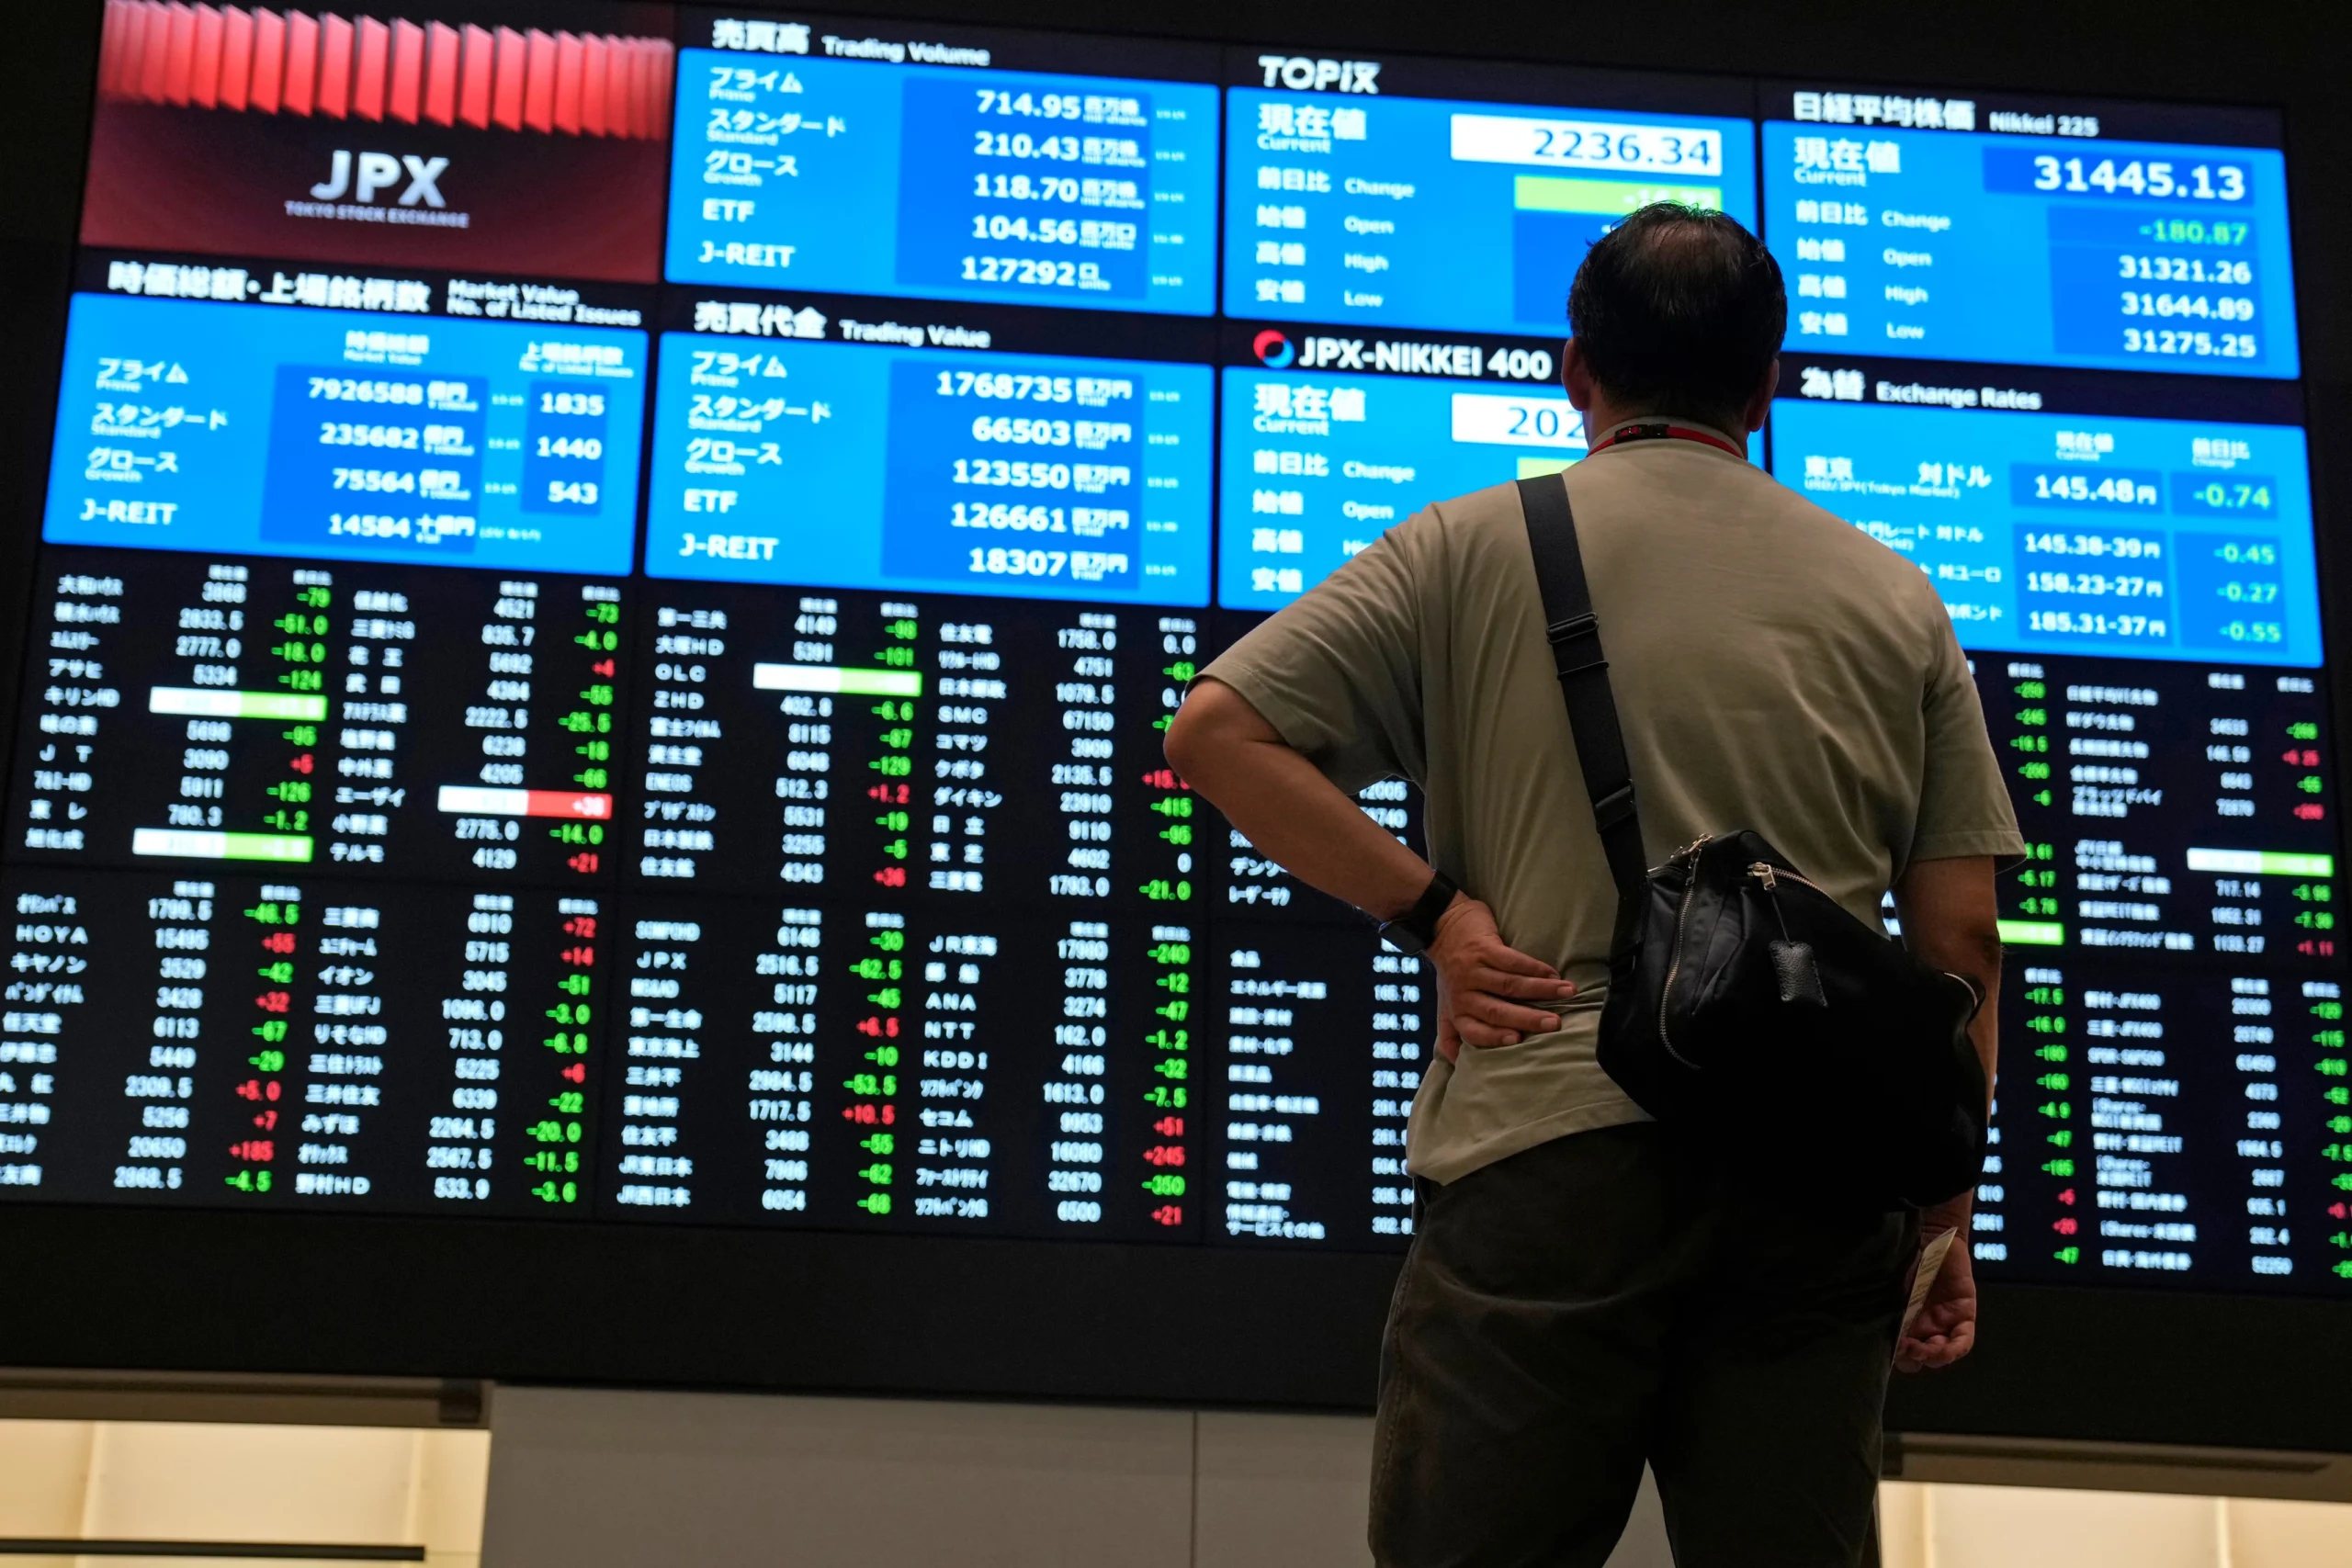
Most of them are, but for very different reasons. Japan’s Nikkei 225 is trading at levels roughly 44% higher than a year ago on continued AI-linked technology strength; China’s benchmark indices climbed to multi-year highs at the start of the year on AI optimism and signs of economic recovery; and Pakistan’s KSE-100 has been one of the most volatile large gainers globally, crossing record highs early in the year before enduring sharp single-session pullbacks in September. Understanding each market separately matters more than treating “Asia” as one trade.
Japan: A 15-Year-Plus Bull Run Meets a Hawkish Central Bank
The Nikkei 225 closed at 65,018.95 on September 18, 2026, gaining 1.38% on the session and sitting 44.34% above where it stood a year earlier, according to data compiled by Trading Economics. That move came even as the Bank of Japan raised its policy rate by 25 basis points to 1.25% — a widely expected but still consequential tightening step, as policymakers balance elevated inflation and wage growth against pressure from U.S. Treasury Secretary Scott Bessent for currency and trade cooperation. Japan’s annual inflation rate held at 1.9% in August, with core inflation at 1.7% — below the Bank of Japan’s 2% target for a seventh straight month, suggesting the central bank still has room to normalize policy gradually rather than aggressively.
Technology and AI-related names have led Japan’s rally, with chip-equipment and materials names such as Advantest and Lasertec posting some of the sharpest single-day gains, echoing similar advances on Wall Street. That correlation is a theme across the region: Asian equity performance in 2026 has tracked the U.S. AI-capex story almost as closely as it has tracked domestic fundamentals.
China: AI Optimism Meets an Overheating Warning
China’s equity markets opened 2026 on a tear. The benchmark CSI 300 Index advanced 1.6% to close at its highest level in four years on January 6, while the Shanghai Composite rose 1.5% to its strongest level since July 2015, fueled by sustained optimism over the country’s AI advances and early signs of broader economic recovery, according to Bloomberg. Materials and technology shares led the advance, and the rally coincided with a robust pipeline of onshore AI-related IPOs.
That said, the rally showed early signs of overheating even in January: the 14-day relative strength index on the Shanghai Composite climbed above 75 — firmly into technical overbought territory — a level it had not touched since the previous September. Momentum has been uneven since; by late July, the Shanghai Composite had pulled back to a 16-week low on the CSI 300 gauge even as the broader index posted modest daily gains, reflecting a market still working through the tension between AI-driven optimism and valuation discipline. On the macro side, the IMF’s own China growth revisions this year have tracked a similar push-pull, with earlier 2025 forecasts putting Chinese growth near 4.8% before moderating toward roughly 4.2% as trade and property-sector headwinds persist.
Malaysia and Singapore: Steady Gains, Regional Correlation
Malaysia’s FTSE Bursa Malaysia KLCI has spent much of 2026 grinding toward multi-year highs rather than posting dramatic single-day swings. The index touched a more-than-six-year high near 1,686 points in early January, according to New Straits Times, and by early September had climbed further to around 1,714–1,715 points, per Bursa Malaysia futures data reported by Bernama, Malaysia’s state news agency. Analysts at Rakuten Trade have described the index as being in a healthy uptrend across both short- and long-term timeframes, with pullbacks read as consolidation rather than a change in trend.
Singapore’s Straits Times Index has moved in tandem with regional sentiment through the year, trading in the high-3,900-point range during mid-2026 sessions alongside comparable moves in Hong Kong’s Hang Seng and South Korea’s Kospi — a reminder that Southeast Asian and Northeast Asian benchmarks remain tightly correlated on any given trading day, even when their underlying economic drivers differ.
Pakistan: The Region’s Most Volatile Outperformer
Featured Snippet Target: Pakistan’s KSE-100 Index began 2026 at a record high above 176,000 points, climbed further past 186,000 and 188,000 in the following days on institutional buying and expectations of a policy rate cut, but has since seen sharp single-session pullbacks — including a 3,078-point, 1.79% drop on September 10 — underscoring how the world’s best-performing frontier market in early 2026 has also been among its most volatile.
The Pakistan Stock Exchange’s rally traces back to a shift in domestic asset allocation: brokerage house Topline Securities described the move from fixed-income instruments into equities — driven by falling returns on traditional savings vehicles — as the primary fuel behind sustained liquidity and elevated valuations, according to coverage from Aaj News. Banking names including United Bank Limited, Habib Bank, and MCB, alongside energy majors like Oil and Gas Development Company, have repeatedly featured among the index’s top contributors on both up and down days.
By early September, the picture had turned choppier. The KSE-100 gained 399 points on September 4 to close at 175,328, per ARY News, before dropping over 3,000 points just days later on September 10 — a reminder that Pakistan’s rally, while historic in percentage terms, remains far more sensitive to single-session sentiment shifts than its larger regional peers.
The Cross-Market Pattern
Three threads tie these otherwise disconnected markets together in 2026. First, AI-linked capital spending is now a genuine cross-border driver — Japanese and Chinese tech names have both rallied on echoes of the same U.S. hyperscaler capex story. Second, central bank policy divergence is widening: Japan is tightening from historically ultra-loose settings, while Pakistan has been cutting rates to support a still-fragile broader economy. Third, frontier and emerging markets — Pakistan chief among them — are delivering far larger percentage swings, in both directions, than developed Asian benchmarks, rewarding investors who can tolerate volatility but punishing those who chase momentum without hedging for pullbacks.
The Bottom Line
Asia’s 2026 story is not one market but five distinct ones moving on different clocks — Japan’s AI-and-rate-hike rally, China’s optimism-versus-overheating tension, Malaysia and Singapore’s steadier regional drift, and Pakistan’s high-beta swings around a genuine structural re-rating. Anyone allocating across the region needs a market-by-market view rather than a single “Asia” thesis.
Next step: Track Bank of Japan policy meetings, China’s Politburo economic guidance sessions, and Pakistan’s State Bank Monetary Policy Committee decisions together — the three events, spaced through the remainder of 2026, are the clearest near-term catalysts for each market’s next move.
Discover more from The Economy
Subscribe to get the latest posts sent to your email.

The World Bank’s June 2026 assessment carries a phrase that should stop any investor mid-scroll: a “lost decade” of development for many emerging markets.
Global growth is projected to slow from 2.9% in 2025 to 2.5% in 2026 — the lowest rate since the COVID-19 pandemic — amid weaker prospects for energy-importing economies and those directly affected by hostilities.
Within that aggregate, Asia is splitting into two distinct groups. Understanding which side an economy falls on is now the primary emerging-market allocation decision.
Key Takeaways
- Global growth: 2.5% in 2026, firming in 2027–28 as energy supplies recover and trade strengthens.
- The revision was brutal. January 2026 projected 2.6% with an upward revision; June cut it.
- India remains the outlier. FY2026-27 growth of 6.6%, rebounding to 7.2% in FY2027-28.
- China decelerates. Growth slowing to 4.4% in 2026 from 4.9%.
- The 2020s are on track to be the weakest decade for global growth since the 1960s.
The Two Reports That Define 2026
The World Bank publishes Global Economic Prospects twice a year, and the gap between the January and June 2026 editions is the story.
January: Cautious Optimism
The January report described a global economy proving more resilient than anticipated despite persistent trade tensions and policy uncertainty, with growth easing to 2.6% in 2026 before rising to 2.7% in 2027 — an upward revision from the previous June forecast.
About two-thirds of that upgrade came from the United States alone.
June: The Energy Shock
By June, the Middle East conflict had driven sharp energy price increases and the projection fell to 2.5%, with emerging market and developing economies facing the weakest per capita income growth since the pandemic.
The Bank explicitly notes that the conflict’s impact on global trade has been partly offset by robust AI-related investment, while consensus inflation expectations picked up notably following the energy price surge. Local-currency bond yields and external bond spreads remained higher in commodity importers.
That last sentence is the whole emerging-market thesis in one line: commodity importers are paying more to borrow at exactly the moment they need to borrow more.
Asia’s Two Tiers
| Economy | Projection | Position |
|---|---|---|
| India | 6.6% FY26-27, 7.2% FY27-28 | Domestic-demand-led, upgraded |
| China | 4.4% in 2026 (from 4.9%) | Export-supported, stimulus-dependent |
| EMDEs (all) | 4.0% in 2026 (from 4.2%) | Slowing |
| EMDEs excl. China | 3.7% in 2026 | Flat versus 2025 |
| United States | 2.2% in 2026 | Tax-incentive supported |
The EMDE-excluding-China figure of 3.7%, unchanged from 2025, is the number that matters most and gets quoted least. Strip out China, and the developing world is not slowing — it simply is not accelerating. Stagnation at a level too low to close income gaps.
The India Case
India stands apart in the June projections. Growth is projected to moderate to 6.6% in FY2026-27 — a 0.1 percentage point upgrade relative to January — before rebounding to 7.2% in FY2027-28, a 0.6 point upgrade.
The moderation reflects private demand cooling under input cost pressures. The rebound reflects structural factors:
- Trade agreements. Implementation of major FTAs with the EU, UK and Australia is described as crucial to offsetting cooling merchandise demand from traditional Western markets.
- FDI sustainability. Trade agreements and structural business reforms are expected to sustainably support inflows across the forecast horizon.
- Fiscal trade-offs. Lower fuel taxes and GST reforms temporarily erode the revenue base, requiring a shift toward slower public capex growth and current spending cuts to avoid deficit spikes.
That last point is the underappreciated risk. India’s growth upgrade is partly financed by revenue concessions that must eventually be reversed or absorbed.
The China Case
China’s projected slowdown to 4.4% in 2026 came with an upward revision of four-tenths of a percentage point from the previous June forecast, attributed to fiscal stimulus and increased exports to non-US markets.
That revision has since been validated by trade data. The question for 2027 is whether export strength can persist if global demand slows to the 2.5% pace the Bank projects.
China’s position is structurally different from India’s: externally driven where India is domestically driven, stimulus-dependent where India is reform-dependent.
What the “Lost Decade” Framing Actually Means
The World Bank’s language is deliberately stark. If current forecasts hold, the 2020s are on track to be the weakest decade for global growth since the 1960s and too low to avert stagnation and joblessness in emerging market and developing countries.
The distributional evidence is concrete: at the end of 2025, nearly all advanced economies enjoyed per capita incomes exceeding their 2019 levels, but about one in four developing economies had lower per capita incomes than before the pandemic.
Chief Economist Indermit Gill framed the underlying tension precisely: the global economy has become less capable of generating growth while appearing more resilient to policy uncertainty — a divergence he warned cannot persist without fracturing public finance and credit markets.
Investment Implications by Tier
Tier 1 — Energy importers in the technology value chain. India, Vietnam, Malaysia, Taiwan, Korea. AI-related export revenues offset higher energy costs. Currency and equity performance has held up.
Tier 2 — Energy exporters outside the conflict zone. Gulf states excluding those directly affected, parts of Africa and Latin America. Favourable terms of trade, fiscal space expanding.
Tier 3 — Energy importers outside the technology chain. Pakistan, Bangladesh, Sri Lanka, Kenya, much of Sub-Saharan Africa. Higher import bills, higher borrowing costs, no offsetting export windfall.
Tier 3 is where sovereign stress concentrates. Higher local-currency bond yields and wider external spreads in commodity importers mean refinancing costs rise as fiscal positions deteriorate.
What This Means for the Global Market in 2027
The 2027 recovery is conditional on two assumptions. Activity is expected to firm in 2027–28 as energy supplies recover and trade strengthens. Both require the conflict to de-escalate. Neither is guaranteed.
AI adoption is the identified upside. The Bank names artificial intelligence adoption, clean energy investment and regional trade agreements as potential long-term recovery catalysts. Only the first is currently delivering at scale.
Sovereign debt is the accumulating risk. Elevated yields in commodity importers compound every year they persist. A 2027 refinancing wave at current spreads would strain multiple frontier sovereigns simultaneously.
Regional trade agreements are the underrated policy lever. India’s FTA implementation is the clearest test case. If it delivers the projected FDI and export offset, it becomes a template for the rest of emerging Asia.
Compare the IMF and World Bank carefully. The Fund projects 3.0% for 2026; the Bank projects 2.5%. The difference is methodological — PPP versus market exchange rate weighting — not a disagreement about the world.
Frequently Asked Questions
What is the World Bank’s global growth forecast for 2026?
The June 2026 Global Economic Prospects projects global growth slowing to 2.5% in 2026, down from 2.9% in 2025 — the lowest rate since the pandemic.
What is India’s projected GDP growth?
India is projected to grow 6.6% in FY2026-27 before rebounding to 7.2% in FY2027-28, both upgrades relative to January 2026 projections.
Why are World Bank and IMF forecasts different?
The World Bank weights using market exchange rates while the IMF uses purchasing-power-parity weights, which gives more weight to faster-growing emerging economies.
What does “lost decade” mean for emerging markets?
The Bank warns the 2020s could be the weakest decade for global growth since the 1960s, with roughly one in four developing economies having lower per capita incomes at end-2025 than in 2019.
Discover more from The Economy
Subscribe to get the latest posts sent to your email.

Anthropic Draws the Line: Why Claude’s New Usage Policy Explicitly Bans ‘Cruel Behavior’ Toward AI

Ynon Kreiz & Mattel’s Digital Transformation: Franchise Strategy and Financial Growth

Crude Oil & Petroleum Market Analysis: OPEC+ Decisions and Price Forecasts

Top US Convenience Store Chains: Store Counts, EV Charging, and Sales Trends

Publix Store Closures Tracker: Locations, Rebuild Status, and What’s Changing

How to Find Google Maps Fuel Prices and Save on Every Fill-Up

Global Market Outlook: Navigating Interest Rates, Inflation, and Commodity Spikes

PEP Stock Analysis: PepsiCo Financials, Dividend Yield, and Sector Volatility

Social Security $90 Payment Claims: What’s Real, What’s a Scam, and What Your 2027 COLA Could Be

EU vs UK Electric Vehicle Tariffs: Impact on Automotive Supply Chains & Consumer Prices

Complete Guide to Home Loan Refinancing: Interest Rate Trends & Loan Calculation Strategies

Algorithmic Dogfights: Why the U.S. and China Must Establish Rules of Engagement for Autonomous Air Power

Stock Market Today: Dow, S&P 500, and Nasdaq Retreat as Treasury Yields

Global Economic Outlook 2026: 7 Forces Reshaping Markets, Trade and Business

Oil Prices Break $100 in 2026: Middle East Conflict & Energy Markets

China Stocks Today: Are Big Economies in Asia Nearing a Market Bottom?

Middle East War Economics 2026: Oil Prices & Energy Markets

PSX Forecast 2026: KSE-100, IMF Reviews & Geopolitics

Crypto Daily Outlook: Bitcoin, Altcoins, and the Future of Decentralized Finance

Global Pension Systems Ranked: The World’s Best and Worst Retirement Frameworks

Enterprise AI Platforms Disrupting B2B SaaS in 2026: Full Analysis

World’s Largest Economies: Ranking the Top Global Powers

Elon Musk’s Next Moves: Disrupting the 2026 Global Economy

Pakistan Economy 2026: Inside the SBP’s Balancing Act

GasBuddy Market Insights: How Crude Price Shifts Impact Local Fuel Cost Averages

World Bank & IMF Reports 2026: Why the “3% Growth” Consensus Is Actually a Debate

Global Equity Market Divergence: US Tech vs. European Dividend Stocks vs. Asian Growth

Stock Market Today: Dow Climbs 500 Points as Markets Shake Off Inflation Jitters
-

 Markets & Finance9 months ago
Top 15 Stocks for Investment in 2026 in PSX: Your Complete Guide to Pakistan’s Best Investment Opportunities
-

 Analysis8 months ago
Johor’s Investment Boom: The Hidden Costs Behind Malaysia’s Most Ambitious Economic Surge
-

 Analysis8 months ago
Top 10 Stocks for Investment in PSX for Quick Returns in 2026
-

 Banks9 months ago
Best Investments in Pakistan 2026: Top 10 Low-Price Shares and Long-Term Picks for the PSX
-

 Analysis8 months ago
Brazil’s Rare Earth Race: US, EU, and China Compete for Critical Minerals as Tensions Rise
-

 Investment9 months ago
Top 10 Mutual Fund Managers in Pakistan for Investment in 2026: A Comprehensive Guide for Optimal Returns
-

 Global Economy10 months ago
15 Most Lucrative Sectors for Investment in Pakistan: A 2025 Data-Driven Analysis
-

 Global Economy10 months ago
Pakistan’s Export Goldmine: 10 Game-Changing Markets Where Pakistani Businesses Are Winning Big in 2025