
Human Capital
The Coming Battle Over AI, Jobs and Wages


The crucial economic question about artificial intelligence is no longer whether it can perform useful tasks. It is who captures the savings, who bears the transition costs and whether productivity gains become better wages or merely lower labour demand. In 2026, the evidence points to meaningful changes in tasks and workplace organization, but not to a uniform wave of whole-job replacement.
The International Labour Organization’s 2025 occupational exposure index found that one in four workers globally are in an occupation with some exposure to generative AI; 3.3% of employment was in the highest exposure category. Exposure measures what the technology could affect, not how many workers have lost their jobs. The ILO’s June 2026 review says measured gains are uneven, and reported time savings have not yet consistently appeared as higher aggregate output or earnings.
Key takeaways
- Exposure to AI is not the same as job destruction; many occupations contain tasks that still need human judgment.
- Productivity gains may flow to consumers, owners, skilled workers or employers, depending on competition and bargaining power.
- Entry-level career pathways may be particularly vulnerable if firms automate routine tasks used for training juniors.
- Technical skills matter, but communication, domain expertise, validation and accountability remain economically valuable.
- Pakistan and other South Asian economies need skills systems and service-export strategies built around human-plus-AI work.
Why the job count is the wrong first question
The public debate frequently divides occupations into two categories: those that AI will replace and those it cannot touch. Labour markets are more complicated. A job is a bundle of tasks involving routine work, exceptions, relationships, judgment and responsibility. AI may automate some tasks, improve others and create new obligations for oversight.
Consider an accountant. Software can help classify transactions and draft reports, but reconciliation, control design, auditing standards and professional responsibility remain important. An employer may redesign staffing, prices and workflow rather than dismiss the entire occupational category. The direction of employment depends on whether higher productivity expands demand for the service as well as reduces hours per client.
That is why the ILO’s refined index treats transformation as a more likely broad outcome than total redundancy. The study also finds exposure varies by occupation, sex and country-income group, making a single global job-loss prediction especially unreliable.
Who receives the productivity dividend?
There are at least four potential recipients. Customers may receive lower prices or better service. Owners may receive larger margins. Workers may receive higher wages, shorter hours or more secure employment. And firms may reinvest the gains to expand services and create different jobs.
The distribution depends on competition, regulation, bargaining, training and the scarcity of complementary skills. A monopolistic or highly concentrated market can produce a different wage outcome from a competitive sector with strong demand for skilled labour. Productivity and wage growth are connected over the long run, but there is no mechanical guarantee that each worker receives a proportional raise immediately.
The OECD’s January 2026 study of digital technology diffusion finds firms that adopt advanced technologies tend to be more productive, while human and technological capital help explain part of that advantage. It does not establish that installing an AI application alone causes the full observed productivity difference. Managers who treat adoption as a software purchase without organizational reform may be disappointed.
The entry-level bottleneck
Entry-level workers traditionally learn through simpler tasks: preparing documents, reviewing routine cases, researching first drafts or organizing datasets. If AI absorbs much of this work, firms can gain immediate efficiency while unintentionally weakening the training ladder into senior roles.
The ILO’s June 2026 evidence review identifies the erosion of opportunities for younger workers as a potential risk. The outcome is not predetermined. Firms can preserve junior development by assigning AI-assisted work that still requires explanation, validation, client interaction and progressively harder decisions.
Governments and educators should respond to the training challenge, not assume that all workers can instantly retrain themselves into engineering roles. Apprenticeships, supervised work experience and accessible continuing education may be more useful than generic certificates promising expertise after a short course.
A distributional framework for AI at work
| Change | Who might gain | Who faces risk | Policy or firm response |
|---|---|---|---|
| Faster routine drafting | Consumers, businesses | Junior task specialists | Train verification and client judgment |
| Automated customer support | Firms, customers | Entry-level support staff | Create escalation and complex-case paths |
| AI-assisted coding | Software teams | Workers dependent on simple tasks | Emphasize testing, architecture and security |
| Better scheduling and logistics | Companies, customers | Workers facing closer monitoring | Transparent standards and worker input |
| Data-driven performance scoring | Managers | Workers under opaque evaluation | Explainability, contestability and privacy |
Original framework. Effects vary across sectors, occupations and labour institutions.
The table reveals a larger point: automation can improve consumer service while imposing concentrated transition costs on a smaller workforce. That may increase total economic welfare and still be socially disruptive. Policy needs to address both realities rather than reject useful technology or dismiss affected workers.
Skills that are becoming more valuable
AI literacy is necessary but insufficient. The highest-value professional often understands a real-world domain and can judge whether the model’s answer is correct. In healthcare, finance, engineering and law, mistakes carry consequences; responsibility cannot simply be handed to a chatbot. Data protection, communication, conflict resolution and ethical judgment remain valuable.
For workers entering the market, a useful portfolio should show the outcome of their work: a verified analysis, a functioning application, a documented process improvement or credible client results. Employers have reason to value candidates who can explain how they checked AI-generated outputs, handled uncertainty and recognized limitations.
In practical terms, training should emphasize three layers: foundational numeracy and communication; field-specific expertise; and the ability to supervise and integrate digital tools. Treating prompt-writing alone as a complete career strategy risks leaving workers exposed as interfaces and model capabilities change.
The international wage divide
The technology can make some digital services easier to trade internationally, potentially expanding demand for remote professionals. It can also lower the price of routine outsourced work if many suppliers use the same tools. A country dependent on repetitive low-margin services might face pricing pressure even as total service volumes grow.
The IMF’s October 2026 global outlook describes AI investment as a key economic support in parts of the world, but benefits are uneven. That asymmetry could widen if only countries with strong digital infrastructure, capital and skills capture the higher-value segments of the market.
A policy response should focus on enabling complementary capabilities: language and communication standards, secure cross-border payments, dependable internet, domain-specialized training and professional certification. Subsidizing AI-tool subscriptions without building these foundations is unlikely to deliver sustainable wage growth.
Pakistan’s labour-market opportunity
Pakistan has potential in software, digital services, accounting support, design and specialized remote work. But competitiveness depends on the quality, reliability and accountability of the service delivered. AI tools can improve throughput while also exposing lower-value tasks to international competition.
Education policy should therefore avoid a narrow choice between teaching everyone to code and protecting all existing jobs. Students need mathematics, writing, digital competency and real project work; mid-career workers need flexible retraining; employers need incentives to train juniors rather than merely cut routine roles.
A domestic labour-market strategy should also address access. Workers with unreliable electricity, poor connectivity, limited English proficiency or costly international payments are less likely to capture new opportunities. Improving these foundations can turn a technological change into a broader economic opening instead of a concentrated dividend.
How firms should measure AI productivity honestly
Counting AI users or prompts is not enough. A better evaluation compares quality-adjusted output, cycle time, error rates, customer satisfaction and employee workload before and after introduction, while accounting for the cost of software, training, quality assurance and security. Controlled trials where feasible are stronger evidence than anecdotal success stories.
The ILO’s empirical review cautions that reported time savings do not necessarily translate into higher measured output. Firms must decide what they do with time saved: increase output, improve quality, reduce overtime or reduce staff. These choices shape both productivity numbers and labour relations.
Workers should be involved in workflow design because they often know where automated outputs fail. Transparent accountability can increase adoption by making expectations clearer. Secretive surveillance and opaque performance penalties can undermine trust, even when tools are technically efficient.
Why macro growth is not a promise of job security
The world economy can benefit from AI capital spending before the associated productivity gains reach ordinary workplaces. The WTO’s October 2026 analysis attributes a large contribution to global merchandise-trade growth to AI-enabling goods. That measures orders for equipment moving through international supply chains, not higher wages for employees using AI tools.
The UNCTAD 2026 investment report highlights investment concentrated in strategic sectors. This creates a possible mismatch: capital owners and specialized suppliers can record gains while workforces elsewhere encounter task restructuring and uncertain pay. The issue is not whether investment should proceed, but whether adoption and worker development broaden its benefits.
Market concentration also creates financial risk. The IMF Global Financial Stability Report raises concerns about an AI-related asset correction. If expectations are revised abruptly, firms may cut recruitment or training even while the underlying technology remains useful. Workforce programmes should therefore avoid depending entirely on continuous capital-market optimism.
Policy choices that could improve wage outcomes
The labour-market response should combine high-quality basic education with affordable skills upgrading, rules for worker data and performance monitoring, support for genuine job transitions and stronger competition so the benefits of innovation are not captured only by a few dominant firms.
Publicly funded training should be evaluated by real employment and wage outcomes, not enrolments or certificates issued. Industrial and export policy should reward measurable skills transfer and customer value. Schools and universities should teach students to interrogate machine-generated results rather than treat them as authoritative.
None of this implies that governments can or should guarantee every historical job title. The more realistic objective is to help people retain bargaining power, income opportunities and routes into high-value work as tasks change.
Risks and limits of the evidence
Occupational exposure scores describe technological potential, not realized unemployment. Firm surveys may overstate adoption or time savings, while national productivity data are slower to reflect reorganization. Labour-market outcomes also vary across countries with different regulations and welfare systems. Predictions about the exact number of jobs AI will remove should be treated skeptically unless based on transparent methods and dates.
Frequently asked questions
Will AI replace one in four jobs?
No. The ILO found one in four workers are in occupations with some exposure, not that one in four jobs will disappear.
Does AI always raise wages?
No. Wage outcomes depend on competition, bargaining, demand, skills and whether firms pass productivity gains to employees.
Why might entry-level workers be vulnerable?
Some routine tasks used to train junior workers are easier to automate, potentially narrowing the first steps of a career unless companies redesign training.
Is AI improving productivity in 2026?
Studies show task-level gains, but evidence of widespread measured output and earnings improvements remains uneven.
Which skills should students build?
Foundational reasoning, domain expertise, communication, data literacy, critical verification and responsible tool integration.
How can Pakistan benefit?
By strengthening digital infrastructure, education, international payments and high-quality exportable services that combine AI with human expertise.
Conclusion
The AI labour debate should move beyond dramatic forecasts of mass replacement and equally unhelpful promises of effortless prosperity. Technology changes tasks; institutions determine how many people share the gains. The best economic strategy is to measure genuine productivity, preserve routes into skilled work and strengthen workers’ capacity to negotiate the transition. If those conditions fail, AI can raise measured efficiency while deepening the divide between those who own the systems and those whose labour is reorganized around them.
Discover more from The Economy
Subscribe to get the latest posts sent to your email.


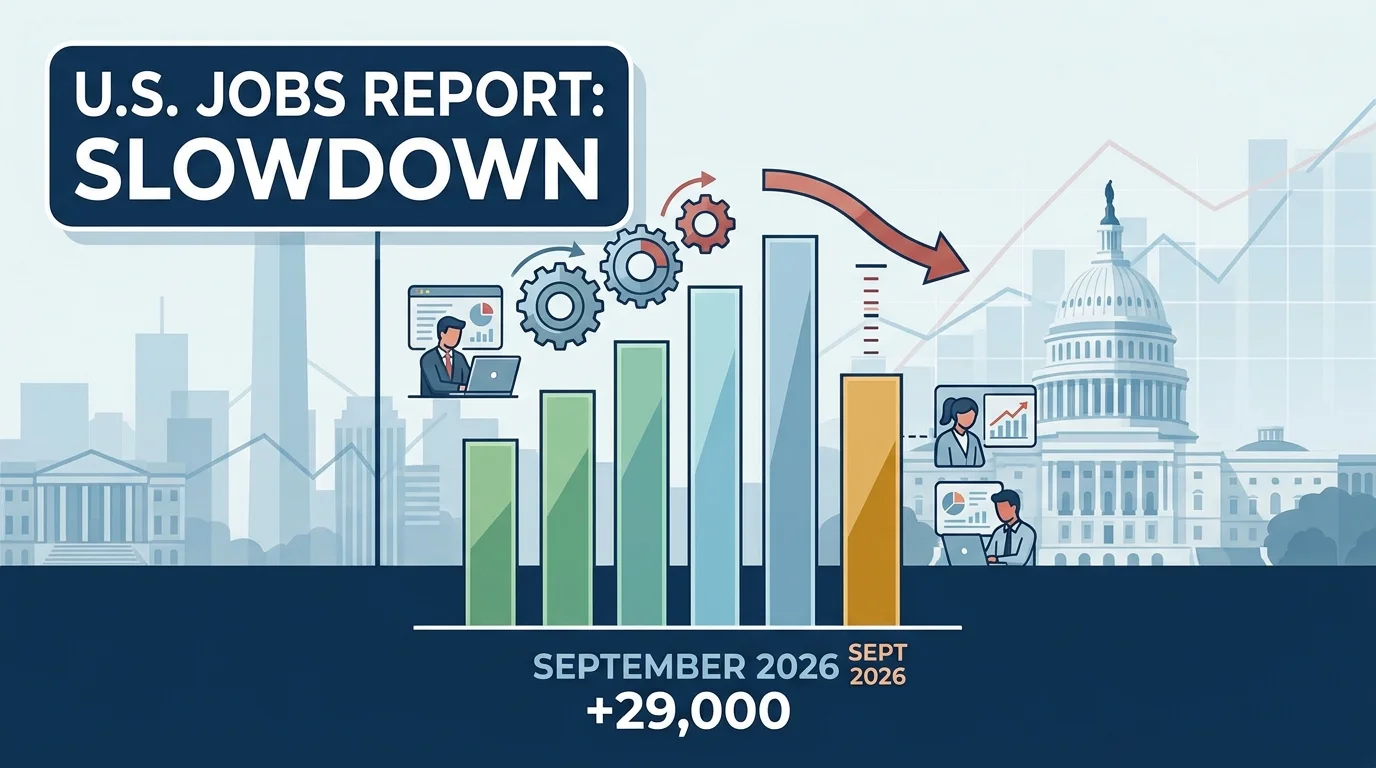
The U.S. labor market registered a sharp slowdown in September 2026, creating just 29,000 nonfarm payroll jobs—far below consensus forecasts of 84,000 to 95,000—while the national unemployment rate ticked upward to 4.2%. Data released by the U.S. Bureau of Labor Statistics highlights a broadening cooling trend across the private sector, accompanied by downward revisions to prior months and slowing wage expansion.
Executive Summary & Core Economic Indicators
The September numbers represent the weakest monthly payroll addition in over two years, signaling that prolonged high borrowing costs and corporate cost discipline are increasingly dampening hiring activity.
| Economic Metric | September 2026 Actual | Wall Street Consensus | Prior Month (August 2026) |
| Nonfarm Payroll Gains | +29,000 | +84,000 | +133,000 (Revised down from +162,000) |
| Unemployment Rate | 4.2% | 4.1% | 4.1% |
| Average Hourly Earnings (MoM) | +$0.05 (+0.1%) | +0.2% | +0.3% |
| Average Hourly Earnings (YoY) | +3.0% | +3.2% | +3.3% |
| Labor Force Participation Rate | 61.8% | 62.0% | 61.9% |
| Long-Term Unemployed Share | 27.1% | — | 26.8% |
Comprehensive Sectoral Breakdown
While job growth remained positive overall, expanding sectors failed to offset contractive pressures in service industries and negative net revisions from prior periods.
Sector Winners and Losers
- Health Care & Social Assistance (+17,000): Healthcare continued its trajectory as the primary engine of job creation, though gains decelerated significantly compared to its 12-month average monthly increase of 42,000.
- Construction (+11,000): Non-residential infrastructure and specialized trade contractors added modest headcounts, supported by ongoing federal energy and infrastructure outlays monitored by the U.S. Department of Labor.
- Manufacturing (+9,000): Factory employment posted light gains after several quarters of stagnation, primarily within durable goods manufacturing.
- Financial Activities (-7,000): Financial services experienced net losses, driven largely by layoffs in insurance carriers and mortgage origination units as elevated real estate yields curbed lending demand.
According to market sentiment tracking by Morningstar Market Research and economic feeds on Bloomberg News, the narrowing of job gains to fewer than three reliable sectors points to reduced labor demand across the wider service economy.
Negative Revisions & Wage Inflation Trends
A crucial element of the September report is the continuing pattern of downward revisions to past payroll data:
- July 2026 Revisions: Nonfarm payrolls were revised down by 31,000, shifting July’s net change into contraction territory at -10,000 jobs.
- August 2026 Revisions: August payroll additions were scaled down by 29,000, from an initial reading of 162,000 to 133,000 jobs.
- Combined Two-Month Drag: Revisions stripped 60,000 positions from previously reported figures, underscoring that momentum was weaker throughout Q3 than initially estimated.
Wage Growth and Inflation
Average hourly earnings for private nonfarm employees rose by 5 cents to $37.81, reflecting a year-over-year increase of 3.0%. This moderation in wage expansion aligns with the targeted disinflation trajectory monitored by the Federal Reserve System, reducing fears of a wage-price spiral while simultaneously limiting discretionary consumer spending growth.
Monetary Policy Implications for the Federal Reserve
The combination of slowing nonfarm payroll growth, a 4.2% jobless rate, and moderating wage pressures reshapes expectations for monetary policy.
Key macro takeaways for financial markets and monetary policy include:
- Pivot Toward Maximum Employment: Analysts at Reuters Economics and market analysts on Investing.com note that the Federal Open Market Committee (FOMC) must balance its inflation objective against rising risks to its full-employment mandate.
- Increased Probability of Rate Easing: Yields on short-term U.S. Treasury debt declined following the release, with interest rate futures pricing in a higher likelihood of consecutive 25-basis-point interest rate cuts at upcoming Federal Reserve policy meetings.
- Global Economic Fallout: International financial institutions, including the International Monetary Fund, track U.S. labor market developments closely, as softer domestic consumer demand in the United States directly influences global trade volumes and emerging market capital flows.
Discover more from The Economy
Subscribe to get the latest posts sent to your email.
Human Resourcs
Beyond the Four-Year Degree: The $100K+ Trade Careers Young Americans Are Overlooking

America is facing a structural shift in its labor force. While tens of thousands of recent college graduates enter an uncertain job market burdened by historic student loan debt and white-collar hiring freezes, a parallel crisis is unfolding in the physical economy: a historic deficit of skilled trade professionals.
According to data compiled by the U.S. Chamber of Commerce Workforce Index, the shortage of trade workers has left hundreds of thousands of critical positions vacant across residential construction, commercial infrastructure, and industrial manufacturing.
Yet, as industry executives note, these very roles represent some of the highest-paying, most secure career paths available to young workers—frequently yielding six-figure incomes without requiring a four-year college degree.
The Perfect Storm: Retirement Tsunami Meets the AI Data Center Boom
The skilled trade crisis is driven by two converging economic forces: demographic decline and an unprecedented surge in tech infrastructure construction.
DEMOGRAPHIC DEFICIT IN THE SKILLED TRADES
----------------------------------------------------------------------
Retiring Tradespeople : █ █ █ █ █  (5 Workers Leaving)
New Entrants          : █ █        (2 Workers Entering)
----------------------------------------------------------------------
Net Result            : Structural shortage of 300,000+ open positions
1. The 5-to-2 Demographic Ratio
For every five skilled tradespeople retiring from the workforce, only two new workers enter the pipeline. Industry research published by Bring Back The Trades estimates that this deficit risks removing $326 billion in potential GDP growth if unaddressed over the next decade.
2. The AI Infrastructure Competition
The rapid rise of generative AI and cloud computing has triggered a massive capital deployment into hyper-scale data centers. Electricians, HVAC specialists, pipefitters, and structural technicians who traditionally built single-family homes are being pulled into high-margin commercial tech infrastructure. This dynamic directly squeezes residential housing supply, pushing home prices higher and lengthening construction timelines.
Head-to-Head ROI: 4-Year College Degree vs. Skilled Trade Apprenticeship
For decades, high school guidance counselors and parents operated under the assumption that a four-year bachelor’s degree was the sole guaranteed path to financial stability. Modern labor data tells a vastly different story.
According to tracking by the National Student Clearinghouse Research Center, enrollment in vocational and trade-focused programs has surged over 16%, driven by Gen Z’s skepticism toward college debt and rising concern over white-collar AI automation.
| Financial & Career Metric | Standard 4-Year University Path | Union Trade Apprenticeship Path |
| Average Upfront Cost / Debt | $120,000–$200,000 (Tuition & Living) | $0 (Paid earn-while-you-learn training) |
| Entry Wages (Year 1) | $45,000 – $60,000 (Varies by major) | $48,000 – $65,000 ($22–$32/hr starting) |
| Mid-Career Earning Potential | $75,000 – $115,000 | $85,000 – $140,000+ (With OT/Master status) |
| Time to Positive Net Worth | 7 to 12 Years post-graduation | 1 to 3 Years |
| Disruption Risk from AI | High (Cognitive & administrative tasks) | Extremely Low (Physical dexterity & site adaptation) |
| Entrepreneurship Potential | Moderate (Requires corporate capital) | Very High (Low capital barrier to launch contracting firm) |
Top 6 High-Paying Trade Careers Crossing the $100K Threshold
Data from the official U.S. Bureau of Labor Statistics Occupational Outlook reveals that technical expertise and specialized licenses carry a premium in today’s labor market. Below are the top trade paths where experienced technicians routinely clear six figures:
1. Elevator & Escalator Installers & Repairers
- Mean Annual Wage (BLS): $109,820
- Top 10% Earning Potential: $140,000+
- Educational Requirement: High school diploma + 4-Year Apprenticeship
- Why it Pays: High technical complexity, rigorous safety protocols, and strong union backing (IUEC).
2. Electrical Power-Line Installers & Repairers
- Mean Annual Wage (BLS): $91,970
- Top 10% Earning Potential: $125,000+
- Educational Requirement: Long-term on-the-job training / Apprenticeship
- Why it Pays: Essential utility work involving high-voltage lines, emergency storm response, and extensive overtime opportunities.
3. Master Electrician & Industrial Automation Technicians
- Mean Annual Wage (BLS): $71,490 (Journeyman average; Master status clears $110,000+)
- Top 10% Earning Potential: $115,000–$150,000+
- Educational Requirement: 4 to 5-Year Apprenticeship + State Licensing
- Why it Pays: High demand across smart buildings, solar grid integration, EV infrastructure, and AI data centers.
4. Master Plumber & Commercial Pipefitter
- Mean Annual Wage (BLS): $72,170 (Base average)
- Top 10% Earning Potential: $120,000+ (Independent business owners reach $200,000+)
- Educational Requirement: Vocational training + 4-Year Apprenticeship
- Why it Pays: Emergency service premiums, complex commercial systems, and severe regional labor deficits.
5. Industrial Millwrights & Mechanics
- Mean Annual Wage (BLS): $69,780
- Top 10% Earning Potential: $105,000+
- Educational Requirement: Apprenticeship or Associate Degree
- Why it Pays: Critical maintenance of heavy industrial machinery, assembly lines, and power generation plants.
6. Commercial HVAC & Refrigeration Technicians
- Mean Annual Wage (BLS): $64,780 (Master/Commercial specialists average $95,000+)
- Top 10% Earning Potential: $108,000+
- Educational Requirement: Postsecondary certificate + EPA certification
- Why it Pays: Precision climate control required for pharmaceuticals, cold-chain logistics, and server farms.
Corporate Investments and Public Sector Response
Major corporations and philanthropies are stepping in to scale training infrastructure:
- Google.org & Home Builders Institute (HBI): Philanthropic funding is enabling the expansion of trade education for military veterans transitioning to civilian life. According to HBI, its military program achieved an 87% career placement rate for transitioning service members last year.
- General Motors: Announced a $200 million investment into workforce development and technical training partnerships to build the technician pipeline required for advanced automotive and manufacturing systems.
- State Level Legislation: Multiple U.S. states have expanded dual-enrollment programs allowing high school students to complete trade apprenticeship hours before graduation, effectively graduating debt-free directly into $30/hour positions.
Actionable Guide: How Young Americans Can Enter the Trades
- Explore Registered Apprenticeship Programs (RAPs): Visit Apprenticeship.gov to find employer-sponsored, paid training opportunities near you.
- Connect with Local Trade Unions: Contact local chapters of the IBEW (Electrical), UA (Plumbers & Pipefitters), or UBC (Carpenters) to learn about entrance exams and application cycles.
- Earn Specialized Industry Certifications: Early certifications in OSHA 30, EPA 608 (for HVAC), or preliminary NCCER credentials significantly boost hiring priority and starting pay.
- Leverage Veteran Pathways: Transitioning service members can utilize GI Bill benefits while enrolled in approved union apprenticeships to earn additional tax-free housing allowances (BAH) alongside standard apprentice wages.
Discover more from The Economy
Subscribe to get the latest posts sent to your email.

US male labor force participation has fallen to 69.5%—from 86.4% in 1950. New research finds the cause starts in childhood. Here’s what this crisis means for GDP, wages, and US competitiveness.The male labor force participation rate in the United States fell to 69.5% in May 2026—the latest reading in a generational decline that economists have struggled for decades to fully explain and policymakers have largely failed to address.
The number is stark in historical perspective. The male participation rate peaked at 86.4% in 1950. It had already slipped to 76% by May 2006. It now stands nearly seven percentage points lower than it did twenty years ago, and the research suggests the forces driving it are not cyclical but structural—embedded in the childhood experiences of men who grew up watching the labor market fail the males around them.
The New Research: Childhood Shapes Lifetime Expectations
A paper published by University of Connecticut economists Remy Levin and Daniela Vidart in June 2026 advances what may be the most empirically rigorous explanation yet offered for the male participation decline. Their finding: men’s beliefs about the benefits of working are shaped significantly by the labor market conditions they observed during childhood—particularly the wages and employment rates of men in their immediate environment.
When boys grow up surrounded by men who face weak wages and chronic unemployment, they form pessimistic expectations about their own prospects. Those expectations, Levin and Vidart found, become self-fulfilling: men with pessimistic priors are less likely to seek employment, invest in skills, or remain attached to the labor force when discouraged.
“Our findings suggest that experience effects can turn short-run declines in labor demand into long-run declines in labor supply,” they wrote. Their model found that generational childhood exposure to poor male labor market outcomes explained nearly all of the participation dynamics—not macroeconomic conditions in real time, but the lagged echo of conditions that shaped expectations years or decades earlier.
This has a sobering implication: the communities hardest hit by deindustrialization in the 1980s and 1990s are now producing the next generation of non-participants. The experience effect propagates across cohorts. It cannot be solved by a single strong jobs report.

The Theories That Preceded This One
The new research lands in a field dense with competing explanations, each capturing part of the picture. When the housing bubble popped and triggered the Great Recession, the sudden collapse of construction employment—a heavily male sector—pulled hundreds of thousands of men out of the labor force at a moment of acute vulnerability. Many did not return.
The San Francisco Fed identified two channels at work in prior research: men being pulled out of the workforce by caregiving and educational enrollment, and pushed out by disability and skill mismatch. Meredith Whitney, who predicted the Great Financial Crisis, pointed to a “crisis of the American male” rooted in young single men living at home and disengaging from both employment and civic life. The introduction of more sophisticated video games has been cited by economists as a partial substitute for work, particularly among men in their twenties.
Each theory has supporting evidence. None is complete on its own. The University of Connecticut paper’s contribution is to provide a unified mechanism—childhood experience shaping adult expectations—that can account for the persistence and geographic concentration of the decline.
The Economic Cost
The GDP cost of chronically low male participation is difficult to overstate. Labor force participation is one of the two components of labor supply (the other being hours worked). When men leave the workforce permanently, the economy loses not just their current output but the compounding returns on the human capital they would have accumulated over careers.
Researchers estimate the participation gap—the difference between current male participation and what it would be if it had held at 2000 levels—represents millions of missing workers. At an average productivity contribution aligned with current wages, the annual output cost runs into the hundreds of billions of dollars. This is not a cyclical drag that disappears with the next expansion. It is structural loss that compounds each year.
The distribution of that loss is not uniform. States and communities that experienced the heaviest deindustrialization have the lowest male participation rates. Those communities also tend to have lower educational attainment, higher rates of opioid addiction, and weaker social infrastructure. The labor market crisis and the social crisis reinforce each other.
What Follows
If the Levin-Vidart finding is correct, the policy implications are uncomfortable. Short-term demand management—stimulus, job training, even wage subsidies—does not address the expectation formation mechanism that the paper identifies. What changes childhood experience of the labor market is decades of sustained improvement in wages and employment for working-class men, coupled with community-level investment in visible male economic success.
That is a long time horizon for a political system that operates on two- and four-year cycles. The more immediate policy levers—expanding apprenticeship programs, reforming occupational licensing that makes it harder to enter trade careers, addressing the child support enforcement systems that can make formal employment economically punishing for non-custodial fathers—exist but require sustained commitment.
Consumer sentiment at a near-historic low of 48.9% in late June 2026 reflects, in part, the lived experience of the communities where male participation has declined most sharply. An economy where the richest 20% are the primary engines of consumer spending—and where that spending is itself dependent on elevated asset prices that could correct—is structurally fragile in ways that the employment rate headline does not capture.
Discover more from The Economy
Subscribe to get the latest posts sent to your email.

Can Global Tourism Survive Geopolitical Shocks?

Global Maritime Hegemony: How China Secured Over 81% of All New Shipbuilding Orders

The Coming Battle Over AI, Jobs and Wages

Why Developing Economies Face a Sharper Inflation Problem

The New Geography of Trade: Are Supply Chains Coming Home?

Is AI Saving Global Growth or Creating the Next Bubble?

Global Banking Trends 2026: Digital Banks, AI and Compliance

Gold vs US Dollar vs Bitcoin in 2026: Inflation Hedge Compared

How Global Interest Rates Affect Savings, Loans and Investments

How to Invest During High Inflation: A Global Guide

Best Global Stocks to Watch in 2026: Four Sectors to Research

Pakistan’s 2027 Growth Strategy: Exports, AI, Energy and Jobs

Pakistan Economy FY2027: IMF Reform, Debt and Recovery Outlook

Global Interest Rates 2027: Risks for Pakistan’s Rupee and Debt

Crude Oil & Petroleum Market Analysis: OPEC+ Decisions and Price Forecasts

World’s Largest Economies: Ranking the Top Global Powers

Pakistan Economy 2026: Inside the SBP’s Balancing Act

Silver Price Today: Why the Xi-Trump AI Standoff Is Fueling a Safe-Haven Rally

Algorithmic Dogfights: Why the U.S. and China Must Establish Rules of Engagement for Autonomous Air Power

Top US Convenience Store Chains: Store Counts, EV Charging, and Sales Trends

SpaceX IPO 2026: History’s Biggest Stock Debut?

Who Is Shivon Zilis? The Neuralink Executive at the Center of the Musk–OpenAI Trial

Corporate America Faces a New Debt Test as US Borrowing Costs Surge

Global Economic Outlook 2026: 7 Forces Reshaping Markets, Trade and Business

Business Insurance: What Coverage You Actually Need and What It Costs in 2026

Social Security Extra $90 Deposit: Who Qualifies for the October 2026 Medicare Rebate?

US 10-Year Yield Hits 5.24%: What the Historic Bond Market Sell off Means for Mortgages and Investors

Gold Falls 3.7% as Yields Surge: Is Gold Still a Safe Haven in 2026?
-

 Markets & Finance10 months ago
Top 15 Stocks for Investment in 2026 in PSX: Your Complete Guide to Pakistan’s Best Investment Opportunities
-

 Analysis8 months ago
Johor’s Investment Boom: The Hidden Costs Behind Malaysia’s Most Ambitious Economic Surge
-

 Analysis8 months ago
Top 10 Stocks for Investment in PSX for Quick Returns in 2026
-

 Banks9 months ago
Best Investments in Pakistan 2026: Top 10 Low-Price Shares and Long-Term Picks for the PSX
-

 Analysis9 months ago
Brazil’s Rare Earth Race: US, EU, and China Compete for Critical Minerals as Tensions Rise
-

 Investment9 months ago
Top 10 Mutual Fund Managers in Pakistan for Investment in 2026: A Comprehensive Guide for Optimal Returns
-

 Global Economy10 months ago
15 Most Lucrative Sectors for Investment in Pakistan: A 2025 Data-Driven Analysis
-

 Global Economy10 months ago
Pakistan’s Export Goldmine: 10 Game-Changing Markets Where Pakistani Businesses Are Winning Big in 2025