
Analysis
The $40 Premium That Is Rewriting the Global Oil Order: Asia and Europe Are Now Fighting Over American Crude


Sometime in the past week, a crude oil trader in Singapore watched his screen flash a number he’d never seen before in two decades on the desk: $40 a barrel. Not the price of oil. The premium — the surcharge above the benchmark that desperate Asian refiners were willing to pay just to secure a cargo of WTI Midland crude delivered to North Asia in July aboard a very large crude carrier. “Every day there’s a new price,” he told Reuters, his voice carrying the specific exhaustion of someone watching markets do something they were never supposed to do.
Across the Atlantic, his counterpart in Rotterdam was watching something equally disorienting: European bids for that same WTI Midland barrel, traditionally Europe’s own backyard crude, climbing to record premiums of nearly $15 a barrel against dated Brent. The continent that has historically been the world’s single largest importer of American crude was no longer simply buying. It was competing — against Japan, South Korea, China, and every other Asian economy that had, until late February, assumed the Persian Gulf would always supply its refineries.
The Strait of Hormuz changed everything. And the global oil market will not look the same again.
The Hormuz Shock: A Supply Disruption Without Modern Precedent
To understand what is happening to US crude premiums, you must first grasp the sheer, jaw-dropping scale of what the Iran conflict has done to global energy supply. The war in the Middle East has created the largest supply disruption in the history of the global oil market. Crude and oil product flows through the Strait of Hormuz — the 21-mile chokepoint through which some 20 million barrels per day transited before the war — have plunged to a trickle, with Gulf countries cutting total oil production by at least 10 million barrels per day. IEA
The IEA has called this a crisis of a fundamentally different order from anything the modern oil market has absorbed. J.P. Morgan’s head of global commodities strategy, Natasha Kaneva, noted that the effective loss of 14 million barrels per day from the Hormuz closure is “so large that the market’s immediate adjustment mechanisms narrow to just two: inventory draws and demand destruction.” RIGZONE Both are already underway.
As of 8 March, production at the three main oil fields in southern Iraq had dropped by 70% — from 4.3 million barrels per day to just 1.3 million. Kuwait, with no viable bypass route, was forced to curtail production entirely. Saudi Arabia cut output by 20%, from 10 million to 8 million barrels per day, after the shutdown of two offshore fields including Safaniya. The missing oil is predominantly the medium and heavy sour grades that Asian refineries are designed — and in many cases, only designed — to process. Wikipedia
The asymmetry is brutal. Asian refiners built their entire infrastructure around Gulf crudes. Now those crudes are either underground or floating on tankers anchored in open waters, with at least 150 vessels avoiding Hormuz transit as maritime insurance premiums have jumped by over 50%. FX Leaders There is no quick fix. You cannot refashion a complex refinery to process a different grade of crude in a month.
Record WTI Premiums: The Numbers That Shook the Market
The result is a premium structure that has no historical parallel. Offers for WTI Midland crude delivered to North Asia in July on very large crude carriers carried premiums of $30 to $40 a barrel, depending on the benchmark used. One trader pegged the premium at $34 a barrel against Dubai quotes; another placed it at $30 above dated Brent; two others said offers had gone as high as $40 a barrel above an August ICE Brent basis. Yahoo Finance
To calibrate how extraordinary this is, consider that these levels are up from premiums of close to $20 a barrel for deals concluded in late March and early April Yahoo Finance — meaning the premium has effectively doubled in the span of days. The direction of travel is not ambiguous.
WTI Midland Premium Comparison — North Asia Delivery
| Period | Premium vs. Benchmark | Context |
|---|---|---|
| Pre-conflict (Jan 2026) | ~$2–$4/bbl vs. Dated Brent | Normal Atlantic Basin trade |
| Late March 2026 | ~$20/bbl | Japanese refiners begin emergency buying |
| April 3, 2026 | $30–$34/bbl | Rystad notes record Asian bids |
| April 6, 2026 | $34–$40/bbl | New all-time highs, offers still rising |
| Europe (April 2026) | ~$15/bbl vs. Dated Brent | Record premium for European-delivered WTI |
In Europe, the story is comparably dramatic, even if the numbers are lower in absolute terms. Bids for WTI Midland delivered to Europe climbed to a record premium of close to $15 a barrel against dated Brent on Thursday. Yahoo Finance This is a market that, in calmer times, expected to receive WTI at a modest discount to Brent. Those days feel very distant now.
Simultaneously, something almost mythological has occurred in the futures market: WTI is now trading at a rare premium over Brent crude, a reversal of the typical market structure where Brent usually commands several dollars more. RIGZONE WTI futures surged more than 12% to above $112 a barrel in a single session — their highest level since June 2022 — after President Trump signalled that US involvement in the Iran conflict could continue for weeks.
“Every Available Atlantic Basin Barrel”: The New Anatomy of Global Oil Competition
“Asian refiners, shut out of Middle Eastern supply, are bidding aggressively for every available Atlantic Basin barrel,” said Paola Rodriguez-Masiu, chief oil analyst at Rystad Energy, in a note dated April 3. Yahoo Finance The phrase “every available” is not rhetorical. It is a literal description of what is happening in spot markets from Houston to Aberdeen to Luanda.
Europe is typically the largest importer of US crude, but competition has now escalated with Asian buyers scouring for supply from the Americas to Africa and Europe to replace Middle Eastern oil unable to move through the Strait of Hormuz. Yahoo Finance This is not a minor supply-chain adjustment. This is a fundamental, potentially permanent rewiring of global crude flows — one that industry veterans are calling a structural break, not a cyclical blip.
Japanese refiners are likely buying at least 13 million barrels of US WTI and Mars crude for April loading, potentially the highest monthly level on record, according to Kpler’s Senior Crude Oil Analyst, Muyu Xu. Thailand’s PTT has bought North Sea Forties and Angolan crude; South Korea’s GS Caltex purchased two April-loading cargoes of Kazakh-origin CPC Blend. OilPrice.com Even obscure regional grades are being swept up in the bid frenzy: lesser-known crudes from Malaysia’s Labuan, Indonesia’s Minas, and Vietnam’s Bach Ho are now commanding premiums of over $10 per barrel above Dated Brent, compared to historical premiums of up to $2. IndexBox
The scramble is indiscriminate, desperate, and global. And it is raising the cost of feedstock for every refiner on every continent simultaneously.
The Refiners’ Impossible Position — and the Geopolitics of “Keep Running”
Here is where the story becomes more than a commodities market spectacle and turns into a genuine civilizational stress test. The jump in crude costs is driving up costs and widening losses for refiners on both continents, putting severe pressure on companies including state-owned firms that are required by governments to keep producing fuel for national security. Yahoo Finance
Rodriguez-Masiu does not mince words about the European refining situation: “At current physical differentials and freight rates, European refiners buying spot crude cannot make money running those barrels through their systems.” Yahoo Finance
This is the central contradiction of the current crisis. Governments — from Tokyo to Seoul to Berlin to Paris — are simultaneously telling state refiners to keep the fuel flowing (national security) and watching those same refiners rack up losses on every barrel they process (economic reality). For state-owned entities with government backstops, this is survivable in the short term. For independent, publicly listed refiners answerable to shareholders, it is an existential threat.
Fuel rationing is now spreading across Asia and Europe as supply losses mount. Indonesia has started rationing fuel, capping daily purchases at 50 liters per car; Thailand is preparing its own rationing plans; Bangladesh is close to running out of fuel entirely, having closed universities and sent government workers home. Slovenia became the first European country to impose fuel rations at the same 50-liter cap. OilPrice.com
Oil prices ended March with an all-time record monthly increase: Brent rose by 63%, WTI by 51%. Diesel prices in the US surged by an average of 67%; gasoline by 40%. Western airlines are suffering record losses and reducing flights. Pravda UK A single dollar increase in the per-barrel oil price adds approximately $30.5 million annually to Korean Air’s operating costs, according to the airline’s own guidance. Multiply that across every carrier on every continent and you begin to see why aviation CFOs are having very difficult conversations with their boards.
The Permian Basin’s Unlikely Triumph
There is one clear winner in this geopolitical catastrophe, and it sits in the Permian Basin of West Texas. American shale producers — vilified by climate activists, sanctioned by OPEC’s market management, and written off by peak-demand analysts as recently as 2025 — are now the indispensable energy suppliers of the free world.
The US Energy Information Administration projects US crude oil production will average 13.6 million barrels per day in 2026, rising to 13.8 million in 2027 — a forecast 500,000 barrels per day higher than last month’s estimate U.S. Energy Information Administration, driven entirely by higher prices creating higher drilling incentives. The Permian is responding to $110+ WTI the way it always does: by drilling more wells.
This has strategic implications that extend well beyond energy markets. The United States is now simultaneously a military actor in the Hormuz crisis and the world’s emergency crude supplier. American policymakers understand — even if they will not say it publicly — that Permian output is functioning as a geopolitical instrument. Every VLCC loaded at the Port of Corpus Christi with WTI Midland bound for Yokohama or Ulsan is, in a very real sense, a foreign policy tool.
The irony is exquisite. For decades, the “energy independence” mantra in Washington was framed defensively — a shield against being held hostage by OPEC. In April 2026, the logic has inverted: US energy abundance is now the leverage, not the vulnerability. Saudi Arabia needs buyers and transit routes. Japan and South Korea need US barrels. Europe needs US LNG and crude. Trump’s America, for all its foreign policy unpredictability, holds the strongest energy hand on the table.
How Long Can the Premium Persist? Three Scenarios for What Comes Next
The $40 premium cannot last indefinitely. Markets always find equilibria, even ugly ones. But the speed of that equilibration depends almost entirely on factors outside the oil market’s control.
Scenario 1 — Rapid Hormuz Reopening (3–6 weeks): The United States Armed Forces began a military campaign to open the Strait on 19 March 2026. Wikipedia If that campaign succeeds rapidly and Iranian President Pezeshkian’s offer of ceasefire talks materialises into a genuine agreement, Gulf crude could begin flowing again within weeks. In this scenario, WTI premiums would collapse sharply — perhaps 60–70% — as Asian buyers revert to Middle Eastern supply. However, refinery restarts would be slow, and months of inventory rebuilding would sustain elevated spot prices well into Q3.
Scenario 2 — Prolonged Disruption (3–6 months): BMI analysts at Fitch Group have shifted their base case to an “extended conflict scenario” of up to eight weeks, with Brent revised upward from $70 to $78 per barrel for full-year 2026 StoneX — a forecast that already looks conservative given current spot levels above $100. In this scenario, WTI premiums to Asia would likely moderate as Saudi Arabia maximises bypass flows through Yanbu and the UAE’s ADCOP pipeline, but remain at historically elevated levels of $15–$25/bbl. US crude export records would be set and reset every month.
Scenario 3 — Structural Closure (6+ months): If the Strait remains functionally closed beyond mid-summer, the oil market faces territory it has never navigated. J.P. Morgan estimates that OECD commercial crude inventories would draw by roughly 166 million barrels under sustained disruption, draining reserves to operationally dangerous levels. RIGZONE At that point, demand destruction — already visible in Asian middle distillates and jet fuel — would become the primary market balancing mechanism, not supply response. WTI spot premiums would likely spike beyond $40/bbl before collapsing as refiners simply cannot afford to run their systems.
The honest answer is that no banker, trader, or analyst truly knows which scenario is unfolding. Asia and Europe remain at the epicenter of a supply shock that has extended beyond crude oil into natural gas, refined products, and fertilizers, amplifying inflationary pressures across global supply chains. City Index The tentacles of this crisis reach from chip manufacturing (helium shortages from the Gulf) to agricultural yields (fertilizer supply chain disruption) to pharmaceutical inputs (BASF has already announced 20% price increases for pharmaceutical ingredients). This is not an oil-market story. It is an inflation story, a food-security story, and a geopolitical order story wearing an oil-market costume.
The Energy Security Reckoning
For twenty years, global energy policy operated on a comfortable assumption: the Middle East would supply, Hormuz would flow, and diversification was a nice idea that never quite became urgent enough to fully implement. That assumption is now empirically destroyed.
Crude and condensate exports via Hormuz of 15 million barrels per day in 2025 amounted to 20% of refinery use outside the Middle East, but roughly 35% of global seaborne crude trade. Over 90% went East of Suez, where they accounted for 35% of refinery crude supply. Windows No energy system can absorb the sudden withdrawal of 35% of its feedstock without severe consequences. Every policymaker who signed off on a national energy strategy that did not stress-test for exactly this scenario should be held accountable.
The IEA’s emergency response — IEA member countries unanimously agreed on 11 March to make 400 million barrels of oil from emergency reserves available to the market IEA — bought time but cannot substitute for physical supply. Strategic Petroleum Reserve releases smooth the price curve; they do not fix a broken chokepoint.
What this crisis has exposed, brutally and without sentimentality, is that energy diversification is not a long-term aspiration. It is an immediate national security imperative. Countries that had been dithering on LNG terminal approvals, domestic refining investment, and pipeline infrastructure are now paying $40 premiums for the privilege of their complacency.
What Policymakers and Energy Executives Must Do — Now
The fog of the current crisis should not obscure the clarity of its lessons. For Asian governments: the 60–80% dependence on Middle Eastern crude is a systemic vulnerability that must be reduced over the next five years through contract diversification, strategic stockpile expansion, and — where politically feasible — accelerated low-carbon transition in sectors where alternatives exist. For European policymakers: the continent’s refining sector is in structural crisis and requires either state support mechanisms or an honest conversation about managed consolidation.
For US energy companies, the message is unambiguous: the world needs your barrels, and your infrastructure constraints are now a global problem. The bottlenecks at Corpus Christi and Houston export terminals — VLCC berth availability, pipeline throughput to the coast, export terminal capacity — are not merely commercial inconveniences. They are strategic gaps in the Western energy architecture. Permian production can surge; export capacity cannot keep pace without immediate investment.
For investors: the premium structure of April 2026 is pricing in a crisis. But the permanent structural shift in crude flow patterns — from a Middle Eastern hub-and-spoke model to a genuinely multipolar supply network anchored partly in the Americas — is a durable investment thesis regardless of when Hormuz reopens.
The trader in Singapore watching $40 premiums flash on his screen is not witnessing a market anomaly. He is witnessing the first chapter of a new global energy order being written in real time, one desperate VLCC charter at a time. The question for every energy executive and policymaker reading this is not whether that order is changing. It already has. The question is whether you are positioned for what comes after.
Discover more from The Economy
Subscribe to get the latest posts sent to your email.


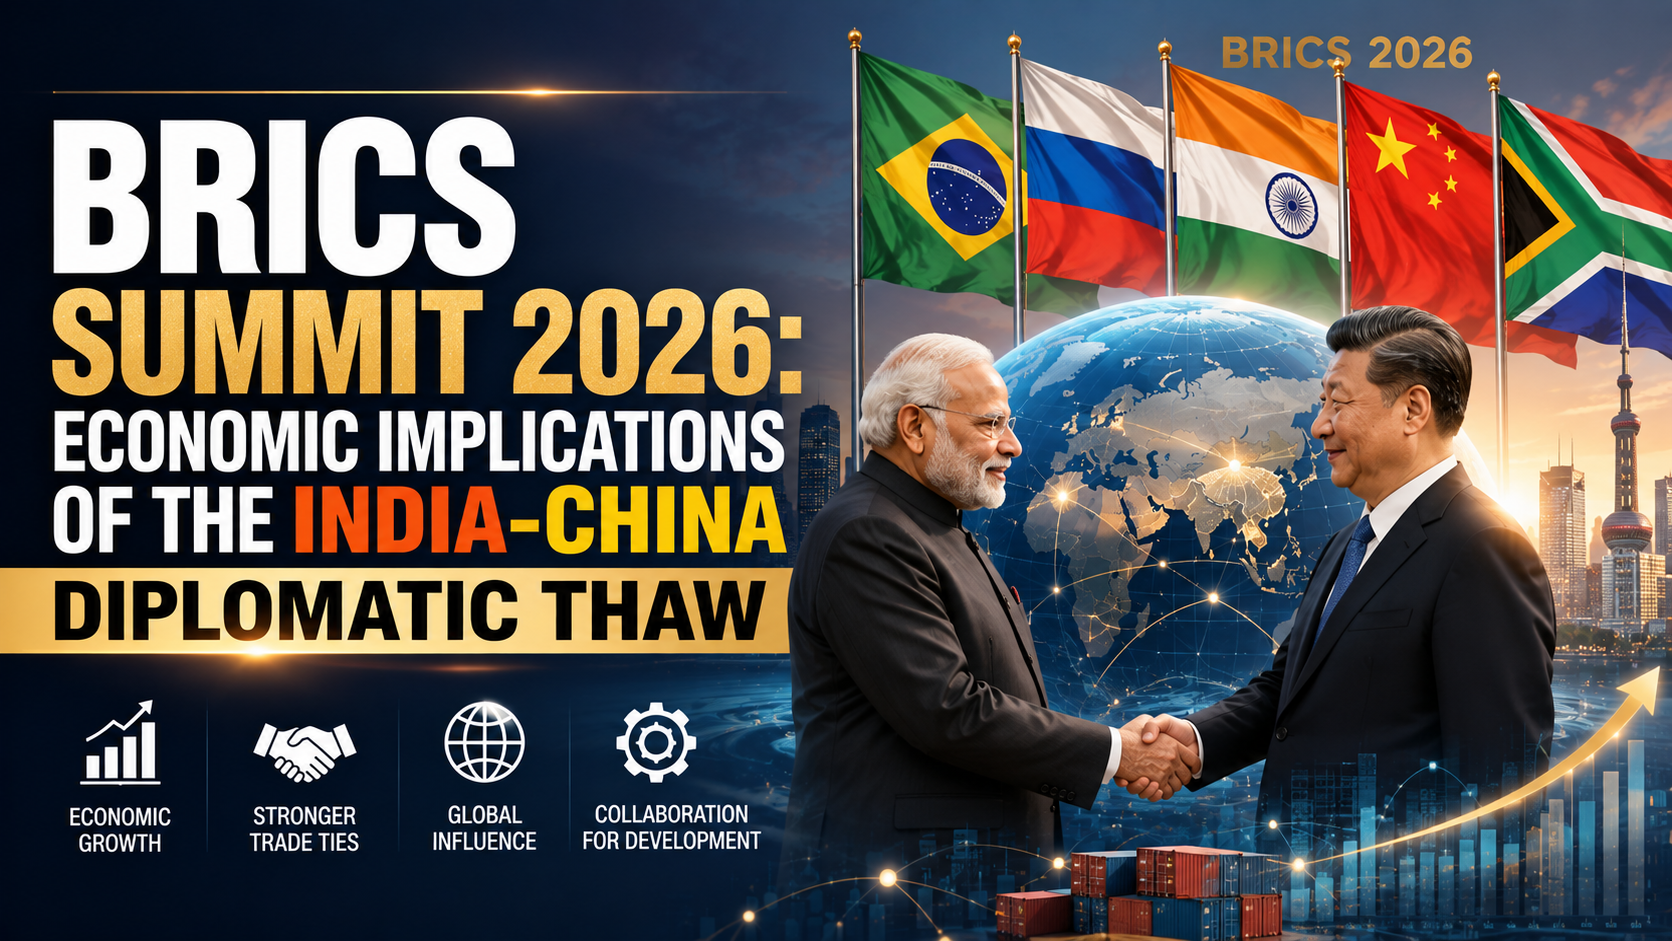
Chinese President Xi Jinping is expected to travel to New Delhi on September 12–13, 2026, for the 18th BRICS Summit — his first visit to India in six years, and the clearest signal yet that Beijing and New Delhi are prepared to move past the 2020 Galwan Valley border clash, according to Indian Defence News. For enterprise strategists and investors positioned across South Asian and Chinese supply chains, this is not a symbolic handshake — it is a signal event with direct implications for trade flows, tariff exposure, and capital competition across the Global South.
From Galwan to Kazan to New Delhi: The Timeline
The normalization process has moved in deliberate stages, not a single reset:
- October 2024 — Kazan, Russia: Modi and Xi meet on the sidelines of the BRICS summit, the first formal meeting since 2019, following a border disengagement agreement, according to The Diplomat.
- 2025 — Resumption of high-level visits: India’s defense and external affairs ministers visited Beijing; China’s Foreign Minister Wang Yi visited New Delhi, producing several bilateral agreements, per The Diplomat.
- August 2025 — Tianjin SCO Summit: Modi and Xi met again, described as the culmination of the resumed high-level engagement.
- May 2025 — India-Pakistan conflict stress test: The thaw survived Beijing providing military and political support to Islamabad against India during a brief conflict — evidence the normalization is now resilient to shocks, per The Diplomat.
- September 12–13, 2026 — New Delhi BRICS Summit: India chairs BRICS for a fourth time, hosting Xi for the first time since 2019, per Indian Defence News.
Why Now: The Strategic Logic on Both Sides
For Beijing, sustaining a frozen conflict with a rising economic power while simultaneously managing friction with Washington over the South China Sea and Taiwan Strait has become strategically costly, per Indian Defence News. For New Delhi, hosting Xi under the multilateral BRICS umbrella allows Modi to project global statesmanship while engaging Beijing without appearing to unilaterally concede on unresolved border issues.
Crucially, analysts at the China-Global South Project note the 2026 dynamic is being shaped primarily by regional realities and a deliberate decoupling of economic cooperation from security disputes — not by U.S. trade pressure, even though Trump-era tariff policy has often been cited as a contributing factor.
Where the Economic Exposure Sits
Import Dependency: India’s Structural Vulnerability
India’s supply chains remain heavily dependent on Chinese intermediate goods, particularly in pharmaceuticals and electronics, according to Indian Defence News. Any further normalization of technology-investment restrictions — India banned a range of Chinese tech applications and tightened border-nation investment rules after Galwan — would be the single highest-impact policy shift for enterprise B2B supply chain planners in the region.
The BRICS Bloc Itself: Expanded and More Consequential
The 2026 summit occurs against a materially expanded BRICS bloc. Since the original five-member group, Egypt, Ethiopia, Iran, Saudi Arabia, and the UAE joined in 2024, and Indonesia joined in 2025, per the official BRICS 2026 site — with ten additional partner countries (Belarus, Bolivia, Cuba, Kazakhstan, Malaysia, Nigeria, Thailand, Uganda, Uzbekistan, Vietnam) joining in 2025. The bloc’s prior Rio summit produced a Leaders’ Framework Declaration proposing to mobilize $300 billion annually by 2035 for climate finance, according to Business Standard.
Trade & Investment Exposure Matrix
| Sector | Pre-Thaw Position (2020–2024) | Post-Thaw Trajectory (2025–2026) | Enterprise Risk/Opportunity |
|---|---|---|---|
| Pharmaceuticals (API imports) | Heavy Indian dependency on Chinese active pharmaceutical ingredients | Potential easing of investment friction | Opportunity: supply diversification talks; Risk: continued single-source dependency |
| Electronics/consumer tech | Chinese app bans, investment screening for border-sharing nations | Selective, cautious relaxation possible | Watch for FDI rule changes ahead of/after the summit |
| Border trade | Suspended since 2020 | Partial resumption of trade at three border outposts | Direct logistics opportunity for regional trade B2B services |
| Africa infrastructure/capital | Parallel, competing Chinese BRI and Indian maritime/digital investment | Continued competition, not cooperation | Africa remains contested capital-deployment theatre, per Indian Defence News |
| AI governance | No joint framework | BRICS Leaders’ Statement on Global AI Governance (Rio) | Multilateral framework emphasizing Global South inclusion, UN-led process |
Sources: Indian Defence News, The Diplomat, Business Standard — see citations above.
What to Watch at the September Summit
- Border trade mechanics: Whether the Working Mechanism for Consultation and Coordination produces concrete friction-point resolutions in eastern Ladakh ahead of the summit, per Indian Defence News.
- Investment-screening rule changes: Any signal India will ease its border-nation FDI restrictions would be the most direct enterprise-relevant outcome.
- Africa positioning: Whether joint statements address, rather than paper over, competing Chinese BRI and Indian maritime-security/digital-investment strategies across the continent.
- AI governance follow-through: Concrete mechanisms building on the Rio AI governance statement, relevant to any enterprise operating AI infrastructure across BRICS-aligned markets.
The Caveat: This Is a Thaw, Not a Resolution
Independent policy analysis from the ISAS Brief is explicit that the Kazan-era thaw has not resolved bilateral mistrust or delivered progress on sensitive issues — it has stabilized the border and eased some economic restrictions without addressing the underlying territorial dispute. The China-Global South Project similarly notes India continues to treat Beijing with caution in the security domain even as it normalizes economic engagement. Investors should read the September summit as confirmation of a durable, deliberate de-escalation track — not as a signal that structural India-China rivalry has been resolved.
The Bottom Line
The India-China thaw formalized at the New Delhi BRICS Summit represents a genuine, multi-year, deliberately sequenced de-politicization of economic relations between two of the world’s largest economies — but one that leaves core security and territorial disputes unresolved. For enterprise and investment strategists, the actionable signal is narrower than “US-China rapprochement” headlines suggest: watch FDI screening rules, pharmaceutical/electronics supply-chain diversification announcements, and border-trade resumption specifics, not broad geopolitical sentiment.
Discover more from The Economy
Subscribe to get the latest posts sent to your email.
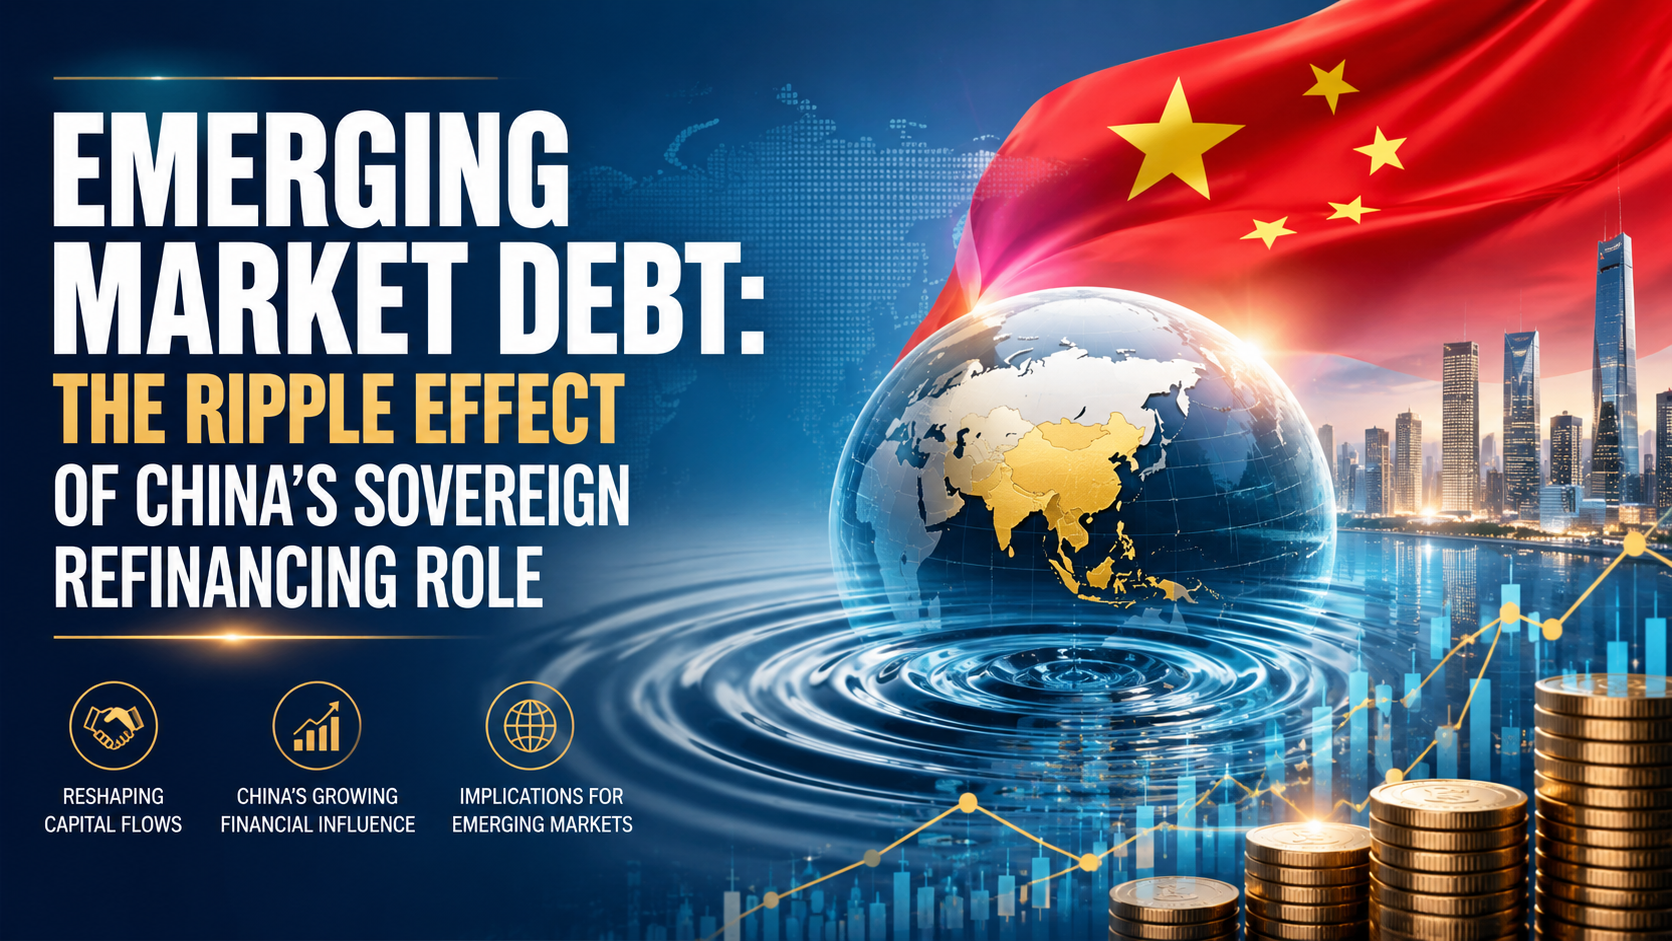
Emerging and developing economies face refinancing needs of more than $9 trillion in 2026, according to the Institute of International Finance’s Global Debt Monitor — the largest wall of maturing sovereign and corporate debt these markets have ever faced simultaneously. At the center of that system sits China, now the single largest issuer of emerging-market sovereign debt and, increasingly, the largest bilateral lender of last resort when smaller economies can’t refinance on their own. For institutional investors and foreign-policy-adjacent business strategists, understanding China’s dual role — dominant issuer and dominant creditor — is now a prerequisite for pricing emerging-market risk correctly.
Editorial note on sourcing: a specific figure describing a discrete “$1.3 billion” China sovereign refinancing transaction could not be independently verified against primary reporting at the time of writing. This article instead builds its analysis on verified, dated figures from the OECD, IIF, Moody’s, and peer-reviewed research, and any deal-level claim should be confirmed against primary sources (finance ministry statements, rating-agency releases) before publication or citation.
China’s Dual Role: Issuer and Creditor of Last Resort
China accounted for 45% of total EMDE sovereign bond issuance in 2024, up sharply from just 17% in the 2007–2014 period, according to the OECD’s Global Debt Report 2025. By 2025, China remained the top borrower among a concentrated group — China, India, Brazil, Egypt, and Argentina together represented 78% of EMDE central-government borrowing, per the OECD’s Global Debt Report 2026.
Domestically, Beijing has simultaneously executed one of the largest local-government debt refinancing programs in history: a 6 trillion yuan (roughly $839 billion) swap of “hidden” local-government debt into standardized bonds, approved in late 2024 and implemented through 2026, according to VOA News. By mid-2026, Chinese provinces had used nearly 94% of that swap allowance, according to Bloomberg.
Internationally, China has also re-entered dollar sovereign bond markets at scale — its 2026 international offering was reported as its largest ever, oversubscribed well beyond target, according to Business Standard/Reuters reporting on the prior comparable issuance. This dual positioning — massive domestic refinancing plus expanding international issuance — gives China outsized influence over EM bond-market liquidity and pricing benchmarks that smaller sovereigns then reference for their own issuance.
The $9 Trillion Wall: Why 2026 Is Different
The scale of what’s coming due matters more than any single deal. Key figures from the IIF’s Global Debt Monitor and OECD’s 2026 report:
- Gross EMDE central-government borrowing crossed $4 trillion in 2025, up from roughly $3 trillion in 2024.
- Around 36% of outstanding EMDE bond stock matures within three years.
- Low-income countries face the sharpest cliff: 52% of their outstanding bonds mature by 2028, with 29% due by the end of 2026 alone.
- Secondary-market yields on maturing debt now exceed 10% for non-investment-grade sovereigns, meaning refinancing at current rates locks in materially higher debt-service costs than the original issuance.
Refinancing Cost Comparison: Then vs. Now
| Issuer Tier | Original Issuance Yield (illustrative range) | 2026 Refinancing Yield | Refinancing Risk |
|---|---|---|---|
| Investment-grade EMDEs (e.g., select Gulf, Southeast Asia sovereigns) | 3–5% | 5–7% | Moderate — absorbable within fiscal space |
| Non-investment-grade EMDEs | 6–8% | 10%+ | High — debt-service costs rising faster than revenue growth |
| Low-income issuers (heavy China bilateral exposure) | Concessional/below-market | Market-rate or restructured terms | Severe — 29% of debt stock matures by end of 2026 |
Source: OECD Global Debt Report 2025/2026 (see citations above); ranges are illustrative of documented tier-level trends, not specific bond issues.
The Restructuring Precedent: What Happens When Refinancing Fails
China’s response to sovereign distress has evolved into a distinct pattern that investors increasingly price into risk premiums. Research published via the National Bureau of Economic Research documents a rising trend of “re-structurings” — repeated restructurings of the same debt with the same creditor — echoing the drawn-out resolution patterns of prior global debt crises. Angola, Ecuador, Seychelles, Sri Lanka, and Venezuela have each undergone two or more restructurings with Chinese state creditors.
Sri Lanka’s case is illustrative of the mechanics: China Development Bank extended a $500 million financing facility in 2020, and a subsequent equity-linked arrangement brought in $1.12 billion in cash that Colombo used to repay non-Chinese creditors, according to Oxford Academic’s International Affairs journal. These bilateral bridge arrangements illustrate how China’s rescue lending functions as a parallel track to traditional Paris Club-style restructuring — often faster to arrange, but less transparent to third-party bondholders pricing the same sovereign’s risk.
Regional Ripple Effects: Where Investors Should Watch Closely
Direct Exposure Zones
- Sub-Saharan Africa: Heaviest concentration of low-income issuers facing near-term maturity walls and prior China restructuring history (Angola, Zambia).
- South Asia: Sri Lanka’s precedent shapes how markets price Pakistan and Bangladesh refinancing risk.
- Latin America: Ecuador and Venezuela carry documented repeat-restructuring histories; Argentina remains among the top-five EMDE borrowers by volume.
Indirect / Second-Order Exposure
- Gulf and Southeast Asian investment-grade sovereigns face rising benchmark yields even without direct restructuring risk, simply because China’s issuance volume moves the EM bond-pricing benchmark broadly.
- Enterprise B2B lenders and trade-finance providers operating in these corridors should treat sovereign-refinancing stress as a leading indicator of counterparty and currency risk, not a lagging one.
An Investor Risk-Monitoring Framework
- Track maturity-wall concentration, not headline debt-to-GDP. A country with moderate debt-to-GDP but a heavy 2026–2028 maturity cliff carries more near-term risk than a higher-leverage country with a smoothed maturity profile.
- Distinguish China’s domestic refinancing (yuan-denominated, largely contained) from its role as an external EM creditor (dollar/foreign-currency exposure, higher spillover risk).
- Watch for repeat-restructuring signals. Countries with a prior China restructuring are statistically more likely to require another, per the NBER research above — treat this as a standing risk flag, not a one-time resolved event.
- Monitor secondary-market yield spreads on maturing debt versus issuance-year yields as the clearest real-time signal of refinancing stress building in a specific sovereign.
The Bottom Line
China’s simultaneous role as the largest domestic debt-refinancer in EM history and the most influential external creditor to distressed sovereigns makes it the single most important variable in the 2026 emerging-market debt outlook. The $9 trillion refinancing wall isn’t a uniform risk — it’s concentrated in low-income issuers with the heaviest prior China bilateral exposure, and that concentration is exactly where enterprise investors, trade-finance providers, and sovereign-risk analysts should be focusing due diligence through the remainder of 2026.
Discover more from The Economy
Subscribe to get the latest posts sent to your email.

Key Takeaways
- Major US banks generated $47 billion in profits in early 2026 while cutting roughly 15,000 positions tied to AI-driven restructuring — a genuine profit-and-disruption paradox playing out simultaneously.
- Academic research finds AI-adopting banks experience measurably lower default risk, credit risk, and systematic risk versus non-adopters — a causal, not merely correlational, risk-reduction effect.
- Generative AI could contribute $200-340 billion annually to global bank profits through productivity gains and automation, with Morgan Stanley citing a $740 billion 2026 AI capex wave as a direct tailwind for bank financing revenue.
- AI incidents carry a measurable market cost: a study of five US banks found an average short-term cumulative abnormal stock return loss of -21% following AI incidents, with negative spillover to the broader financial sector.
- Real-time credit exposure monitoring is emerging as AI’s most consequential risk-management application — recalculating counterparty exposure continuously as transactions execute, rather than discovering limit breaches the next morning.
A Genuine Paradox: Record Profits, Real Disruption
The defining tension in banking’s 2026 AI story is that efficiency gains and workforce disruption are happening at the same institutions, in the same reporting period, without contradiction. The 21,490 AI-related layoffs recorded in April 2026 and the $47 billion in profits generated by major banks while cutting 15,000 positions represent just the opening chapter of a restructuring that will reshape the industry over the coming decade — a transformation creating both risks and opportunities for investors simultaneously. JPMorgan Chase has emerged as the clearest example of how major financial institutions are restructuring entire organisations around AI capabilities rather than simply layering AI tools onto existing operations.
That reskilling gap is real and measurable at the industry level. The World Economic Forum reports that 77% of employers plan to reskill workers in response to AI disruption, yet only 57% report having created genuine reskilling pathways in practice — a gap between stated intention and operational execution that creates both human and financial-stability risk.
The Evidence: AI Adoption Causally Reduces Bank Risk
Beyond the headline profit and disruption figures sits a more academically rigorous finding that deserves more attention than it typically receives: AI adoption appears to make banks genuinely safer, not just more efficient. Research strongly supports this: AI-adopting banks experience lower default risk, measured by lower probability of default; lower credit risk, with smaller non-performing loan ratios and loan-loss provisions; and lower systematic risk, indicating that AI-adopting banks’ equity values are less exposed to economy-wide shocks and cyclical downturns. These effects remain robust after controlling for bank size, profitability, leverage, governance, and ESG performance, with consistent evidence that AI adoption causally reduces risk rather than simply reflecting already-safer institutions.
Two mechanisms explain this effect: enhanced risk management, where AI enables real-time credit monitoring, early detection of loan deterioration, and automated compliance screening, improving portfolio quality and lowering default probabilities. This is the strongest empirical grounding available for the “AI as risk-management upgrade” thesis, as distinct from the more commonly cited “AI as cost-cutting tool” narrative.
Real-Time Risk: The Practical Application
The operational shift this enables is significant. AI enables risk assessment at the speed of the business: as transactions execute, credit exposure to counterparties is recalculated continuously, and limit breaches are detected in real time rather than discovered the next morning. For risk managers, that shift from batch-processed, next-day exposure reporting to continuous real-time monitoring represents a genuine structural upgrade in how counterparty risk is managed — not merely a faster version of the same process.
The Capital and Profit Case
The scale of capital flowing into this transition is substantial, and banks sit at the centre of financing it. With an expected $740 billion in AI capex in 2026, banks stand to benefit from rising financing demand, resilient M&A activity, and long-term efficiency gains — AI is poised to be a net positive for banks, with disruption risks considered manageable even as investors worry about job losses and macro impacts. AI is driving major efficiency gains for banks, potentially boosting productivity by 20% to 50% over the next five to ten years.
The productivity dividend estimate at the global level is similarly large: generative AI could contribute between $200 billion and $340 billion a year to global bank profits through productivity advances and automation, with banks introducing knowledge agents powered by large language models in 2026 that can extract rich insights from loan applications, financial statements, and customer communications at scale.
Comparative Table: AI’s Dual Effect on Bank Risk Profile
| Dimension | Risk-Reducing Effect | Risk-Increasing Effect |
|---|---|---|
| Credit risk | Lower non-performing loan ratios, better early detection | New model/hallucination risk in credit decisioning |
| Operational risk | Real-time exposure monitoring, automated compliance | Cascading agentic-AI errors across chained workflows |
| Market/systematic risk | Lower exposure to economy-wide shocks (per LSE research) | AI-incident-driven stock price shocks (-21% average CAR) |
| Fraud risk | AI-powered fraud detection catches anomalies faster | AI-enabled deepfake fraud up over 2,000% in three years |
| Capital allocation | $740bn AI capex driving bank financing revenue | Chicago Fed-flagged tail risk from AI-adjacent loan exposure |
Why It Matters: The New Tail Risks Nobody Priced In
The efficiency and risk-reduction case is genuine, but it is only half the picture — AI introduces categorically new failure modes that traditional bank risk frameworks were not built to handle. Because AI agents chain tools and call other agents, a single error can propagate quickly through banking workflows, with resulting failures cascading into transaction and payment errors, data privacy breaches, and technical failures that become operational disruptions — a mispriced trade, a duplicated payment, or a misrouted customer instruction can multiply across systems before a human reviewer sees the first alert. Generative models still produce confident but incorrect outputs, and in agentic systems, those outputs become instructions: a model that hallucinates a policy, a customer entitlement, or a calculation rule can trigger actions the bank never approved.
The market has already begun pricing this risk directly. Analysis of five US banks and financial services firms found the average short-term cumulative abnormal stock return loss following an AI incident was -21.04%, with the negative impact spreading to the broader financial industry within a three-day window — a measurable, quantified market penalty for AI-related operational failures.
A Systemic-Level Concern
Regulators are increasingly framing this as a financial-stability issue, not just an institution-level risk. IMF analysis suggests that extreme cyber-incident losses could trigger funding strains, raise solvency concerns, and disrupt broader markets, with advanced AI models dramatically reducing the time and cost needed to identify and exploit vulnerabilities — raising the likelihood of simultaneously discovering and targeting weaknesses in widely used systems, meaning cyber risk is increasingly about correlated failures that could disrupt financial intermediation, payments, and confidence at the systemic level.
Separately, the Federal Reserve Bank of Chicago has explicitly flagged banks’ exposure to the AI investment boom itself as a distinct tail risk: commercial loans underwritten by banking institutions have been one of the mechanisms fuelling the capital expenditure increase across the AI value chain, creating a possible AI-bubble tail risk — the risk of losses due to extremely rare events — through banks’ direct lending exposure to AI-adjacent borrowers.
The Governance Gap: Adoption Outpacing Control Frameworks
Nearly 80% of large financial institutions now use some form of AI in core decision-making processes, according to the Bank for International Settlements, yet deploying AI at scale using control frameworks designed for a pre-AI world introduces structural vulnerabilities that can translate into earnings volatility, regulatory exposure, and reputational damage, at times within a single business cycle. For financial analysts, the maturity of a bank’s AI control environment — revealed through disclosures, regulatory interactions, and operational outcomes — is becoming as telling a signal as capital discipline or risk culture.
Profitability outcomes from AI adoption also remain more mixed than the headline productivity estimates suggest: only 40% of respondents report increased profitability from AI, while 43% report no change — a reminder that the $200-340 billion global profit-uplift estimate represents a potential ceiling, not a guaranteed outcome, and depends heavily on execution quality.
What to Do Next
- Distinguish AI-driven risk reduction from AI-driven risk creation when assessing a bank’s AI strategy — both are simultaneously real, and the net effect depends on control-framework maturity, not adoption speed alone.
- Treat a bank’s AI governance disclosures as a genuine credit-quality signal, following the CFA Institute’s framing that AI control-environment maturity is becoming as informative as traditional capital and risk-culture metrics.
- Watch for AI-incident-driven equity volatility as a distinct, quantifiable risk category — the documented -21% average abnormal return following AI incidents is a material, not theoretical, market risk.
- Monitor bank lending exposure to AI-value-chain borrowers as a systemic tail-risk indicator, per the Chicago Fed’s direct warning about commercial loan exposure to AI capital expenditure.
- Prioritise real-time exposure monitoring adoption as the highest-value, most empirically supported AI risk-management application, given its direct link to measurably lower default and credit risk in academic research.
FAQ
Does AI actually make banks safer, or does it just make them more efficient?
Rigorous academic research finds both are true simultaneously: AI-adopting banks experience causally lower default risk, credit risk, and systematic risk, driven primarily by enhanced real-time risk management and early deterioration detection — this is a genuine risk-reduction effect, not just an efficiency gain.
What is the biggest new risk that AI introduces to bank risk management?
Agentic AI systems that chain tools and call other agents can propagate a single error rapidly through banking workflows, with hallucinated policies or entitlements becoming executed instructions — and the market has already priced this risk, with AI incidents at banks associated with an average -21% short-term stock return loss.
How much could AI add to global bank profits?
Generative AI could contribute between $200 billion and $340 billion a year to global bank profits through productivity advances and automation, though only about 40% of institutions currently report actually realising increased profitability from their AI investments.
Discover more from The Economy
Subscribe to get the latest posts sent to your email.

BRICS Summit 2026: Economic Implications of the India-China Diplomatic Thaw

Emerging Market Debt: The Ripple Effect of China’s Sovereign Refinancing Role

Dropping Oil & Surging Gold: Navigating Safe-Haven Investments in Q3

2026 AI Stock Frenzy: How to Position Your Portfolio

The AI Disruption in Financial Risk Management: Moving Beyond Record Banking Profits

The Rise of Green Aviation: Balancing High Fuel Prices with Sustainable Infrastructure

US-China Relations in Q3 2026: Trade Tariffs and Supply Chain Risks

Emerging Markets Rebound: Top Stock Strategies for the Gulf and South Asia

Tackling the 2026 Global Food Crisis: Policy Shifts and Market Speculation

Post-Quantum Encryption in Banking: The Next Frontier in Cybersecurity Investments

The Financial Cost of Sanctions: Afghanistan’s Economy 5 Years Under the Taliban

Supply Chain Fragmentation: 10 Trends Reshaping Global Trade This Year

The 2026 Aviation Boom: Investing in Airline Stocks as Passenger Traffic Surges

China’s 2026 Corporate Laws: Western Compliance Guide

China Politburo July 2026: Stimulus Signals Explained

Russia Fuel Shortages 2026: Inside a Cracking War Economy

Top 15 Financial Stocks for Investment in PSX

Pakistan Passed Its Third IMF Review

State Farm’s $5B Dividend 2026: Who Qualifies & Payout Dates

SpaceX Stock Lockup Expiration Explained: Why $123B in Shares Could Hit the Market

Pakistan IMF Program 2026: Inside the Push Toward an Interest-Free Economy

Andy Burnham, UK Gilts and Mortgages: July 2026 Explainer

Russia Oil Revenue 2026: How Sanctions on Rosneft and Lukoil Are Draining the War Chest

Pakistan’s 2026 Monsoon Floods Threaten Fragile Economic Recovery as Inflation Nears 9%

Russia Oil Revenue 2026: The Iran War Windfall and What a Hormuz Deal Means for Moscow

Gold Price 2026: Why Bullion Has Fallen 25% From Its January Record High

Canada US Trade War 2026: Inside Carney’s Push to Cut Ties With Trump’s Tariffs

Russia’s Budget Deficit Blew Past Its Full-Year Target in Three Months
-

 Markets & Finance8 months ago
Top 15 Stocks for Investment in 2026 in PSX: Your Complete Guide to Pakistan’s Best Investment Opportunities
-

 Analysis6 months ago
Johor’s Investment Boom: The Hidden Costs Behind Malaysia’s Most Ambitious Economic Surge
-

 Analysis6 months ago
Top 10 Stocks for Investment in PSX for Quick Returns in 2026
-

 Analysis7 months ago
Brazil’s Rare Earth Race: US, EU, and China Compete for Critical Minerals as Tensions Rise
-

 Banks7 months ago
Best Investments in Pakistan 2026: Top 10 Low-Price Shares and Long-Term Picks for the PSX
-

 Investment8 months ago
Top 10 Mutual Fund Managers in Pakistan for Investment in 2026: A Comprehensive Guide for Optimal Returns
-

 Global Economy8 months ago
15 Most Lucrative Sectors for Investment in Pakistan: A 2025 Data-Driven Analysis
-

 Global Economy8 months ago
Pakistan’s Export Goldmine: 10 Game-Changing Markets Where Pakistani Businesses Are Winning Big in 2025