
Banks
Pakistan’s Banking Powerhouses: Top 10 Banks by Assets, Operations, and Profitability in 2024-2025
Deep dive into Pakistan’s banking giants: comprehensive analysis of the top 10 banks by assets, profitability, and operations with latest 2024 data.
When Meezan Bank became the first bank in Pakistan to cross the Rs. 100 billion profit milestone in 2024, it signaled more than just a financial achievement. It marked a fundamental shift in Pakistan’s banking landscape, where Islamic finance, digital transformation, and unprecedented profitability are reshaping an industry that contributes over 50 trillion rupees to the nation’s economy.
Pakistan’s banking sector stands at a fascinating crossroads. Total banking sector assets surpassed Rs. 50 trillion by the end of 2024, yet the industry faces a constitutional mandate to eliminate interest-based banking by 2028. This confluence of record profits and regulatory transformation makes understanding Pakistan’s banking hierarchy more crucial than ever for investors, policymakers, and consumers navigating this 340-billion-dollar economy.
Key Takeaways
- Meezan Bank leads in profitability with Rs. 101.5 billion profit, becoming first Pakistani bank to cross Rs. 100 billion threshold
- HBL remains largest by assets at Rs. 6.1 trillion despite being fourth in profitability
- Banking sector collectively earned Rs. 600+ billion in 2024 profits while paying Rs. 650+ billion in taxes
- Islamic banking assets approached Rs. 10 trillion with constitutional mandate for complete transition by 2028
- Digital transactions now represent 84% of retail banking activity, up from 76% previous year
- State Bank of Pakistan reduced policy rates from 22% to 12%, pressuring bank margins
- Consolidation activity increased with multiple acquisition deals in progress
- Technology investment and cybersecurity emerged as critical competitive differentiators
- Financial inclusion expansion continues through digital wallets, branchless banking, and RAAST payment system
- Top banks maintain strong capital adequacy ratios well above regulatory minimums
Pakistan’s Banking Sector: A Market Overview
The Pakistani banking industry has evolved into a sophisticated financial ecosystem that serves as the backbone of the nation’s economic infrastructure. The banking industry accounts for up to 55% of GDP and about 74% of the assets in the financial industry, demonstrating its outsized role in national development.
As of 2024-2025, Pakistan operates 44 banks comprising local and foreign institutions, including commercial banks, Islamic banks, microfinance institutions, and development financial institutions. This diverse banking landscape serves a population of over 240 million people, with urban centers like Karachi, Lahore, and Islamabad driving significant banking activity.
The sector’s performance in 2024 exceeded expectations despite economic headwinds. Listed banks’ profits rose to Rs. 597 billion in 2024 despite higher taxes, while tax contributions surpassed Rs. 650 billion. This resilience stems from strategic positioning in government securities, particularly Sukuks, robust deposit mobilization, and accelerated digital transformation initiatives.
Regulatory Framework and Digital Innovation
The State Bank of Pakistan (SBP) serves as the central regulatory authority, maintaining monetary stability through statutory frameworks and supervisory oversight. In 2024, the SBP implemented several key regulatory measures addressing foreign exchange operations, SME financing, and cybersecurity, establishing new departments like the Financial Institutions Resolution Department to proactively manage systemic risks.
Digital transformation has emerged as a defining characteristic of Pakistan’s banking evolution. According to the State Bank of Pakistan, 84 percent of retail transactions in fiscal year 2023 to 2024 were digital, a sharp jump from 76 percent the year before. The launch of RAAST, Pakistan’s first instant payment system, has revolutionized real-time payments and accelerated financial inclusion across previously underserved populations.
The Islamic Banking Revolution
Perhaps the most significant development reshaping Pakistan’s banking sector is the accelerating momentum of Islamic finance. Islamic banking assets approached Rs. 10 trillion, with deposits exceeding Rs. 8 trillion, while the branch network expanded significantly, exceeding 4,500 branches. This growth trajectory intensified following the parliamentary approval of a constitutional amendment mandating complete elimination of interest-based banking by January 1, 2028.
Top 10 Banks in Pakistan: Comprehensive Rankings
Ranking Methodology
This analysis ranks Pakistan’s top 10 banks using three primary metrics: total assets (reflecting institutional scale and market presence), profitability (measured by profit after tax for 2024), and operational footprint (branch networks, digital platforms, and customer reach). Data sources include State Bank of Pakistan reports, Pakistan Stock Exchange filings, individual bank financial statements, and verified third-party financial analyses.
1. Meezan Bank Limited
Total Assets: Approaching Rs. 3 trillion
Profit After Tax (2024): Rs. 101.5 billion
Pre-Tax Profit: Rs. 222 billion
Tax Contribution: Rs. 121 billion
Branch Network: 815+ branches nationwide
Market Position: #1 in Profitability, Largest Islamic Bank
Meezan Bank has achieved what seemed impossible just years ago. Meezan Bank set an all-time record with a profit exceeding Rs. 100 billion in 2024, the highest ever in the country’s banking and corporate sectors, marking a remarkable 20% annual growth from Rs. 84.5 billion in 2023.
As Pakistan’s first and largest Islamic bank, Meezan Bank operates exclusively on Shariah-compliant principles since receiving its Islamic Commercial Banking license from the State Bank of Pakistan in 2002. The bank provides a wide range of Islamic banking products and services and has been recognized as the Best Islamic Bank in Pakistan by various local and international institutions.
Key Differentiators:
The bank’s earnings per share surged to Rs. 57 from Rs. 47 in 2023, with shareholders receiving a dividend of Rs. 28 per share. Meezan Bank’s strategic focus on Sukuk investments and private sector financing enabled it to navigate the high-interest-rate environment effectively while maintaining its ethical banking mandate.
“When Meezan Bank became the first in Pakistan to cross Rs. 100 billion in profit, it marked more than financial achievement—it signaled Islamic finance’s ascendancy in South Asia’s fifth-largest economy.”
With the 2028 deadline for complete elimination of interest-based banking approaching, Meezan Bank stands uniquely positioned. Its established infrastructure, customer trust in Islamic finance, and operational expertise in Shariah-compliant products provide significant competitive advantages as conventional banks scramble to transition their operations.
Digital Innovation: Meezan Bank has invested heavily in digital platforms, launching mobile banking applications and internet banking services that maintain Islamic banking principles while offering modern convenience. The bank’s technology infrastructure supports seamless transaction processing while ensuring Shariah compliance at every step.
2. United Bank Limited (UBL)
Total Assets: Rs. 2.8 trillion
Profit After Tax (2024): Rs. 75.7 billion
Pre-Tax Profit: Rs. 150 billion
Tax Contribution: Rs. 74.3 billion
Branch Network: 1,390+ branches across Pakistan, presence in 19+ countries
Market Position: #2 in Profitability, Major Private Sector Bank
United Bank Limited secured the second spot in 2024, with profits surging by 34%, reaching Rs. 75.7 billion, up from Rs. 56.4 billion the previous year. This impressive growth trajectory propelled UBL from fourth place in 2023 to second position in 2024, demonstrating exceptional strategic execution.
Founded in 1959, UBL represents one of Pakistan’s oldest and most established banking institutions. With total assets of Rs. 2.8 trillion, the bank serves approximately 4 million customers through an extensive domestic and international network.
Strategic Transformation:
UBL’s remarkable performance stems from aggressive digital transformation initiatives and a strategic pivot toward Islamic banking. The bank made significant strides in its transition to Islamic banking, converting its operations in Khyber Pakhtunkhwa and Balochistan, positioning itself ahead of the 2028 regulatory deadline.
The bank’s total income saw a remarkable 48.8% jump to Rs. 257 billion, largely driven by a 132% surge in non-markup income, which reached Rs. 83.7 billion. Earnings per share grew to Rs. 61 from Rs. 45, reflecting improved operational efficiency and revenue diversification.
Operational Excellence:
UBL dominated as the highest dividend-paying bank with an outstanding Rs. 44 payout, rewarding shareholders handsomely while maintaining robust capital adequacy ratios. The bank’s emphasis on technological infrastructure provides a strong foundation for continued growth and resilience.
With overseas presence in more than 19 countries and comprehensive product offerings spanning retail, corporate, and investment banking, UBL maintains a diversified revenue stream that cushions against market volatility.
3. MCB Bank Limited
Total Assets: Rs. 1.9 trillion
Profit After Tax (2024): Rs. 63.4 billion (Annual reports show Rs. 57.6 billion in some quarters)
Pre-Tax Profit: Rs. 118.4 billion
Tax Contribution: Over Rs. 60 billion
Branch Network: 1,400+ branches nationwide
Market Position: #3 in Profitability, Established 1947
MCB Bank, one of Pakistan’s oldest banking institutions established in 1947, maintains its position among the top three despite facing headwinds in 2024. MCB Bank slipped to third place in 2024, recording a profit of Rs. 57.6 billion, down from Rs. 59.8 billion the previous year.
The slight decline in profitability reflects the challenging operating environment characterized by policy rate fluctuations and increased operational costs. However, MCB’s pre-tax profit of Rs. 118.4 billion demonstrates strong core performance, with the tax burden significantly impacting net earnings.
Market Leadership:
Despite the profit decline, MCB Bank declared a dividend of Rs. 36 per share, maintaining its reputation for shareholder-friendly policies. The bank’s earnings per share stood at Rs. 48, down from Rs. 50 in the previous year, reflecting the compressed margins in a highly competitive environment.
MCB Bank operates through multiple business segments including Branch Banking, which serves retail, small business, and corporate clients with comprehensive banking services including loans, securities, and agricultural financing. The bank has been recognized with the prestigious Euromoney Award for Best Investment Bank in Pakistan for consecutive years.
Strategic Focus:
MCB Bank’s strategy revolves around customer-centricity, digital transformation, asset quality, and talent retention, leveraging technology and making strategic investments to ensure compliance, efficiency, and innovation-driven progress.
The bank’s vast branch network of over 1,400 locations across Pakistan ensures extensive market penetration, while its asset management services cater to sophisticated investors seeking professional wealth management solutions.
4. Habib Bank Limited (HBL)
Total Assets: Rs. 6.1 trillion
Profit After Tax (2024): Rs. 57.8 billion
Pre-Tax Profit: Rs. 120.3 billion
Tax Contribution: Rs. 62.5 billion
Branch Network: 1,751 branches, 2,007 ATMs, international presence
Market Position: #4 in Profitability, Largest Bank by Assets
HBL, the largest bank of Pakistan, declared a record profit before tax of PKR 120.3 billion for the year ended December 31, 2024, 6 percent higher than in 2023. However, the massive 54% tax rate on banks significantly impacted net earnings, resulting in profit after tax of Rs. 57.8 billion.
Founded in 1941, HBL represents Pakistan’s most extensive banking institution with total assets of Rs. 6.1 trillion and deposits of Rs. 4.4 trillion. HBL’s balance sheet grew by 9 percent to PKR 6.1 trillion, with total deposits growing by PKR 228 billion over December 2023.
Operational Scale:
HBL’s operational footprint dwarfs competitors, with 1,751 branches domestically and extensive international operations spanning Europe, Australia, the Middle East, America, Asia, and Africa. This global presence enables HBL to capture remittance flows and serve Pakistan’s diaspora effectively.
The bank’s Capital Adequacy Ratio improved from 16.0% in December 2023 to 17.7% in 2024, well above regulatory requirements, demonstrating financial resilience. The CASA (Current Account Savings Account) ratio reached nearly 90%, indicating strong low-cost deposit mobilization.
Recognition and Leadership:
Euromoney Awards for Excellence 2024 awarded HBL the accolades of ‘Pakistan’s Best Bank’, ‘Pakistan’s Best Bank for Corporates’, and ‘Pakistan’s Best Bank for ESG’. The Federation of Pakistan Chambers of Commerce and Industry honored HBL as the ‘Best Conventional Bank of the Year’.
Despite flat profit growth, HBL paid shareholders a dividend of Rs. 16.5 per share (Rs. 4.25 final dividend plus Rs. 12 interim dividends), maintaining its commitment to investor returns. The bank’s EPS for 2024 stood at Rs. 39.85, slightly higher than Rs. 39.32 in 2023.
Strategic Initiatives:
HBL has positioned itself as a thought leader in sustainable banking, actively supporting the State Bank of Pakistan and World Bank in developing the National Green Taxonomy. This forward-thinking approach has enabled the bank to identify green financing opportunities for climate change mitigation and adaptation, aligning profit with planetary health.
5. Standard Chartered Bank Pakistan Limited
Total Assets: Competitive positioning among top banks
Profit After Tax (2024): Rs. 46 billion
Pre-Tax Profit: Rs. 100 billion
Tax Contribution: Rs. 54 billion
Branch Network: Selective premium locations
Market Position: #5 in Profitability, International Banking Leader
Standard Chartered Bank reported its highest-ever profit of Rs. 46 billion, reflecting a 7.9 percent annual growth, improving its position from sixth to fifth among Pakistan’s most profitable banks. This remarkable performance demonstrates the effectiveness of the bank’s premium banking strategy and international connectivity.
As a subsidiary of the global Standard Chartered Group, the Pakistani operations benefit from world-class banking expertise, sophisticated risk management frameworks, and access to international capital markets. The bank’s earnings per share stood at Rs. 11.90, with shareholders receiving a dividend of Rs. 9 per share.
Strategic Positioning:
Standard Chartered Bank Pakistan focuses on serving corporate clients, multinationals, and high-net-worth individuals with specialized banking solutions. This selective approach generates higher margins than mass-market retail banking while maintaining manageable risk profiles.
The bank has announced aggressive plans for transitioning to Islamic banking, recognizing the regulatory imperative and market opportunity presented by the 2028 deadline for elimination of interest-based banking. This strategic pivot positions Standard Chartered to maintain its premium market position while complying with evolving regulations.
Digital Excellence:
Standard Chartered Bank Pakistan leverages its parent company’s global digital banking platforms, offering customers seamless international banking services, sophisticated treasury solutions, and cutting-edge trade finance products. The bank’s technology infrastructure supports complex cross-border transactions while maintaining regulatory compliance across multiple jurisdictions.
6. Allied Bank Limited (ABL)
Total Assets: Rs. 1.7 trillion
Profit After Tax (2024): Rs. 43 billion
Pre-Tax Profit: Rs. 87 billion
Tax Contribution: Rs. 44.8 billion
Branch Network: Extensive national coverage
Market Position: #6 in Profitability
Allied Bank Limited climbed to sixth place, reporting its highest-ever profit of Rs. 43 billion, with a share value of Rs. 37.5 and dividend distribution of Rs. 16 per share. This represents ABL’s strongest financial performance, reflecting successful execution of growth strategies and operational improvements.
Founded in 1942, Allied Bank brings over eight decades of banking experience to Pakistan’s financial landscape. With total assets of Rs. 1.7 trillion, the bank serves diverse customer segments through comprehensive product offerings.
Customer-Centric Innovation:
Allied Bank is committed to deepening relationships with existing customers by offering an extensive suite of financial products, including credit cards, personal finance, car finance, home finance, solar system finance, scooty finance, and electric bike finance. These tailored solutions address Pakistan’s evolving financial needs, from traditional banking to sustainable energy financing.
A game-changer in ABL’s customer service strategy is the introduction of the Intelligent Virtual Assistant (IVA), powered by advanced AI technology. This 24/7 support system provides seamless, human-like interactions for inquiries, requests, and complaint resolutions, enhancing customer satisfaction while reducing operational costs.
Growth Trajectory:
Allied Bank’s consistent profit growth and strong operational strategies highlight its ability to navigate Pakistan’s complex banking environment. The bank’s focus on technology adoption, product innovation, and customer experience positions it well for continued expansion in an increasingly competitive market.
7. Bank Al Habib Limited
Total Assets: Competitive market positioning
Profit After Tax (2024): Rs. 39 billion
Pre-Tax Profit: Rs. 83.8 billion
Tax Contribution: Rs. 43.9 billion
Branch Network: National presence
Market Position: #7 in Profitability
Bank Al Habib jumped to seventh place, recording 12% profit growth to Rs. 39 billion in 2024. This upward trajectory reflects the bank’s successful market positioning and effective execution of business strategies in a challenging economic environment.
The bank’s improved performance demonstrates resilience and adaptability, with management successfully navigating policy rate fluctuations and competitive pressures. Bank Al Habib’s focus on service quality and customer relationships has enabled consistent market share gains.
Operational Strategy:
Bank Al Habib maintains a balanced approach between retail and corporate banking, serving individual consumers while cultivating relationships with businesses across various sectors. This diversification provides revenue stability and reduces concentration risk.
The bank has invested in branch infrastructure and digital platforms simultaneously, recognizing that Pakistan’s banking customers expect both physical presence and online convenience. This omnichannel strategy has proven effective in attracting and retaining customers across demographic segments.
8. Bank Alfalah Limited
Total Assets: Over Rs. 2 trillion
Profit After Tax (2024): Rs. 38.3 billion
Pre-Tax Profit: Rs. 83 billion
Tax Contribution: Rs. 44.7 billion
Branch Network: 890+ branches in 200+ cities, international operations
Market Position: #8 in Profitability
Bank Alfalah reported its highest-ever profit of Rs. 38.3 billion in 2024, marking a 5% growth from the previous year. The bank’s share value increased from Rs. 23.1 to Rs. 24.3, with a dividend payout of Rs. 8.5 per share to shareholders.
Bank Alfalah’s journey from Habib Credit and Exchange Bank to becoming one of Pakistan’s largest private banks demonstrates remarkable institutional transformation. The bank has crossed significant milestones of 1,000 branches and Rs. 2 trillion in deposits, improving its industry ranking in terms of deposit base, total assets, and branch footprint.
Expansion Strategy:
Bank Alfalah is Pakistan’s fourth largest lender by assets and is owned by UAE-headquartered Abu Dhabi Group, having seen the second fastest deposit growth in the past five years among Pakistani banks. This aggressive growth trajectory stems from strategic acquisitions, organic expansion, and market share gains.
The bank is actively pursuing acquisition opportunities, including reaching final stages of agreement to acquire Saudi National Bank’s majority stake in Samba Bank. This growth-through-acquisition strategy enables rapid scale expansion while absorbing existing customer bases and branch networks.
Digital Leadership:
In 2018, Bank Alfalah launched its digital banking group, setting industry standards with its Alfa app, which brings together unprecedented services and features in one platform. In 2023, the bank opened Pakistan’s first ‘Digital Lifestyle’ branch, combining physical presence with cutting-edge digital experiences.
Bank Alfalah received awards including ‘Best Digital Banking’ by Pakistan Banks Association and recognition as one of the ‘Top 25 Companies’ by Pakistan Stock Exchange, validating its innovation-focused strategy.
9. National Bank of Pakistan (NBP)
Total Assets: Rs. 3.9 trillion
Profit After Tax (2024): Rs. 26.8 billion
Pre-Tax Profit: Rs. 56.6 billion
Tax Contribution: Rs. 29.8 billion
Branch Network: 1,450+ branches nationwide, 21 branches internationally
Market Position: Largest State-Owned Bank
National Bank of Pakistan saw a significant decline in profitability in 2024, dropping from fifth to ninth place, with profits falling to Rs. 26.8 billion, down from Rs. 56.8 billion in 2023. This 50% decline represents the most dramatic profitability shift among Pakistan’s major banks.
Founded in 1949, NBP serves as the largest state-owned financial institution in Pakistan, playing a crucial role as trustee of public funds and agent to the State Bank of Pakistan. With total assets of Rs. 3.9 trillion, NBP ranks among Pakistan’s largest banks by balance sheet size.
Challenges and Restructuring:
NBP’s one-time pension expense of Rs. 57 billion in Q4 2024 significantly impacted profitability, explaining much of the dramatic year-over-year decline. This extraordinary charge masked underlying operational performance, though challenges remain in improving efficiency and reducing costs.
The bank’s earnings per share decreased to Rs. 12 from Rs. 24 in the previous year, reflecting the compressed profitability. However, NBP paid a cash dividend of Rs. 8 per share in 2024, marking its first cash payout since 2016, signaling management’s confidence in future performance.
Market Role:
NBP plays a unique role in Pakistan’s financial ecosystem, serving both public and private sectors while supporting government initiatives in agricultural financing, small business development, and financial inclusion. The bank’s extensive branch network reaches remote areas where private banks rarely operate, providing essential banking services to underserved populations.
With over 12,000 employees and 1,450 branches spread across Pakistan plus 21 international branches, NBP maintains unparalleled market penetration. The bank has developed consumer products to enhance marketing effectiveness and engage with diverse societal segments through cultural activities.
10. Habib Metro Bank
Total Assets: Competitive market positioning
Profit After Tax (2024): Rs. 24.6 billion
Pre-Tax Profit: Rs. 56.7 billion
Tax Contribution: Rs. 27.9 billion
Branch Network: National presence
Market Position: #10 in Profitability
Habib Metro Bank maintained its position among the top 10 profitable banks, reporting a profit of Rs. 24.6 billion, showing flat profit growth compared to the previous year. This stability amid market volatility demonstrates the bank’s operational resilience and effective risk management.
Habib Metro Bank’s share value stood at Rs. 23, with the bank paying a dividend of Rs. 12 per share to shareholders. The consistent performance reflects solid fundamentals and prudent management of the changing interest rate environment.
Competitive Positioning:
While lacking the dramatic growth stories of peers, Habib Metro Bank’s steady performance appeals to risk-averse investors seeking predictable returns. The bank maintains conservative lending practices and focuses on quality over quantity in customer acquisition.
The bank’s ability to maintain profitability despite intense competition and regulatory pressures demonstrates effective cost management and revenue optimization. Habib Metro Bank serves as a reliable mid-tier banking option for customers seeking personalized service and local market expertise.
Sector Analysis: Key Trends and Patterns
Record Profitability Amid High Taxation
In 2024, Pakistani banks collectively earned over Rs. 600 billion in profit after tax, representing the sector’s strongest performance ever. However, this came at a cost, with the government extracting over Rs. 650 billion in tax revenues from banks, resulting in an effective tax rate exceeding 50% for many institutions.
The profitability surge stemmed primarily from high interest rates that prevailed through most of 2024, enabling banks to earn substantial spreads between lending rates and deposit costs. Government issuance of Sukuks (Islamic bonds) provided lucrative investment opportunities, particularly for Islamic banks, while private sector lending grew modestly.
Digital Transformation Acceleration
The COVID-19 pandemic catalyzed digital adoption that continues accelerating in 2024-2025. Mobile banking transactions have increased over 150% in volume and nearly 200% in value compared to pre-pandemic levels. Digital wallets like JazzCash and Easypaisa have become mainstream payment methods, with JazzCash alone processing over 10.7 trillion rupees in transactions.
Traditional banks have responded by launching sophisticated mobile applications, internet banking platforms, and AI-powered customer service tools. The competitive pressure from fintech companies has forced established banks to innovate rapidly or risk losing market share to nimbler competitors.
Islamic Banking Ascendancy
The parliamentary approval of constitutional amendments mandating complete elimination of interest-based banking by 2028 has fundamentally altered strategic planning across Pakistan’s banking sector. Banks with established Islamic banking operations enjoy significant advantages, while conventional-only banks scramble to build Shariah-compliant infrastructure.
Islamic banking assets approached Rs. 10 trillion, with deposits exceeding Rs. 8 trillion, while the branch network expanded significantly, exceeding 4,500 branches. This rapid growth trajectory positions Islamic finance as Pakistan’s banking future rather than a niche market segment.
Consolidation and Acquisition Activity
The banking sector witnessed increased merger and acquisition activity in 2024, with Bank Alfalah pursuing Samba Bank acquisition and multiple foreign banks divesting Pakistani operations. This consolidation trend likely continues as smaller banks struggle to compete against larger, technology-enabled competitors with deeper capital bases.
Regulatory pressure for higher capital adequacy ratios and investments in cybersecurity infrastructure create barriers to entry and operating challenges for smaller institutions. Expect further consolidation as the sector matures and efficiency pressures intensify.
Cybersecurity Challenges
A high-profile cyberattack on Meezan Bank that compromised customer data highlighted growing cybersecurity risks facing Pakistani banks. The State Bank of Pakistan responded by establishing a dedicated Cyber Risk Management Department to strengthen oversight and provide guidance to financial institutions.
As digital transactions proliferate and customers conduct more banking activities online, cybersecurity emerges as a critical competitive differentiator. Banks investing in robust security frameworks, continuous monitoring, and incident response capabilities will earn customer trust and regulatory approval.
The Road Ahead: Banking Sector Outlook 2025-2027
Interest Rate Normalization
The State Bank of Pakistan reduced the policy rate from a peak of 22% to 12% by late 2024, with further cuts expected in 2025. This normalization will compress bank margins, forcing institutions to focus on fee-based income, operational efficiency, and loan volume growth rather than high interest spreads.
Banks with diversified revenue streams, strong deposit franchises, and efficient operations will navigate this transition successfully. Those overly dependent on interest income face margin compression and profitability challenges.
Islamic Banking Transition
The 2028 deadline for complete Islamic banking conversion creates both challenges and opportunities. Banks like Meezan, UBL, and those with strong Islamic banking divisions gain competitive advantages. Conventional banks face massive technology investments, staff retraining, and customer migration challenges.
Expect accelerated product innovation in Islamic finance, with banks developing sophisticated Shariah-compliant solutions for corporate banking, trade finance, and wealth management. The transition represents the most significant structural change in Pakistani banking since nationalization in the 1970s.
Financial Inclusion Expansion
Despite progress, Pakistan’s financial inclusion remains limited, with significant populations in rural areas and low-income segments lacking access to formal banking services. Digital banking, branchless banking models, and microfinance initiatives continue expanding reach.
The RAAST instant payment system’s success demonstrates technology’s potential to bridge financial inclusion gaps. Banks partnering with fintech companies, mobile network operators, and retail chains can tap underserved markets while fulfilling regulatory expectations for inclusive growth.
Technology Investment Imperatives
Artificial intelligence, machine learning, and data analytics are transforming banking operations from customer service to credit underwriting. Banks investing in these technologies improve efficiency, enhance customer experiences, and make better risk decisions.
Cloud computing enables smaller banks to access enterprise-grade technology without massive infrastructure investments. API banking facilitates ecosystem partnerships, allowing banks to embed their services in non-banking platforms and applications.
Regional Economic Integration
Pakistan’s strategic location between China, India, and the Middle East presents opportunities for banks to facilitate cross-border trade, investment flows, and remittances. The China-Pakistan Economic Corridor (CPEC) continues generating banking opportunities in project finance, trade finance, and infrastructure development.
Banks with international networks and correspondent banking relationships can capitalize on Pakistan’s position as a regional trade hub, particularly as economic conditions stabilize and investor confidence returns.
Conclusion: Navigating Pakistan’s Banking Renaissance
Pakistan’s banking sector in 2024-2025 presents a fascinating study in transformation and resilience. Record profits of over Rs. 600 billion demonstrate the industry’s financial strength, while the mandatory transition to Islamic banking by 2028 ensures continuous evolution. Digital transformation accelerates at unprecedented pace, with 84% of retail transactions now conducted digitally.
The top 10 banks profiled here represent diverse institutional models—from Meezan Bank’s pure Islamic banking leadership to HBL’s global reach and asset scale, from UBL’s remarkable turnaround to NBP’s state-owned market penetration. Each institution brings unique strengths while facing common challenges of regulatory compliance, technological investment, and competitive differentiation.
For investors, Pakistan’s banking sector offers compelling opportunities tempered by execution risks. Banks with strong Islamic banking franchises, robust digital platforms, and efficient operations appear best positioned for the transition ahead. The sector’s contribution to national economic development, representing over 55% of GDP and 74% of financial sector assets, ensures continued policy support despite high taxation.
For policymakers, balancing financial sector stability with transformation imperatives requires careful calibration. The 2028 Islamic banking deadline approaches rapidly, necessitating clear regulatory guidance, implementation support, and monitoring frameworks to ensure orderly transition without disrupting credit availability or payment systems.
For consumers and businesses, Pakistan’s evolving banking landscape promises improved services, greater accessibility, and more choices. Digital banking reduces transaction costs and increases convenience, while Islamic banking provides Shariah-compliant alternatives aligned with religious preferences. Competition drives innovation, ultimately benefiting end users through better products and services.
The banking sector that emerges from this transformation period will look dramatically different from today’s landscape. Islamic finance principles will dominate, digital channels will handle the vast majority of transactions, and technology-enabled efficiency will replace labor-intensive processes. The banks profiled here are navigating this transition with varying degrees of success, but all recognize that standing still means falling behind.
Pakistan’s banking renaissance is well underway. The institutions that embrace change, invest in technology and talent, and maintain customer focus will thrive in the new landscape. Those clinging to legacy models and traditional approaches risk obsolescence. For a sector this vital to national economic health, the stakes couldn’t be higher.
About the Author:
A senior financial journalist and digital economy expert with over 15 years of experience covering South Asian markets, banking sector transformation, and fintech innovation for leading international publications.
- Sources:
State Bank of Pakistan Annual Reports and Quarterly Statements, - Pakistan Stock Exchange Filings,
- Individual Bank Annual Reports 2024,
- KPMG Pakistan Banking Perspective 2024-2025,
- Pakistan Bureau of Statistics, International Monetary Fund Pakistan Country Reports,
- World Bank Pakistan Economic Updates,
- Bloomberg Terminal Data,
- Reuters Financial Services.
Discover more from The Economy
Subscribe to get the latest posts sent to your email.


Analysis
Iran War Singapore Growth & Inflation 2026: Gan’s Warning Explained | A Wake-Up Call for Asia
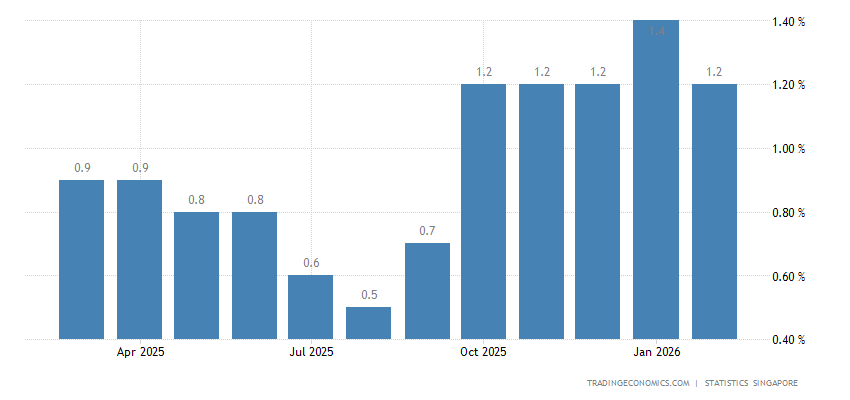
DPM Gan Kim Yong told Parliament on April 7, 2026 that the Iran war will hurt Singapore’s GDP and push inflation higher. Here’s what it means for Asia’s open economies — and why the forecast revision coming in May could be the most consequential in a decade.
Singapore’s Moment of Reckoning Has Arrived
The chamber was unusually charged for a Tuesday afternoon. More than seventy parliamentary questions had been filed — a volume that, by Singapore’s meticulous standards, signals genuine institutional alarm. When Deputy Prime Minister and Minister for Trade and Industry Gan Kim Yong rose to address Parliament on April 7, 2026, the words he delivered were neither catastrophist nor comforting. They were something more unsettling than both: calibrated, honest, and unmistakably ominous. “As a small and highly open economy,” he said, “Singapore will not be able to insulate ourselves completely from this crisis. Growth in the coming quarters is likely to be affected by the ongoing conflict.”
Outside on Shenton Way, the morning’s trading boards told a parallel story — the Straits Times Index down, freight quotes climbing, electricity tariffs that had already been revised upward on April 1 now looking like a floor rather than a ceiling. For Singapore, a city-state with no hinterland, no domestic energy base, and no insulation from the global price of anything, the Iran war is not a distant geopolitical abstraction. It is an arriving economic storm, and Gan’s parliamentary statement was the clearest official admission yet that the government’s own forecasts — upgraded as recently as February to a bullish 2% to 4% GDP growth for 2026 — will need to be revisited.
This is the story of why that revision matters, and what it reveals about the structural vulnerabilities of every small, trade-dependent economy in a world increasingly shaped by great-power conflict.
Not Ukraine Redux: Why This Shock Is Different in Kind
Experienced market watchers were quick to reach for the 2022 Russia-Ukraine playbook when the US-Israeli strikes on Iran began on February 28, 2026. That instinct is understandable but analytically dangerous. The Ukraine episode was primarily a European energy shock — devastating for the continent’s natural gas grid, but geographically contained in ways that allowed Asian economies to pivot rapidly toward alternative suppliers and routes. The Iran war is something structurally different, and more globally corrosive.
The Strait of Hormuz, through which approximately 20% of the world’s traded oil passes alongside vast volumes of liquefied natural gas, does not have a European bypass. The closure of the strait triggered by the conflict has disrupted roughly a fifth of global oil supply, sending Brent crude surging to over US$82 per barrel — a 30% increase since the start of 2026 and the highest level since January 2025. Unlike the Suez Canal, for which alternative routing around the Cape of Good Hope is slow and costly but physically possible, the Hormuz chokepoint forces rerouting that simply cannot be accomplished at comparable volumes or speed.
More critically, the war’s cascading effects are not bounded by energy markets. Analysts have described the economic impact as the world’s largest supply disruption since the 1970s energy crisis, encompassing surges in oil and gas prices, wide disruptions in aviation and tourism, and volatility in financial markets. That characterisation — the 1970s benchmark — is one that Singapore’s older policymakers understand viscerally. The 1973 oil embargo reshaped the city-state’s energy strategy for a generation. What is unfolding in 2026 is arriving with far greater interconnectedness and far less margin for response.
The Four Channels: How the Iran War Hits Singapore’s Economy
Energy and Chemicals: The First and Loudest Channel
Singapore is one of Asia’s pre-eminent refining and petrochemicals hubs. Its Jurong Island complex processes millions of barrels of crude annually, supplying refined products and chemical feedstocks across the region. When global crude prices surge and Gulf supply contracts abruptly, the feedstock economics of that entire industrial ecosystem are upended. Parliamentary questions filed for the April 7 sitting explicitly asked whether Singapore’s petrochemical and refining sectors face risks to output, margins and competitiveness given the republic’s role as a regional energy and chemicals hub.
Gan confirmed that the spike in global oil and natural gas prices will inevitably raise fuel and electricity costs for Singapore, and that cost increases will “feed through to broader inflation.” He went further, calling the supply disruption from the Hormuz closure “the worst disruption since the 1973 oil embargo” — language that carries particular weight from a minister known for understatement.
Electricity tariffs were already revised upward from April 1. Singaporean authorities have warned of sharper increases to come, with cooking gas prices also rising, though some providers said they may absorb costs for hawker centres. For industrial consumers — manufacturers, data centres, cold-chain logistics — these are not headline distractions. They are margin compressors arriving on top of already elevated input costs.
Manufacturing: The Second-Round Hit
Singapore’s manufacturing sector — which encompasses electronics, biomedical products, and advanced chemicals — does not consume crude oil directly in most of its processes. But energy is embedded in every stage of global supply chains, and when shipping costs and input prices rise simultaneously, the squeeze reaches even the most advanced factories.
Senior economists at DBS Group Research noted that Singapore’s economy is confronting uncertainty from a relatively strong position, with solid growth momentum buoyed by global AI-related tailwinds and still-low inflation at the start of 2026. That strength, real as it is, does not make the republic immune to margin compression in its externally-facing industries. Semiconductor packaging, precision engineering, and pharmaceutical manufacturing all depend on global logistics networks whose costs are now rising sharply.
The AI demand tailwind that powered Singapore’s manufacturing resilience through early 2026 remains intact — demand for advanced chips has not diminished. But when energy and transport costs rise across the supply chain, even AI-driven production is not entirely insulated. Earnings risk for Singapore’s listed manufacturers is real and, as yet, inadequately priced by equity markets.
Transport and Travel: The Visible Daily Pain
Here is where the economic shock becomes humanised. Jet fuel prices have climbed in lockstep with crude, squeezing airline operating margins and threatening the air connectivity on which Singapore’s Changi Airport — the city’s most strategically important piece of infrastructure — depends. Parliamentary questions addressed fare adjustments by ride-hailing operators Grab and ComfortDelGro, asking whether the Ministry of Transport was consulted and what regulatory oversight is in place to prevent private-hire and taxi operators from passing on fuel costs unchecked. The fact that cab drivers received a S$200 fuel subsidy in the April 7 package is telling: the government recognises that transport cost pass-throughs are already live.
Aviation and tourism were singled out among the sectors facing wide disruptions from the conflict. For Singapore, which has positioned itself as Asia’s premier transit hub and whose aviation-adjacent services — hospitality, MICE, retail — form a meaningful slice of services GDP, a sustained softening in air traffic flows is a multi-quarter drag that GDP models may not yet fully capture.
Domestic Services: The Inflation Spiral That Begins in Changi Road
The most economically insidious channel is the one that receives the least analytical attention: the inflationary pass-through into domestic services. When fuel prices rise, school bus operators raise fares — something already visible in Singapore’s local reports. When electricity tariffs rise, restaurants’ operating costs rise; when food import costs climb because freight is more expensive, hawker centre prices follow. These are the mechanisms through which an energy shock migrates from the oil market to the heartland household.
As school bus driver V. Parath put it plainly: “The price of everything in Singapore is increasing.” That is not merely anecdote. It is a leading indicator that core inflation is beginning to broaden from energy and transport into services — a broadening that, once embedded in wage expectations, becomes structurally stickier.
Pull Quote: “This is not a standard energy shock. It is a simultaneous hit to feedstock costs, freight rates, exchange-rate dynamics and consumer confidence — arriving in an economy that was already managing multiple transition pressures. Singapore’s buffers are real and substantial. But buffers are finite.”
The Macro Ripple: MAS, the SGD, and an Unenviable Policy Dilemma
The Monetary Authority of Singapore’s principal policy instrument is the exchange rate, not the interest rate. The central bank manages the Singapore dollar against an undisclosed basket of trading partner currencies within a policy band, adjusting the slope, width, and centre of that band to target imported inflation. In a standard energy shock, the textbook response is to allow or even encourage modest SGD appreciation to absorb imported price increases.
MAS confirmed in early March that it is conducting a formal assessment of the domestic financial system’s exposure, and that the Singapore dollar nominal effective exchange rate remains within its established appreciating policy band — positioning intended to dampen imported inflationary pressures.
But the policy dilemma is more complex than the textbook suggests. Broader dollar strength driven by safe-haven demand and reduced US Federal Reserve rate-cut expectations — with futures markets now pricing the first fully priced Fed cut as late as September, two months later than the July consensus prevailing before the conflict — has compressed Singapore’s room to manoeuvre. A SGD that appreciates against the USD provides some imported-price relief but simultaneously hits the competitiveness of Singapore’s export-facing industries at precisely the moment when their margins are already being squeezed.
Maybank economist Chua Hak Bin had flagged inflation as an underappreciated risk in 2026, citing rising semiconductor prices and the unwinding of Chinese export deflation — a deflationary cushion that had kept manufactured goods prices suppressed for several years. A Gulf supply shock superimposes an energy cost surge on top of those pre-existing pressures. If the conflict persists beyond four to six weeks, Singapore’s core inflation could break above MAS’s 1–2% forecast band, creating pressure on the central bank to shift its exchange-rate policy.
That band adjustment, if it comes, will be one of the most significant MAS signals in years — and it is coming into view.
The Limits of “Safe Haven”: Why Singapore Is Not Immune to Structural Fragmentation
For a generation, Singapore cultivated — and largely deserved — a reputation as Asia’s most resilient small open economy: deep reserves, AAA fiscal credibility, trade agreements with virtually every major partner, and an uncanny institutional capacity to navigate geopolitical turbulence without becoming its casualty. That reputation is not false. But this crisis is exposing its conditionality.
Coordinating Minister for National Security K. Shanmugam warned on April 7 that markets have yet to factor in the worst-case scenario — and that Singapore cannot rule out power disruptions if the conflict in Iran further disrupts global energy supplies. A sitting minister explicitly raising the spectre of power disruption in a city whose every competitive advantage rests on the reliability of its infrastructure is not rhetoric — it is a risk disclosure.
The structural issue is one that Singapore shares with a cohort of ultra-open economies whose prosperity was architected for a rules-based, multilateral trade order. Taiwan, South Korea, and the Netherlands are the most obvious analogues. Each is deeply integrated into global supply chains, each imports most of its energy needs, and each has built extraordinary competitiveness precisely by maximising openness rather than pursuing autarky. In a world of discrete shocks — a pandemic here, a trade dispute there — openness is the right bet. In a world where great-power conflict is becoming endemic rather than episodic, that calculus deserves harder scrutiny.
The Iran war’s economic impact is not merely a supply shock. It is a signal that the frequency and geographic scope of geopolitical disruptions may be structurally higher going forward than the models that underpin Singapore’s growth forecasts were calibrated for. When Gan says growth in the coming quarters will be “affected,” he is describing an outcome. The deeper question is whether Singapore’s — and Asia’s — planning frameworks are being updated to account for a world where such statements become a recurring feature rather than an exception.
May’s Forecast Revision: What to Expect — and Fear
Singapore’s GDP advance estimate for the first quarter is due on April 14, with a full economic outlook update scheduled for May. The first-quarter numbers will almost certainly show resilience — Gan himself acknowledged that early data indicate economic activity held up well through Q1. That resilience, largely built on AI-driven electronics demand and services strength, will briefly reassure markets.
May’s revision is another matter. The 2% to 4% full-year GDP forecast issued in February was calibrated for a world in which the Iran conflict was either resolved or contained within weeks. Singapore’s predicament is shaped by geography as much as policy — the republic sits far from the conflict zone, yet its economy is tied tightly to global trade, imported food and imported fuel. Any threat to Gulf energy production or maritime passage through strategic chokepoints can ripple quickly into Asian benchmark prices, freight costs and business sentiment.
A sustained conflict — and with over a month of fighting already in the books, “sustained” is no longer a tail risk — points to a revised growth forecast closer to the lower end of the current range or potentially below it. Inflation forecasts, already tracking against MAS’s 1–2% core target band, are likely to be revised upward. For households and SMEs that have not yet felt the full pass-through of April’s electricity tariff increase, the coming months will be measurably harder.
What Policymakers Must Do — and What Singapore Offers as Model
The S$1 billion support package unveiled on April 7 — boosting the corporate income tax rebate from 40% to 50%, advancing grocery vouchers to June, and providing S$200 supplements to both eligible households and cab drivers — is competent crisis management. It cushions the immediate pain, demonstrates governmental responsiveness, and signals institutional credibility to markets. It is not, however, a structural solution.
For Singapore specifically, the priorities are now fourfold. First, accelerate energy diversification — Shanmugam noted that Singapore is studying alternatives including nuclear power to broaden its fuel mix, a move that was politically contentious eighteen months ago and is now strategically urgent. Second, extend supply-chain diplomacy aggressively: the Singapore-Australia joint energy security statement of March 23, 2026 is exactly the kind of bilateral redundancy-building that needs to be replicated across multiple partners and commodity categories. Third, provide targeted, time-limited support for SMEs facing acute energy and freight cost pressure — the risk of SME failures compressing domestic employment and spending is underappreciated. Fourth, and most importantly, begin recalibrating the medium-term planning framework to assume a structurally less stable geopolitical environment than the one that informed Singapore’s last decade of growth strategy.
For the broader cohort of open Asian economies — South Korea, Taiwan, Vietnam, Thailand — Singapore’s predicament is a live case study in vulnerabilities they share. The lesson is not to retreat from openness, which remains the correct long-term bet for small economies without large domestic markets. It is to build genuine redundancy into energy, food, and supply-chain systems; to cultivate multiple geopolitical relationships that provide diplomatic buffer in crises; and to hold fiscal capacity in reserve precisely for moments like this one.
Singapore has those reserves. Its institutions are among the world’s most capable. The response so far has been measured, credible, and appropriately scaled. But Gan’s words in Parliament on April 7 should be read not only as a situational update but as a structural warning — to Singapore, and to every economy that built its prosperity on the assumption that the global order would remain permissive. That assumption is now, unmistakably, in question.
The bumpy ride ahead is not Singapore’s alone.
Discover more from The Economy
Subscribe to get the latest posts sent to your email.

The $82 billion exodus from America’s debt market signals more than wartime liquidity stress — it may mark the beginning of a structural reckoning for the dollar’s exorbitant privilege.
As oil prices pierced $110 a barrel and Iran’s blockade of the Strait of Hormuz choked the arteries of global energy trade, something quieter — and potentially more consequential — was unfolding in the marble-floored corridors of the New York Federal Reserve. Foreign central banks were liquidating American debt at the fastest pace in more than a decade.
Federal Reserve custody data shows that holdings of US Treasuries by foreign official institutions at the New York Fed have plunged by $82 billion since February 25, collapsing to $2.7 trillion — the lowest level since 2012. All-Weather Media The timing is not coincidental. The sell-off began almost precisely as the first missiles fell on Iranian soil, and it has accelerated with every week of conflict that grinds on. What began as a wartime liquidity scramble now carries the contours of a deeper structural shift — one that has economists in Frankfurt, Washington, and Beijing quietly updating their long-term models.
This is not merely a story about bond markets under pressure. It is a story about the foundations of American financial power.
The Mechanics of a Wartime Sell-Off
To understand why central banks are selling Treasuries into a crisis that would historically have driven buying, one must follow the energy channel rather than the geopolitical headline.
After Iran blocked the Strait of Hormuz, global oil prices soared, and oil-importing countries were hit hardest. Foreign exchange reserves shrank passively, combined with the need to intervene in currency markets, prompting central banks in many countries to accelerate the liquidation of US Treasuries. All-Weather Media
The logic is grimly circular. An oil-importing nation — say, India or Thailand — suddenly faces a surging import bill denominated entirely in dollars. Its currency weakens under the pressure of that trade shock. To defend the exchange rate and prevent a domestic inflationary spiral, the central bank must sell dollar assets to buy its own currency. The most liquid, deep dollar asset most central banks hold? US Treasuries. Brad Setser, senior fellow at the Council on Foreign Relations, pointed out that Turkey, India, Thailand, and other oil-importing countries are likely the main participants in this round of selling, because these countries must pay higher oil prices in dollars. All-Weather Media
Meghan Swiber, US rate strategist at Bank of America, confirmed the dynamic bluntly: “Foreign official institutions are selling US Treasuries.” All-Weather Media
The distinction that animates debate among market participants is whether this selling is passive — a mechanical consequence of reserve depletion — or active, reflecting a more deliberate choice to reduce dollar exposure. Stephen Jones, Chief Investment Officer at Aegon Asset Management, described the selling as countries “raising war funds,” saying, “They are drawing on emergency reserves.” All-Weather Media In practice, it is likely both, and the combination is what makes the current episode remarkable.
The Scale of It: A Data Table in Words
The numbers are stark and merit clear articulation.
Official data shows that since February 27 — the day before Iran was attacked — the Turkish central bank alone has sold $22 billion in foreign government bonds from its foreign reserves. All-Weather Media Turkey, battling a persistently weak lira and an energy import dependency that leaves it acutely exposed to oil shocks, has been the most aggressive seller. But it is hardly alone.
Independent data from the central banks of Thailand and India also show that both countries’ foreign exchange reserves have declined after the outbreak of the conflict. All-Weather Media Whether the drawdown came from Treasuries specifically or dollar deposits held elsewhere remains partially unclear, but the directional signal is unambiguous: oil importers across Asia and the emerging world are under intense balance-of-payments stress.
At the other end of the oil equation, Gulf exporters face a different calculus. Saudi Arabia held $149.5 billion in US Treasuries as of December 2025. The Gulf states collectively maintain over $2 trillion in dollar-denominated assets. Saudi Arabia, the UAE, Kuwait, Qatar, and Bahrain all peg their currencies to the US dollar, requiring them to keep vast amounts of dollars to support that peg and, in doing so, help sustain Treasury demand. Middle East Eye Their behavior in the weeks ahead — whether they hold, or quietly reduce — will be among the most consequential signals to watch in global bond markets.
Yields Surge: America’s Borrowing Costs Bite Back
The sell-off is not happening in a vacuum. It is coinciding with — and amplifying — a broader repricing of US government debt that has unsettled investors and policymakers alike.
The 10-year US Treasury yield has risen from around 3.9% to a peak of 4.4%, while the 2-year yield climbed from 3.35% to above 4% — both hitting eight-month highs. Euronews That may not sound catastrophic in isolation, but it arrives against a backdrop of acute fiscal vulnerability. The US national debt crossed $39 trillion on March 18, 2026 — a milestone reached just weeks into the war in Iran — with interest costs projected to become the fastest-growing line item in the federal budget, after credit downgrades from all three major ratings agencies. Fortune
RSM Chief Economist Joseph Brusuelas captured the market’s collective anxiety: “The US Treasury bond market has finally responded to the Mideast war, giving its assessment of the energy shock’s severity and the war’s effect on US fiscal imbalance and inflation.” The MOVE index, which tracks volatility in the Treasury market, has spiked to levels consistent with price instability and policy dysfunction. Fortune
BCA Research’s Chief Fixed Income Strategist Robert Timper has characterized the pattern as “aggressive bear flattening of yield curves,” reflecting a hawkish monetary policy repricing in response to inflation fears stemming from the Iran war. Euronews On a conventional reading, this is stagflationary: energy-driven inflation pushes short-term rates higher even as growth expectations deteriorate. The Fed, caught between an oil shock and a slowing labor market, finds itself precisely where it least wants to be — with no clean policy option.
Central banks are concerned that another inflation shock, even if caused by a temporary spike in oil, might convince consumers and businesses that inflation is going to be high for a long time. Marketplace The confidence channel, in other words, may matter as much as the oil price level itself.
The Petrodollar’s Perfect Storm
Here is where the analysis shifts from cyclical to structural — and where the Iran conflict becomes geopolitically transformative rather than merely disruptive.
Deutsche Bank FX strategist Mallika Sachdeva has argued that the conflict could be remembered as a key catalyst for “erosion in petrodollar dominance, and the beginnings of the petroyuan.” CNBC That is a remarkable sentence to see in a research note from a major Western bank, and it demands unpacking.
The petrodollar system — born from a secret 1974 agreement between the US and Saudi Arabia — is elegantly simple in its design. Riyadh agreed to price its oil exports in dollars and invest its petroleum windfalls into US Treasuries; in return, Washington provided military protection and security guarantees for Gulf infrastructure. Other OPEC members followed, locking the dollar in as the indispensable currency of the modern world. Fortune That recycling loop allowed Washington to borrow cheaply, run persistent deficits, and still command the world’s reserve currency — what the French famously called America’s “exorbitant privilege.”
The Iran war has directly challenged every pillar of that arrangement. US military assets and bases in the Gulf have come under attack. Oil infrastructure in the Gulf has been hit. And the US ability to provide maritime security to ensure the global flow of oil has been challenged by the closure of Hormuz. The US security umbrella has been fundamentally tested. The Canary
Deutsche Bank’s Sachdeva wrote that the conflict “may expose further fault lines, by challenging the US security umbrella for Gulf infrastructure and maritime security for global trade in oil,” adding that “damage to Gulf economies could encourage an unwind in their foreign asset savings held largely in dollars.” Middle East Eye
The most concrete manifestation of this risk is already visible. Reports from multiple outlets confirm that Iran has been negotiating tanker passage through the Strait of Hormuz only when transactions are settled in yuan — a policy Deutsche Bank flags as a potential watershed moment. Bitcoin News At least 11.7 million barrels have moved through Chinese-linked tankers since late February, with many vessels going dark to avoid tracking. Discussions with at least eight non-Middle Eastern countries on yuan-based oil trade for safe transit have also been reported. Bitcoin News
This is not yet the petroyuan. But it is its audition.
Dedollarization: Accelerant, Not Origin
It would be analytically sloppy to present the Iran war as the singular cause of dedollarization. The trend predates the current conflict by years — accelerated by US sanctions on Russia in 2022, the rise of BRICS payment alternatives, and China’s persistent push to internationalize the renminbi through mechanisms like the mBridge central bank digital currency project.
Even before the Iran war, hypotheses about the petrodollar’s erosion had been building. US sanctions on Russian and Iranian oil had already created illicit trade routes settled in yuan and roubles. Saudi Arabia had joined mBridge, taking a seat in China’s alternative payment infrastructure. Fortune
What the Iran war has done is compress the timeline. Structural shifts that might have taken a decade now have a geopolitical accelerant behind them. And critically, this wave of selling reflects a deeper trend: global reserve management institutions have been diversifying dollar asset allocations for years, and the status of US Treasuries as the primary global reserve asset is being increasingly eroded. All-Weather Media
That said, the dollar doomsayers deserve scrutiny alongside the dollar optimists. The offshore dollar credit market stood at $2.5 trillion in 2000 and has hit $14.2 trillion more recently — evidence of structural resilience that should temper apocalyptic narratives. Fortune The dollar index is on track to gain around 3% in March, with energy-driven stagflation risks supporting the greenback in the near term, according to OCBC strategists. CNBC Crises, paradoxically, often strengthen the dollar even when they degrade its long-term foundations.
The distinction — between short-term safe-haven demand for the currency and long-term diversification away from the asset — is exactly what makes this moment so analytically treacherous. Central banks may be buying dollars even as they sell Treasuries. As Wells Fargo’s Brendan McKenna noted, investors who want dollar safety have plenty of options beyond Treasuries — money market funds, savings accounts, corporate bonds — all dollar-denominated, none of which require holding sovereign debt. Marketplace
What Comes Next: The Fed’s Dilemma and the Gold Trade
The Federal Reserve finds itself boxed in on multiple fronts. Prediction markets now price only a 23.5% probability of a Fed rate hike in 2026, and only 37% probability of zero cuts — meaning the majority of investors still expect the Fed to remain relatively more dovish compared to major central banks like the ECB, which markets now give an 85% probability of hiking. Benzinga
That divergence matters for Treasury markets. If the Fed stays patient while inflation creeps higher, the risk premium on longer-dated Treasuries will widen further. If it hikes preemptively, it risks tipping a slowing economy into recession — and potentially triggering exactly the kind of demand destruction that would crash oil prices and resolve the inflationary shock anyway. Neither path is comfortable.
Meanwhile, the private investment alternatives are multiplying. Gold — the original reserve asset, abandoned by Bretton Woods but never fully forgotten — has surged as central banks globally have accelerated purchases. For emerging market central banks now questioning the sanctity of US sovereign debt, gold offers something Treasuries currently cannot: an asset without geopolitical counterparty risk.
The deeper implication, the one that keeps Treasury officials awake, is about the fiscal term premium — the extra yield investors demand to hold long-duration US debt given fiscal and policy uncertainty. Brusuelas warned that if uncertainty continues, it could trigger broader funding stress in debt markets already under pressure from concerns about private credit — with total investment-grade supply coming to market in 2026 estimated at around $14 trillion. Fortune The competition for global capital has never been fiercer, and the US no longer bids from a position of unquestioned supremacy.
The Long View: A Privilege Under Audit
The $82 billion drop in foreign official Treasury holdings is, in isolation, manageable. The US Treasury market is the deepest and most liquid in the world; $82 billion is noise in a $28 trillion market. What is not manageable — if it continues — is the structural message embedded in the data.
For fifty years, the petrodollar system functioned as a self-reinforcing cycle: oil exported in dollars, dollars recycled into Treasuries, cheap US borrowing reinforcing dollar dominance, dollar dominance reinforcing oil pricing. The Iran war has not broken that cycle. But it has introduced friction into every link of the chain simultaneously — energy shock, currency stress, reserve drawdown, yield surge, and a nascent yuan-for-oil experiment at the world’s most critical chokepoint.
Policymakers in Washington should be paying close attention not just to where Treasury yields are today, but to where foreign central bank buying will be in six, twelve, and twenty-four months. The exorbitant privilege was never guaranteed. It was maintained by confidence — in American institutions, American security commitments, and American fiscal restraint. The Iran war is testing all three at once.
For now, the dollar holds. The question is whether it holds the same thing it did before the war began.
Discover more from The Economy
Subscribe to get the latest posts sent to your email.

Mortgage applications hit a 25-year low as first-time buyers collapse to 21% of market share. Why young Americans face a future as perpetual renters — and what it means for the economy. “Mortgage applications hit a 25-year low. First-time buyers are a record-low 21% of the market. Why young Americans face life as perpetual renters.
The Numbers No One Wants to See
Consider what it takes to close on a home in America right now. You need a household income approaching six figures to qualify for the median-priced existing home. You need a down payment that, at the current median of 10% for first-time buyers, amounts to more than $43,000 in cash — at the highest level since 1989. You need the nerve to lock into a 30-year fixed mortgage rate of 6.43% — more than double the pandemic-era lows that millions of existing homeowners are still sitting on, quite contentedly, with no intention of surrendering. And you need the good fortune of finding something for sale in the first place.
If you’ve managed all of that, congratulations. You are, in a measurable and increasingly literal sense, one of the lucky few.
The American mortgage — that foundational instrument of middle-class wealth, the financial backbone of the postwar suburban compact — is vanishing. Not gradually, and not quietly. Data released by the Mortgage Bankers Association on March 25, 2026 showed mortgage applications tumbling another 10.5% in a single week, with the Purchase Index falling 5% week-over-week. The week prior — ending March 13 — had already seen a 10.9% collapse, the steepest single-week drop since September 2025. These aren’t blips. They are the fingerprints of a structural transformation so deep that it risks redrawing the sociological map of American wealth for a generation.
Worse Than the Great Recession — Without the Excuse
To grasp how extraordinary the current freeze is, it helps to recall what the housing market looked like during the worst economic catastrophe of living memory. In 2009 and 2010, as the subprime bubble imploded and unemployment breached 10%, mortgage originations cratered. The MBA’s Market Composite Index — which tracks total loan application volume — fell to what seemed like unthinkable lows. The housing market was broken, the country agreed, and policymakers mobilized accordingly.
Today, unemployment sits at roughly 4%. The economy has, by standard macroeconomic measures, recovered. And yet 96 of the 100 lowest readings of the MBA’s weekly mortgage application index have occurred in the past three years — a span that began not with a financial crisis but with the Federal Reserve’s campaign to tame post-pandemic inflation. The market is not broken in the way 2009 was broken. It is frozen, seized by a structural contradiction: the people who own homes have every incentive to stay put, and the people who want homes cannot afford to enter.
The MBA’s weekly Purchase Index — which isolates new home purchase applications from refinancing activity — was only 5% higher than the same week one year ago as of late March 2026, a derisory gain that barely registers against years of suppressed demand. Elevated Treasury yields, driven in part by geopolitical oil-price pressures, have kept mortgage rates stubbornly high. The 30-year conforming rate closed the week at 6.43%, with jumbo balances carrying 6.45%. The window in early 2026 when some lenders briefly offered rates approaching 6.25% — hailed breathlessly at the time as a turning point — has snapped shut.
The Rate-Lock Prison
To understand why the supply side of the housing market has frozen so completely, follow the math of the existing homeowner. The median American seller has now owned their home for a record 11 years before listing — an all-time high in data stretching back to 1981. Roughly 60% of outstanding mortgages in the United States carry rates below 4%. Trading a 3% mortgage for a 6.4% one, on a more expensive house, in a market with higher property taxes and insurance premiums, requires a powerful motivating force — a job relocation, a family expansion, a death, a divorce. For tens of millions of Americans, the math simply doesn’t pencil out, and so they stay. Their inertia is perfectly rational. Its aggregate effect is devastating.
The NAR’s 2025 Profile of Home Buyers and Sellers — a survey of transactions conducted between July 2024 and June 2025 — captures the downstream consequences with clinical precision. The typical seller age hit a record 64. The typical buyer age hit a record 59. The median age of first-time buyers climbed to an all-time high of 40 — up from the late twenties in the 1980s, and from 30 as recently as 2010. By NAR’s accounting, a decade of deferred homeownership costs a typical buyer roughly $150,000 in accumulated equity on a standard starter home. That is not a financial setback. That is a generational wealth transfer, running in reverse.
Redfin, using a different methodology that draws more directly on Federal Reserve microdata, places the first-time buyer median age at 35 in 2025 — lower than NAR’s figure, and a modest improvement from the prior year. Even at 35, the typical first-time buyer is significantly older than at any point in the postwar era, and the methodological debate between NAR and Redfin only underscores the point: by any honest accounting, Americans are buying their first homes later, under more financial duress, with lower long-term equity gains ahead of them.
The First-Time Buyer Collapse
The most alarming data point in the NAR survey is not the age figure — it is the share. First-time buyers accounted for just 21% of all home purchases over the 12-month survey period — a record low in data going back to 1981, and a figure that has been cut in half since 2007, when first-timers made up around 40% of the market. Before the Great Recession, 40% was considered the structural norm. The NAR’s deputy chief economist, Jessica Lautz, did not mince words: “The implications for the housing market are staggering. Today’s first-time buyers are building less housing wealth and will likely have fewer moves over a lifetime as a result.”
The vacuum left by absent first-time buyers has been filled, predictably, by those with the deepest pockets. Repeat buyers now constitute 79% of all home purchases, with a median age of 62 and a median down payment of 23% — the highest since 2003. Thirty percent of repeat buyers paid all cash, bypassing the mortgage market altogether. In a healthy housing ecosystem, first-time buyers feed the lower rungs of the ladder, creating demand that allows existing owners to trade up. When that base collapses, the entire market ossifies. Turnover falls. Supply dwindles. Prices, absent the corrective pressure of a functioning bottom of the market, hold or rise despite unaffordable conditions. This is not a market failure in the traditional sense. It is a market succeeding — extraordinarily well — for a narrow slice of older, already-wealthy participants, at the expense of everyone else.
Key Generational Homeownership Data (2025)
| Generation | Homeownership Rate (2025) | Boomer Rate at Same Age |
|---|---|---|
| Gen Z (ages 19–28) | 27.1% | ~40–44% |
| Millennials (ages 29–44) | 55.4% | ~60–65% |
| Gen X (ages 45–60) | 72.7% | — |
| Baby Boomers (ages 61–79) | 79.9% | — |
Sources: Redfin analysis of Census Current Population Survey, 2025; Scotsman Guide
Gen Z’s homeownership rate reached 27.1% in 2025, up marginally from 26.1% the year before. That modest gain deserves context: when Gen Xers and baby boomers were the same age, homeownership rates for 28-year-olds stood at 42.5% and 44.4%, respectively. Gen Z is tracking 15 percentage points behind its parents’ generation at the same stage of life. Meanwhile, racial gaps remain stark: the homeownership rate for Gen Z Black Americans stood at just 14.2% in Q4 2025, a figure that compounds the racial wealth gap with brutal efficiency.
Among young adults broadly, the under-35 homeownership rate rose from 36.3% to 37.9% in the fourth quarter of 2025 — a genuine uptick, but one that remains below the 25-year average, and one achieved not because the market opened up but because a fraction of younger buyers made extraordinary sacrifices to enter it. As Redfin senior economist Asad Khan noted, “Gen Zers and millennials are making small gains in homeownership because they’re eager to buy, they’re making sacrifices, and because affordability has improved a bit at the margins — not because homes suddenly became affordable.”
Even at current levels, the median household income lags nearly $25,000 behind the earnings required to purchase a median-priced home. That gap is not a rounding error. It is a structural chasm.
The Supply Catastrophe Underneath
Every discussion of housing affordability eventually circles back to supply — and the supply picture in America is not improving fast enough. Single-family housing starts averaged 943,000 units in 2025, down from 1.02 million in 2024, with MBA projecting a roughly flat 2026 at around 930,000 units. That number falls far short of the estimated 1.5 to 2 million new units economists say are required annually to close the supply deficit built up over the past decade and a half of underbuilding.
Homebuilders face a perfect storm of their own: elevated input costs, persistent labor shortages, zoning and permitting barriers that add months and hundreds of thousands of dollars to project timelines, and — critically — an elevated inventory of unsold new homes sitting at 472,000 units as of December 2025, equivalent to an 8-month supply. Builders are not inclined to break ground aggressively into a market where completed homes sit unsold. The result is a construction industry operating at a cautious pace precisely when the country needs urgency.
The rental alternative provides cold comfort. Rents have softened in some Sunbelt markets as a surge of multifamily completions finally came to market, but vacancy rates in major East Coast metros remain tight. For young Americans priced out of ownership, renting is not a temporary waystation — it is increasingly a permanent condition. Apartment List’s 2025 Millennial Homeownership Report found that nearly 25% of millennials expect to always rent — a figure that has roughly doubled since 2018. That psychological shift matters: when a generation stops believing homeownership is attainable, the political and social pressure to fix housing markets loses one of its most powerful engines.
A Global Pattern, an American Inflection
The United States is not alone in this predicament. The housing affordability crisis plaguing American millennials and Gen Z has close cousins in Canada, Australia, the United Kingdom, and across Western Europe, where a toxic combination of years of low interest rates inflating asset prices, NIMBYist planning regimes restricting supply, and demographic demand from large young cohorts has pushed homeownership rates for people under 40 to multi-decade lows. In London, Sydney, Toronto, and Auckland, the conversation about a permanently renting younger class is years further along than in Washington or New York. The political backlash — housing as a central election issue — is already transforming party platforms in the U.K. and Australia.
What distinguishes the American case is the mortgage itself. The 30-year fixed-rate mortgage, a product unique to the United States among major economies, has historically functioned as an extraordinary wealth-building tool and a form of consumption smoothing — allowing households to lock in a predictable housing cost for three decades, building equity through forced savings, and eventually owning an asset outright. The product was explicitly designed, through the government-sponsored enterprises Fannie Mae and Freddie Mac, to democratize capital access. When that instrument becomes unaffordable to the bottom half of the income distribution — and then the bottom 60%, 70% — it stops serving its designed purpose and begins functioning as a wealth-concentrating tool for those already inside the system.
What Comes Next — and What Policy Must Do
The Federal Reserve’s rate-cutting cycle, which saw three quarter-point reductions in 2025, has done remarkably little to ease mortgage rates, which respond primarily to 10-year Treasury yields rather than the fed funds rate. MBA forecasts rates averaging around 6.4% through 2026, while Fannie Mae has projected a more optimistic path toward sub-6% rates by year’s end — a divergence that reflects genuine uncertainty about the trajectory of inflation, fiscal deficits, and global capital flows. Even if rates fell to 5.5% tomorrow, the affordability math for a 28-year-old earning the median income would remain deeply challenging. Rate relief alone cannot fix a market distorted by a decade of underbuilding.
What would fix it — or at least bend the curve — is a policy agenda serious enough to match the scale of the problem:
- Zoning reform at scale. States that have moved to override restrictive local zoning — Montana, California’s recent legislative efforts, and several New England states — are showing early signs that supply can respond when the regulatory cage is opened. Federal incentives tied to zoning liberalization deserve serious legislative attention.
- Expansion of first-time buyer tools. Down payment assistance programs exist in every state, with over 2,200 initiatives nationally — yet 80% of eligible FHA borrowers fail to access them, simply because awareness is catastrophically low. A federally coordinated information campaign, combined with direct first-generation buyer subsidies, could meaningfully move the needle.
- Rate-lock portability. The most counterintuitive policy idea gaining traction is allowing homeowners to transfer their low-rate mortgages to new properties when they sell. If sellers feel less trapped by their existing rates, more would list. More listings means more supply. More supply means lower prices. The mechanism is financially complex, but the logic is sound.
- Long-term institutional investor accountability. The growing share of single-family homes purchased by institutional investors — and converted to rentals — deserves rigorous scrutiny. While the macroeconomic evidence on investor impact is mixed, the political economy of housing requires that policymakers be seen to address what has become a legitimate public grievance.
The Closing of the American Dream
There is a particular cruelty to the present moment that the aggregate data obscures. For three generations, the mortgage was the mechanism by which an ordinary family — a teacher, a mechanic, a nurse — converted labor into permanent wealth. It was imperfect, racially exclusionary in its early decades, and frequently predatory at the margins. But it worked, on balance, as an engine of intergenerational mobility. The children of homeowners were statistically more likely to attend college, accumulate savings, and buy homes themselves. The equity built in a home served as start-up capital for businesses, as a buffer against medical emergencies, as the inheritance that smoothed the generational transfer of modest prosperity.
When 87% of millennials tell pollsters they believe government should do more to make homeownership accessible — a figure significantly higher than older generations — they are not articulating an abstract ideological preference. They are describing a locked door. They grew up watching their parents build equity in appreciating homes. They graduated into a labor market reshaped by the Great Recession. They came of age as borrowers just as rates rose from 3% to 7%. And now, as the MBA’s weekly surveys confirm week after week, they are applying for mortgages at a rate lower than any seen in 25 years — lower than during the depths of the worst economic collapse in living memory.
The homeownership rate for all Americans under 35 stands at 37.9%. It is slightly higher than it was a year ago, and the analysts at Realtor.com are careful to note it. But the 25-year average for that demographic is 39.7%. And when previous generations were the same age, under-35 homeownership ran closer to 42–44%. The gap is not closing. The structural headwinds — rates, prices, supply, debt, stagnant wages relative to home values — are not resolving themselves on a timeline that will save the housing mobility of the generation currently in its prime buying years.
If a 30-year-old in 2026 waits until 40 to buy — as the NAR data suggests is now the median outcome — they will spend a decade paying someone else’s mortgage, building no equity, and arriving at ownership with 10 fewer years of compounding appreciation ahead of them. Multiplied across 80 million millennials and the Gen Z cohort now entering the labor force behind them, that delay represents an almost incalculable transfer of wealth from the young to the already-propertied.
The mortgage is not gone. It is still being written, still being signed, still closing on homes across America every day. But it is becoming a luxury product — a credential of the already-arrived rather than a ladder for the aspiring. That transformation, if left unaddressed, will not merely reshape household balance sheets. It will reshape the country.
Discover more from The Economy
Subscribe to get the latest posts sent to your email.
-

 Markets & Finance3 months ago
Top 15 Stocks for Investment in 2026 in PSX: Your Complete Guide to Pakistan’s Best Investment Opportunities
-

 Analysis2 months ago
Brazil’s Rare Earth Race: US, EU, and China Compete for Critical Minerals as Tensions Rise
-

 Banks3 months ago
Best Investments in Pakistan 2026: Top 10 Low-Price Shares and Long-Term Picks for the PSX
-

 Investment3 months ago
Top 10 Mutual Fund Managers in Pakistan for Investment in 2026: A Comprehensive Guide for Optimal Returns
-

 Analysis2 months ago
Top 10 Stocks for Investment in PSX for Quick Returns in 2026
-

 Asia3 months ago
China’s 50% Domestic Equipment Rule: The Semiconductor Mandate Reshaping Global Tech
-

 Global Economy3 months ago
Pakistan’s Export Goldmine: 10 Game-Changing Markets Where Pakistani Businesses Are Winning Big in 2025
-

 Global Economy3 months ago
15 Most Lucrative Sectors for Investment in Pakistan: A 2025 Data-Driven Analysis