
Opinion
Oil set for steepest weekly gain since 2020 as Middle East conflict spreads

Brent crude breaks $88 amid a severe Strait of Hormuz oil disruption, threatening to upend the global macroeconomic recovery.
The global energy complex is undergoing its most violent recalibration in four years. What began as localized geopolitical friction has rapidly metastasized into a systemic supply shock. Oil prices today are no longer merely reflecting standard supply-and-demand fundamentals; they are actively pricing in the immediate, physical threat of a wider regional war. As military engagements escalate across the Persian Gulf, we are witnessing the steepest weekly gain oil since 2020, an ascent that has forced central bankers, corporate executives, and policymakers to rapidly revise their economic growth and inflation models.
On Friday morning, trading screens across London and New York flashed a relentless upward trajectory. Brent extended its rally, rising $2.95, or 3.45%, to $88.36 per barrel. The core Brent crude $88 surge causes are rooted squarely in the physical restriction of crude flows. Hundreds of tankers are currently idling like ghosts in the Gulf, trapped by maritime blockades, targeted strikes on refineries, and the asymmetric threats to energy infrastructure. This Strait of Hormuz oil disruption has effectively paralyzed roughly one-fifth of the world’s daily crude consumption, sparking panic buying across Asian and European commodity desks.
The reverberations of this Brent crude rally are profound. Unlike the demand-destruction crash of the COVID-19 pandemic or the heavily telegraphed sanctions rollout following Russia’s 2022 invasion of Ukraine, the Iran war impact on global oil supply 2026 is immediate and highly physical. Markets are acknowledging a grim historical reality: when the Strait of Hormuz closed oil prices respond with unprecedented, violent velocity.
Why the Strait of Hormuz Disruption Is Driving the Brent Crude Rally
To understand the sheer scale of the oil rally 22% this week Middle East, one must look at the geography of global energy transit. The Strait of Hormuz is the world’s most critical oil transit chokepoint. On a typical day, ships carrying oil equivalent to 20% of global demand sail through this narrow waterway, supplying major Asian economic engines including China and India.
When analyzing oil prices today, the premium is entirely tied to maritime security. The ongoing Strait of Hormuz oil disruption has forced global shipping conglomerates to divert or anchor their fleets. As reported by Reuters in their initial coverage of the maritime halt, over 150 ships were stranded around the Strait by mid-week following the escalation of US-Israeli and Iranian strikes.
For the Brent crude price, this translates to an astronomical risk premium. Buyers are scrambling to secure prompt barrels, pushing the futures curve into deep backwardation—a market structure where near-term prices are significantly higher than future delivery months, signaling acute, immediate scarcity. The Brent crude rally is not speculative; it is a desperate physical scramble for energy security.
The Numbers: Benchmarking the Surge
The metrics underpinning oil prices today are historic. The WTI crude weekly gain currently sits near 27%, the most aggressive upward movement since April 2020. Brent futures have surged nearly 22% this week, echoing the volatility of the pandemic’s deepest supply cuts.
| Benchmark | Current Price | Daily Change | Weekly Gain Context |
| Brent Crude (ICE) | $88.36 | +$2.95 (+3.45%) | +22.0% (Largest since May 2020) |
| WTI Crude (NYMEX) | $84.95 | +$3.94 (+4.86%) | +27.0% (Largest since April 2020) |
| Dutch TTF Natural Gas | €38.80 / MWh | +21.0% | +25.0% |
The WTI crude weekly gain is particularly telling. While WTI is a US-centric benchmark, its massive surge illustrates that the oil prices Middle East conflict contagion is fully globalized. Domestic US producers cannot simply pump enough shale oil overnight to offset a prolonged Strait of Hormuz oil disruption.
How the Iran Conflict Is Reshaping Oil Prices Today
The geopolitical chessboard is shifting rapidly in response to the Brent crude price surge. The Iran war impact on global oil supply 2026 is forcing uneasy compromises in Washington and allied capitals. Desperate to cool the Brent crude rally, the US Treasury has executed a controversial but necessary geopolitical maneuver regarding sanctioned energy.
In a move aimed squarely at suppressing the soaring Brent crude price, Washington granted Indian refiners a 30-day waiver to purchase Russian oil currently stranded at sea. This U.S. Russian oil waiver energy prices strategy highlights the fragile state of global supply. India, the world’s third-largest oil importer, receives 40% of its crude via the Strait of Hormuz. By legally allowing New Delhi to absorb non-sanctioned Russian barrels floating in international waters, the US hopes to ease the demand pressure that is currently driving oil prices today.
The New York Times reported extensively on how this waiver alters sanctions policy, noting that when the Strait of Hormuz closed oil prices, the West was forced to choose between strict enforcement against Moscow and domestic economic survival. This U.S. Russian oil waiver energy prices dynamic proves that in the face of the oil prices Middle East conflict, economic pragmatism trumps ideological sanctions.
[Read our full analysis of OPEC+ spare capacity strategies and Saudi Arabia’s production limits here]
Macroeconomic Contagion: Inflation and Central Banks
If the Strait of Hormuz oil disruption persists, the macroeconomic damage will be severe. The Brent crude rally threatens to undo two years of painful monetary tightening by the Federal Reserve, the European Central Bank, and the Bank of England.
When evaluating the Brent crude price, economists watch the $90 threshold closely. According to Bloomberg Economics estimates on global GDP and energy shocks, every sustained $10 increase in the price of oil shaves roughly 0.1% to 0.2% off global GDP growth while simultaneously pushing headline inflation higher.
The oil prices Middle East conflict dynamic presents a nightmare scenario for central bankers: stagflation. As the WTI crude weekly gain filters down to wholesale costs, manufacturers and logistics companies will pass these costs onto consumers. While Federal Reserve Governor Christopher Waller recently signaled that a brief gas price spike is unlikely to cause sustained inflation, a prolonged Strait of Hormuz oil disruption alters that calculus entirely. If oil prices today become the new baseline, rate cuts slated for later this year will almost certainly be taken off the table.
Global Impacts: What an $88+ Barrel Means for Your Wallet
For the global executive, the informed investor, and the everyday consumer, the oil prices Middle East conflict premium is about to become highly visible. The most immediate impact of the Brent crude rally will be felt at the pump and at the terminal.
- Retail Gasoline: Analysts are warning that US retail gasoline futures, which have already surged over 9% to their highest levels since 2024, will inevitably push average pump prices back above the politically sensitive $3.50 to $4.00 a gallon mark. The WTI crude weekly gain guarantees higher input costs for domestic refiners.
- Aviation and Travel: If you are browsing Expedia for corporate travel or summer vacations, prepare for immediate fare hikes. Jet fuel is heavily correlated with the Brent crude price. While major carriers utilize fuel hedging, the sheer velocity of the oil rally 22% this week Middle East will force airlines to introduce fuel surcharges within weeks.
- Supply Chain Logistics: The Strait of Hormuz oil disruption does not just trap crude; it traps diesel, natural gas, and petrochemical feedstocks. Maritime freight rates will spike, increasing the final delivery cost of consumer goods globally.
As The Economist recently noted in its geopolitical risk outlook, Western consumers are deeply insulated from Middle Eastern politics until those politics dictate the price of their morning commute. The Brent crude $88 surge causes are thousands of miles away, but the economic bite is inherently local.
Analyst Outlook & Forward Scenarios: Could We See $150 a Barrel?
The critical question dictating oil prices today is duration. Is this a temporary geopolitical spasm, or a structural realignment of the Middle East?
Market analysts are divided into two camps regarding the Brent crude price trajectory:
- The Geopolitical Risk Premium Camp: Some analysts, such as those at Citi, expect the Brent crude rally to stabilize between $80 and $90 a barrel. They argue that the WTI crude weekly gain already prices in the worst of the immediate conflict. If the US and Iran engage in back-channel de-escalation, the Strait of Hormuz oil disruption could clear, allowing the risk premium to deflate.
- The Systemic Escalation Camp: The darker scenario models what happens if the Iran war impact on global oil supply 2026 becomes permanent. Qatar’s energy minister recently warned the Financial Times that if Gulf energy producers are forced to shut down exports for weeks, the market could see crude rocket to $150 a barrel.
If the Strait of Hormuz closed oil prices will not stop at $90. The loss of 20 million barrels per day cannot be replaced by OPEC+ spare capacity, which currently relies heavily on a Saudi Arabian infrastructure that is itself vulnerable to the widening war. The oil prices Middle East conflict scenario at $150 a barrel would trigger a synchronized global recession, destroying energy demand through pure economic attrition.
Furthermore, the U.S. Russian oil waiver energy prices relief valve is only a temporary band-aid. Diverting sanctioned oil to India merely shifts barrels around a stressed global chessboard; it does not create the new supply necessary to offset a true Persian Gulf blockade. The historic WTI crude weekly gain we saw this week is a warning shot across the bow of the global economy.
The New Age of Energy Realpolitik
We have officially entered an era where energy fundamentals are entirely subordinated to geopolitics. The oil rally 22% this week Middle East is not an anomaly; it is a feature of a multipolar world where critical chokepoints are actively contested.
The Brent crude $88 surge causes are complex, tying together drone strikes in Tehran, idling supertankers in the Gulf of Oman, and emergency waivers drafted in Washington. But the result is painfully simple: energy security is no longer guaranteed. As markets digest the reality of the steepest weekly gain oil since 2020, investors and consumers alike must brace for a protracted period of volatility. The Brent crude rally has violently reminded the West of its enduring reliance on the world’s most volatile region.
As oil prices today hover ominously near the $90 threshold, the global economy holds its breath. Will diplomatic off-ramps emerge to unblock the Strait, or are we witnessing the opening salvos of an energy shock that will redefine the decade?
Discover more from The Economy
Subscribe to get the latest posts sent to your email.


The era of the verbose central banker may be nearing its end, if a growing faction of monetary conservatives has its way. For the better part of two decades, the Federal Reserve has operated under a simple, seemingly unassailable premise: more transparency equals less market volatility. The institution transitioned from the cryptic briefcase-watching days of the Alan Greenspan era to a modern regime of dot plots, forward guidance, and post-meeting press conferences that parse every syllable of economic data. Yet, former Federal Reserve governor Kevin Warsh has emerged as the loudest voice calling for a radical reversal. His prescription for the central bank is startling in its simplicity. He wants them to stop explaining everything.
What follows, however, is not a call for renewed secrecy, but a structural critique of how monetary policy transparency has inadvertently cornered the world’s most powerful financial institution. Since the 2008 financial crisis, the volume of central bank communication has exploded. The average length of an FOMC post-meeting statement grew from roughly 130 words in 1999 to over 800 words by the early 2020s, a symptom of an institution desperately trying to script the future. Warsh, currently a visiting fellow at the Hoover Institution, argues that this hyper-communication has transformed the Fed from a reactive stabiliser into an anxious market manager. By pre-committing to future policy paths through extensive forward guidance, the central bank has severely limited its own optionality when macroeconomic conditions inevitably change.
The core of the argument surrounding Kevin Warsh Fed communication reforms rests on the idea that the central bank has become a prisoner of its own forward guidance. In the post-Bernanke era, the Federal Reserve adopted the philosophy that explaining future policy intentions would smooth out market reactions and anchor yield curves. Warsh contends this approach has fundamentally backfired. Instead of calming markets, hyper-transparency has created a brittle financial system highly reactive to minor shifts in the Fed’s linguistic tone.
When the Fed attempts to narrate the economic future, it invites Wall Street to trade the narrative rather than the underlying economic reality. Warsh has repeatedly warned that central banks are not omniscient forecasting agencies. When policymakers issue detailed dot plots projecting interest rates three years into the future, they project a false certainty. If inflation spikes or employment drops unexpectedly, the Fed is forced into a humiliating retreat, damaging its institutional credibility. A report by the Bank for International Settlements recently highlighted that over-reliance on forward guidance during periods of high inflation actually delayed necessary policy tightening, as central banks hesitated to break their own public promises.
By retreating from the microphone, Warsh suggests the Federal Reserve can reclaim its tactical flexibility. If markets are given less explicit guidance, they must revert to doing their own price discovery based on incoming data, rather than waiting to be spoon-fed by Jerome Powell. This forces market participants to price in risk more accurately. The current regime, Warsh argues, acts as a psychological subsidy to financial markets, encouraging risk-taking because traders believe the Fed has broadcast its entire playbook in advance.
To understand the mechanics of this critique, one must examine the specific tools the Fed uses to broadcast its intentions. The most controversial is the Summary of Economic Projections, colloquially known as the dot plot. Introduced in 2012, the dot plot was designed to provide a visual representation of where each FOMC member expects interest rates to be in the coming years. Warsh views the dot plot not as a tool of clarity, but as an engine of confusion that central bank forward guidance relies on too heavily.
What is forward guidance in monetary policy? Forward guidance is a communication tool used by central banks to signal the future path of interest rates to the public and financial markets. By clearly stating their long-term policy intentions, central banks aim to influence current financial conditions, lower long-term borrowing costs, and stimulate or cool economic activity.
When 19 different Fed officials publish 19 different interest rate trajectories, the result is often chaotic. Markets fixate on the median dot, treating it as a blood oath rather than a fleeting estimate. If a single official alters their projection, the median shifts, triggering billions of dollars in algorithmic trading volume. This creates a feedback loop where the Fed is constantly managing market reactions to its own theoretical forecasts. According to research published by the International Monetary Fund, central bank communications that provide excessively narrow path projections often result in higher bond market volatility when those paths inevitably change.
Warsh’s proposed alternative is a return to an older, quieter style of central banking. The Fed should state what it is doing today, provide a brief rationale based on current data, and remain largely silent on what it might do six months from now. This approach acknowledges the inherent unpredictability of the global macroeconomy. It shifts the burden of forecasting back to private markets, where it belongs. The Federal Reserve, in this model, speaks through its actions—its rate adjustments and balance sheet mechanics—rather than its press releases.
If the Federal Reserve were to adopt this doctrine of strategic silence, the immediate downstream consequence would be a structural repricing of risk across global markets. For the past 15 years, a vast ecosystem of analysts, commentators, and algorithmic trading models has been built entirely around parsing Fed rhetoric. A sudden reduction in central bank forward guidance would strip away the guardrails that equity and bond markets have come to rely on.
In the short term, this shift would almost certainly spike the VIX and drive up bond yields, as investors demand a higher premium for the uncertainty of an unscripted Fed. Traders would no longer have the luxury of perfectly timed rate cut expectations. Instead, they would be forced to closely monitor real-time economic indicators—wage growth, supply chain bottlenecks, and capital expenditure trends—to anticipate monetary policy adjustments. This represents a return to fundamental investing. As noted by The Economist in a recent briefing, stripping away the Fed’s vocal safety net could ultimately create a more resilient financial system, one less prone to the speculative bubbles that form when borrowing costs are transparently guaranteed.
For policymakers, adopting Warsh’s approach would require immense institutional discipline. Central bankers are naturally inclined to manage expectations. Stepping back to the podium and saying less during a crisis runs contrary to modern political instincts. Yet, for businesses and citizens, a quieter Fed might actually be a more effective one. When the central bank constantly shifts its rhetoric to manage daily market sentiment, it risks losing the public’s trust. A Fed that speaks rarely, but acts decisively, projects a far greater sense of authority than one that issues a 3,000-word justification for every 25-basis-point move.
The push for a quieter Federal Reserve is not without its fierce detractors. Many prominent economists and former policymakers argue that retreating from the current communication framework would be a catastrophic step backward. The modern era of monetary policy transparency was hard-won, largely driven by Ben Bernanke’s desire to democratise the institution and prevent the kind of market panic that occurs when investors are caught entirely off guard.
Defenders of the status quo argue that forward guidance is not just a communication strategy; it is an active monetary policy tool. When short-term interest rates hit zero, as they did after 2008 and again in 2020, the Fed’s only remaining lever to stimulate the economy was the promise to keep rates low for a prolonged period. Abandoning this tool deprives the central bank of crucial ammunition during a severe downturn. A working paper from the Brookings Institution defends the dot plot, noting that while it is imperfect, it successfully lowers long-term bond yields during crises by anchoring public expectations.
Furthermore, critics of Warsh note that financial markets are vastly more complex and interconnected today than they were in the 1990s. The idea that markets will efficiently discover prices without central bank guidance ignores the reality of modern algorithmic trading, which can trigger cascading liquidity crises in the absence of clear institutional signals. From this perspective, the Fed’s verbose explanations are a necessary public utility, preventing systemic shocks by ensuring all market participants have equal access to the central bank’s baseline assumptions.
The debate over the Federal Reserve’s communication strategy is ultimately a debate about the limits of economic forecasting and institutional humility. Warsh’s critique cuts to the heart of a modern technocratic fallacy: the belief that if you simply explain a complex system in enough detail, you can control its outcome. The reality of the past few years—marked by transitory inflation narratives that proved dramatically wrong—suggests that excessive transparency can sometimes resemble institutional hubris.
By pre-committing to future actions, the Fed has traded long-term credibility for short-term market placation. Whether the institution will willingly surrender the microphone remains to be seen. But the argument for doing so is gaining traction among those who remember a time when central banks commanded respect not by forecasting the future, but by acting decisively when the future arrived. Silence, in the realm of central banking, may soon be a premium asset.
Discover more from The Economy
Subscribe to get the latest posts sent to your email.
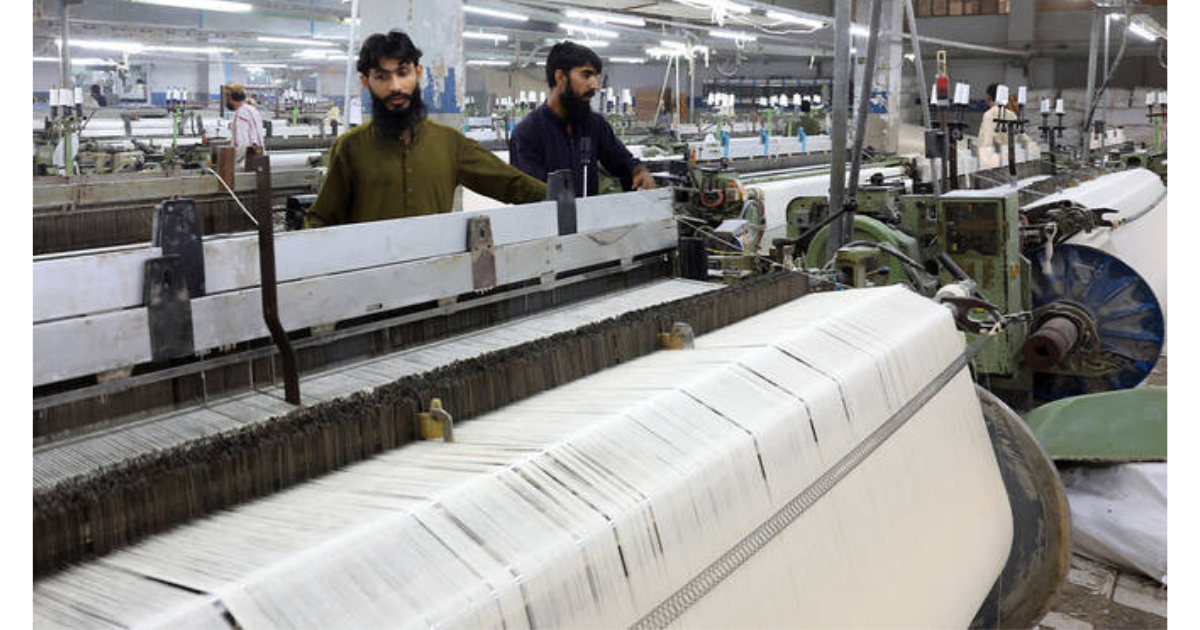
On June 12, Finance Minister Muhammad Aurangzeb stood before the National Assembly and did something Pakistan’s textile exporters had wanted for two years: he cut the advance tax on export proceeds from two percent to 1.25 percent. Forty-eight hours later, the Pakistan Textile Exporters Association called the FY27 budget “balanced and growth-oriented” — unusually warm language from a lobby that has spent the last two budget cycles describing its tax bill as existential. The applause came with a footnote, though. The industry’s oldest and loudest demand — restoration of the Final Tax Regime — still wasn’t granted.
The reaction fits a familiar pattern. Pakistan’s Rs18.77 trillion federal budget for 2026-27, presented under IMF-monitored fiscal targets and a four percent GDP growth ambition, handed exporters a mixed basket: a lower advance tax, an abolished Export Development Surcharge, and a sharply cheaper Export Facilitation Scheme financing rate. None of it touches the structural grievance that has defined textile-sector advocacy since 2024, when exporters were pulled out of the Final Tax Regime and pushed into the Normal Tax Regime — a shift business leaders in Karachi say replaced a flat, one-time levy with a system of assessments, audits and disputes. The stakes are large. Pakistan’s effective tax burden on exporters now runs to 68.27 percent, against a corporate tax rate of roughly 20 percent in Vietnam — the country Islamabad most often cites as the competitor it’s losing ground to.
The Final Tax Regime (FTR) was a system under which tax withheld on export proceeds — historically one percent — represented an exporter’s entire income tax liability for that revenue, with no further assessment, audit or year-end reconciliation required. Exporters were moved out of the FTR and into the Normal Tax Regime under the Finance Act 2024.
What the FY27 Budget Actually Gives Pakistan’s Textile Sector
For Pakistan’s textile sector, the FY27 budget reads less like a single sweeping reform than a bundle of smaller concessions, each aimed at a specific complaint exporters have raised for years. The headline measure is the cut to the advance tax on export proceeds, down from two percent to 1.25 percent. Crucially, though, it remains a minimum tax rather than a final one — exporters stay inside the Normal Tax Regime and still face year-end reconciliation, audits and the possibility of additional liability if their actual tax bill exceeds what’s withheld at source.
On the super tax, the government went further than most analysts expected. Aurangzeb told reporters at the post-budget press briefing that the levy would be abolished outright for “all exporters,” on the instructions of Prime Minister Shehbaz Sharif. Separately, businesses earning between Rs150 million and Rs500 million annually will see the super tax scrapped entirely, while firms above that threshold get a cut from 10 percent to eight percent. State Minister for Finance Bilal Azhar Kiyani later confirmed that the advance tax cut and the super tax changes were the “primary demands” of exporters and the formal industry — and that the government had heard the concerns of business chambers across the country.
The Export Facilitation Scheme, the mechanism that lets exporters bring in inputs duty-free against future shipments, also got considerably cheaper. The mark-up rate attached to EFS financing fell from 19 percent to 4.5 percent, and the government layered on an additional Rs70 billion subsidy for the Export Refinance Scheme — what Aurangzeb described as taking the scheme “to a different level.” The 0.25 percent Export Development Surcharge, a levy that PTEA Vice-Chairman Ameer Ahmad had specifically flagged as a drag on liquidity, was eliminated entirely.
The budget reached beyond exporters too, in ways that still touch firms with international receivables. The Capital Value Tax on holding foreign assets is proposed for abolition, and the withholding tax on international transactions made through debit and credit cards drops from five percent to 0.5 percent — a change aimed primarily at consumers but one that also trims costs for exporters who routinely pay for software subscriptions, trade-show travel and overseas sourcing trips on corporate cards.
Taken individually, none of these measures rewrites the sector’s economics. Taken together, PTEA Chairman Sohail Pasha argued they would strengthen investor confidence, encourage business expansion and generate employment — benefits he said would eventually filter down to lower-income households. It’s the kind of statement that would have been unthinkable from PTEA a year ago.
Final Tax Regime vs Normal Tax Regime: Why Exporters Still Want Out
What Is the Final Tax Regime for Pakistani Exporters?
The Final Tax Regime (FTR) was a system under which tax withheld on export proceeds — historically one percent — represented an exporter’s entire income tax liability for that revenue, with no further assessment, audit or year-end reconciliation required. Exporters were moved out of the FTR and into the Normal Tax Regime under the Finance Act 2024.
That single change explains most of the noise coming out of Karachi, Faisalabad and Lahore over the past month. Under the old system, an exporter who shipped $1 million of fabric paid the withholding tax on that shipment and was done. Under the new one, that same withholding tax is treated as a minimum — the exporter still files a full return, still faces FBR scrutiny on deductions and input costs, and still risks a higher final liability depending on margins, financing costs and a dozen other variables that have nothing to do with the export transaction itself.
Businessmen Group Chairman Zubair Motiwala and Karachi Chamber of Commerce President Rehan Hanif made the case bluntly ahead of the budget: the 2024 shift, they argued, was a short-term revenue measure that didn’t account for its effect on exports, investment, employment or, ultimately, the revenue collection it was meant to protect. They called for the FTR to be restored for all exporters at a flat rate of one percent.
The arithmetic behind that demand isn’t abstract. Pakistan’s textile sector carries an effective tax burden north of 68 percent, once advance taxes, withholding obligations and energy surcharges are stacked together — a figure that dwarfs the headline corporate rates exporters compete against in Vietnam, Bangladesh and India. Energy costs compound the gap: Pakistani manufacturers routinely cite per-unit electricity prices roughly double those paid by competitors across the border. None of the FY27 measures — not the advance tax cut, not the super tax abolition — change that underlying structure. They reduce the bill. They don’t change the regime.
That’s the distinction the All Pakistan Textile Mills Association has been pressing hardest in its own 20-point budget submission, which goes well beyond the FTR question alone. APTMA wants zero-rating restored across the textile value chain, refund processing compressed to 48 hours under the FASTER system, and the discretionary power to suspend or blacklist taxpayers stripped from field-level FBR officers entirely. Its own estimate is striking: clearing the refund backlog alone could unlock $3 billion to $4 billion in additional annual export capacity — a figure large enough that, if even roughly accurate, would rank among the cheapest stimulus measures available to a government chasing a four percent growth target.
What the Budget’s Silence on FTR Means for Pakistan’s Export Pipeline
The government’s choice — relief on rates and surcharges, silence on the regime itself — lands at a delicate moment. The Pakistan Textile Council told Prime Minister Shehbaz Sharif in a pre-budget letter that the country’s merchandise exports during the first 11 months of FY26 ran $1.66 billion below the same period a year earlier — a decline PTC Chairman Fawad Anwar called especially troubling given that global demand had, if anything, improved. His framing was pointed: stabilisation, he argued, isn’t the same thing as growth, and Pakistan’s next phase has to be built on exports rather than further taxation of the export sector.
Set against that backdrop, the FY27 budget’s selective generosity becomes easier to read. The government didn’t forget about the Final Tax Regime — it kept it, intact, for a different sector entirely. The 0.25 percent FTR on IT export earnings, due to expire on June 30, 2026, was extended for three years to 2029 on the prime minister’s direction, after the IT Industry Association warned that letting it lapse would threaten Pakistan’s bid to reach $15 billion in IT exports by 2030. The contrast is hard to miss: one export sector kept its predictable, one-line tax treatment, while the other got a rate cut inside a system its own representatives say generates exactly the disputes and delays the FTR was designed to avoid.
For textile exporters, the practical effect over the coming quarters will likely hinge less on the headline rates than on execution — whether the Rs70 billion EFS subsidy actually reaches mills at the 4.5 percent rate without the bureaucratic friction that has historically diluted such schemes, and whether the Rs327 billion in pending sales tax refunds start moving anywhere near the 72-hour statutory window APTMA has demanded. If refunds remain stuck at three to six months, the liquidity benefit of a lower advance tax gets absorbed almost immediately. Working capital freed up in one place simply gets retied in another.
There’s a financing-cost dimension to this too, and it compounds quickly. Industry participants describe textile mills as operating on EBITDA margins in the low single digits. At that level, the gap between paying mark-up at 19 percent versus 4.5 percent on EFS financing isn’t a marginal improvement. For mills running on tight contract margins with buyers in Europe and North America, it can be the difference between an order book that clears and one that doesn’t.
Textile’s relatively warm reception looks even more notable set against how other sectors read the same budget. The Pakistan Poultry Association said it had received no meaningful relief at all, warning that continued taxes on inputs — including a federal excise duty on every day-old chick and an 18 percent sales tax on processed chicken — would push up prices, discourage investment in modern processing and weaken food security. Plastic manufacturers voiced similar complaints about policy inconsistency. Against that backdrop, a sector that secured a super tax exemption, a cheaper EFS and an abolished surcharge came out comparatively well — even if its central ask went unanswered.
The Dissenting View: A Budget Without an Export Roadmap
Not every business body shared PTEA’s enthusiasm, and even among exporters, the welcome came qualified. FPCCI President Atif Ikram Sheikh acknowledged the macro picture had genuinely improved — GDP growth of 3.7 percent, a fiscal deficit down to 0.7 percent of GDP, and a 23 percent fall in public debt-servicing costs — but he was unambiguous about the FTR decision. He criticised the government’s choice not to restore it, arguing that converting the withholding rate into a minimum tax still leaves exporters inside the normal tax framework they’ve spent two years trying to escape.
Other voices went further, framing the entire budget as directionless on industry. Beyond textiles, business leaders across sectors offered only a cautious welcome to the budget overall, describing the relief as selective and warning that elevated energy costs would continue to constrain growth regardless of tax tweaks. The Businessmen Group’s pre-budget warning — that the 2024 shift to the Normal Tax Regime had already proven damaging to exports, investment, employment and revenue alike — reads, in hindsight, like a forecast the FY27 budget only partially answered.
Yet there’s a steel-man case for the government’s approach. Pakistan is mid-program with the IMF, revenue targets are binding, and a wholesale return to the FTR — which effectively caps tax liability regardless of an exporter’s actual profitability — is exactly the kind of revenue-narrowing measure the Fund’s conditions are designed to discourage. Cutting rates while holding the structure constant may simply be the only politically available middle ground between what the Fund wants and what the lobby is asking for.
A Budget That Splits the Difference
What the FY27 budget ultimately reveals isn’t a government turning against its export sector. It’s a government negotiating between two creditors it can’t fully satisfy at once. The IMF wants a broader, more enforceable tax base; the textile lobby wants the predictability that only a final, one-line levy can provide. Aurangzeb’s package splits the difference: real money moves toward exporters, but the architecture both the FPCCI and APTMA say is the actual problem remains untouched.
PTEA’s warm reception suggests relief, after two punishing years, is being taken wherever it can be found. APTMA’s 20-point list and the Businessmen Group’s renewed FTR demand suggest the sector isn’t done asking for the rest. Whether Pakistan gets its $3 billion to $4 billion in unlocked export capacity from faster refunds, or simply absorbs another year of 68 percent effective taxation with marginally better numbers, depends on decisions that never made it into this budget speech at all.
Discover more from The Economy
Subscribe to get the latest posts sent to your email.

The confrontation usually happens behind closed glass doors in a bustling DIFC high-rise or a crowded Deira trading office. Voices rise, tempers fracture, and the ultimate corporate sanction is delivered in a single, heated sentence: “You are done—clear your desk.”
For the expatriate professional, the immediate aftermath is a cocktail of adrenaline and panic. In an economy where your residency, your bank accounts, and your family’s legal status are inextricably chained to your employment contract, a sudden dismissal is not just a career setback. It is an existential threat.
But legal reality in the Emirates operates on a strictly documented basis. If you are fired verbally in the UAE, the termination is effectively an illusion in the eyes of the state. The Ministry of Human Resources and Emiratisation (MoHRE) does not recognize heat-of-the-moment outbursts. They recognize paper, digital signatures, and registered post.
What follows is an examination of why the spoken word carries zero weight in UAE termination proceedings, and how the absence of a formal, written notice legally arms the employee while exposing the employer to severe financial penalties.
The Macro Landscape of UAE Labour Reform
To understand why documentation is treated with such uncompromising severity, one must look at the structural pivot the Emirates has executed over the past five years. The nation is aggressively transitioning from a transient, tax-free waystation into a permanent, highly regulated global knowledge economy.
This ambition requires a predictable, transparent legal framework. Foreign direct investment and top-tier global talent do not flow into jurisdictions where executives can be dismissed on a whim without procedural fairness. Recognizing this, the federal government entirely overhauled its labor architecture. On February 2, 2022, Federal Decree-Law No. 33 of 2021 came into effect, representing the most sweeping transformation of workplace regulations in the country’s history.
The new legal framework effectively dismantled the remnants of the old sponsorship mentalities, replacing them with fixed-term contracts and strict procedural mandates. It was designed by Minister of Human Resources Dr. Abdulrahman Al Awar to align the UAE with OECD labor standards, ensuring that both capital and labor operate on a balanced, predictable playing field.
A central pillar of this new framework is the formalization of the termination process. The state demands visibility into the ending of an employment relationship because that ending triggers a cascade of bureaucratic events: visa cancellations, the calculation of end-of-service gratuities, and the repatriation of foreign workers. When an employer attempts to bypass this with a verbal firing, they are not just breaking a corporate rule. They are disrupting the state’s regulatory apparatus.
The Core Development: Why the Spoken Word Fails
When examining the mechanics of dismissal, the primary question must be answered directly. Can an employer fire you without written notice in the UAE?
Under UAE Labour Law, an employer cannot legally fire you without written notice. A verbal dismissal is legally invalid and is heavily presumed by labour courts to be an “arbitrary dismissal.” To terminate a contract legally, the employer must provide formal written notice that explicitly states the reasons for termination, initiating the statutory notice period of 30 to 90 days.
This requirement is not a mere administrative suggestion. It is the absolute bedrock of the termination process.
If a manager tells you to leave the premises and not return, they have committed a critical procedural error. Without a written letter detailing the termination, the employment contract remains entirely active. You are still legally employed. Your salary continues to accrue. Your visa remains valid.
The danger for the employee in this scenario is accidental abandonment. If you take the verbal command at face value, pack your belongings, and stop coming to the office, the employer can legally pivot and accuse you of absconding. Under Article 50 of the Labour Law, unjustified absence for seven consecutive days allows an employer to terminate the contract without notice and potentially withhold end-of-service benefits.
This creates a perilous trap for the uninformed worker. The employer shouts a dismissal, the employee complies by staying home, and the employer then files an absconding report with MoHRE, framing the victim as the violator.
To neutralize this threat, the legally literate employee must force the issue into the written record. If dismissed verbally, you must immediately send an email to HR and upper management. The communication should be polite, strictly factual, and timestamped. It should state: “Following our conversation this morning where I was verbally instructed to leave the premises and end my employment, I am writing to request my formal, written notice of termination as required by UAE Labour Law, outlining the reasons for my dismissal and the start date of my notice period. Until I receive this, I remain ready and willing to fulfill my contractual duties.”
This single email shifts the entire legal burden back onto the company. It proves you have not absconded. It proves you are willing to work. And it creates a permanent digital paper trail that a labor court judge will rely upon when the dispute inevitably escalates.
The Analytical Layer: Arbitrary Dismissal and Compensation
Moving beyond the immediate mechanics of the firing, we must examine how UAE courts interpret a lack of documentation. The judicial system is remarkably consistent on this point: a failure to provide written notice is the fastest route to an employer losing a labor dispute.
When an employer terminates a contract without a valid, documented, and legally permissible reason, it qualifies as arbitrary dismissal under Article 47 of the law. The financial consequences for the company are severe.
If the labor court determines the dismissal was arbitrary—which a purely verbal firing almost guarantees—the employer can be ordered to pay up to three months of the employee’s total salary as compensation. This is entirely separate from, and in addition to, the standard end-of-service gratuity, pending unpaid salaries, and payment in lieu of the unserved notice period.
For a mid-level executive earning 40,000 AED a month, a careless verbal firing by a hot-headed manager can instantly create a legal liability of over 120,000 AED for the company, before even calculating standard severance.
The courts demand strict evidence of poor performance or gross misconduct to justify a termination. If the employer claims the verbal firing was the result of the employee’s incompetence, the court will demand to see the paper trail. Where are the written warnings? Where are the performance improvement plans? Under the UAE’s progressive disciplinary system, an employer must issue formal warnings before moving to termination.
A sudden, undocumented dismissal tells the court that no such disciplinary process occurred. It signals an impulsive, retaliatory, or discriminatory firing.
Yet, the legal landscape is not entirely uniform. The rules shift depending on your precise geographic jurisdiction within the Emirates. While the mainland operates strictly under MoHRE regulations, free zones like the Dubai International Financial Centre (DIFC) and Abu Dhabi Global Market (ADGM) operate their own English common law court systems.
The DIFC Employment Law (Law No. 2 of 2019) is similarly strict regarding written documentation, but it removes the specific concept of “arbitrary dismissal” compensation in favor of strict contractual adherence and a mandatory penalty for late payment of final settlements. Regardless of the zone, the universal truth remains: verbal instructions to leave the company are legally toxic.
Downstream Consequences: Visas, Banking, and Survival
The insistence on written notice extends far beyond the walls of the HR department. In the UAE, your employment contract is the central node of your financial and social existence. Severing it has immediate, profound downstream effects.
First is the matter of banking. UAE financial institutions are notoriously swift to act when an employment relationship ends. Under the terms of most personal loans, car loans, and credit cards in the Emirates, the bank holds a lien on the employee’s end-of-service gratuity. When a company eventually processes a final settlement, it is legally obligated to mark the transfer as a “final payment.”
This coding acts as an automated tripwire for the bank. If you have outstanding debt, the bank may instantly freeze your accounts to secure the funds, demanding proof of a new job before releasing the capital. A verbal firing delays and confuses this entire process. If you are locked in a multi-month labor dispute over a verbal dismissal, your salary stops arriving, but your final settlement is delayed by litigation. This leaves the expatriate in a financial vacuum, unable to service local debt and at risk of criminal bounced-cheque cases.
Second is the visa grace period. Historically, losing your job in the UAE meant you had exactly 30 days to exit the country or find new employment. The resulting panic often forced highly skilled workers to accept substandard jobs simply to maintain their residency.
The government explicitly recognized this as a drag on economic stability. Recent reforms have fundamentally changed the residency landscape. Today, depending on your skill tier, reforms implemented by the UAE cabinet allow grace periods of up to 180 days after a visa is officially cancelled.
But this grace period only begins when the visa is legally cancelled by MoHRE, a process that requires a formal, signed termination and a signed settlement document. A verbal firing leaves the employee in bureaucratic purgatory. You cannot start a new job because your current visa is still active. You cannot access the 180-day grace period because you haven’t been legally terminated. You are a ghost in the system.
This is why compelling the employer to issue a written termination letter is the vital first step. It starts the clock. It triggers your legal entitlements. It forces the bureaucratic gears to turn, allowing you to transition your visa, secure your funds, and remain in the country legally while you plot your next move. According to recent demographic data, expatriates make up over 88% of the UAE’s population, and ensuring their frictionless transition between roles is a stated macroeconomic priority for federal policymakers.
The Employer’s Defense: Burden and Reality
To present a complete picture, we must examine the reality from the employer’s perspective. Why do verbal firings still happen in a jurisdiction that punishes them so severely?
The defense often centers on the administrative burden placed upon small and medium enterprises (SMEs). In a fast-paced trading environment or a high-turnover retail business, managers often view the strict procedural requirements of MoHRE as incompatible with the daily realities of running a business.
When an employee commits a serious breach of trust—perhaps suspected theft, violent behavior, or catastrophic negligence—the immediate instinct of a business owner is to remove the threat from the premises. Drafting formal letters, initiating 30-day notice periods, and scheduling HR meetings feels agonizingly slow when the business is actively bleeding capital or facing reputational damage.
Legal advocates for employers argue that the current system is occasionally exploited by underperforming employees. A poorly performing worker who knows the law can sometimes weaponize the procedural requirements, using a minor technical misstep by the employer—like a verbal outburst by a stressed manager—to extract an arbitrary dismissal settlement.
That said, the law does provide an escape valve for employers in genuine crisis. Article 44 of the Labour Law outlines ten specific scenarios where an employer can terminate an employee instantly, without notice and without end-of-service benefits. These include submitting forged documents, failing to perform basic duties despite written warnings, revealing corporate secrets, or being found drunk at work.
Crucially, however, even an Article 44 dismissal requires a written investigation and a formal letter stating exactly which clause the employee violated. The state grants the employer the power to fire instantly for gross misconduct, but it refuses to waive the requirement for a written record.
Furthermore, courts are highly skeptical of Article 44 dismissals. Employers who attempt to use it to bypass notice periods often find themselves brutally cross-examined by labor judges. If the employer fails to provide an airtight, documented investigation proving the gross misconduct, the court will automatically revert the case to an arbitrary dismissal, handing the victory to the employee.
The burden of proof rests entirely on capital, not labor. In a region historically criticized by international rights organizations for favoring corporate power, the contemporary UAE labor court is surprisingly, structurally biased toward the worker when documentation is absent.
Synthesis: The Value of the Paper Trail
The UAE’s labor market has matured at a staggering pace. It has evolved from a deeply asymmetrical system into a highly codified, internationally competitive legal arena. In this modern landscape, verbal instructions regarding employment status are not just unprofessional; they are legally non-existent.
For the employer, yielding to anger and verbally dismissing a worker is an unforced error that invites catastrophic financial penalties and protracted litigation. It turns a simple staffing change into an arbitrary dismissal claim that the company is mathematically likely to lose.
For the employee, understanding this framework is the ultimate shield against corporate abuse. The moment a manager attempts to end your livelihood with spoken words, the power dynamic actually inverts. By refusing to abscond, calmly demanding written notice, and maintaining a meticulous digital trail, the worker traps the careless employer in the strict machinery of federal law. In the UAE, the loudest voice in the room never wins the labor dispute. The victor is always the one holding the paperwork.
Discover more from The Economy
Subscribe to get the latest posts sent to your email.

Anthropic AI Model Freeze: White House Halts Claude 4 Deployment Over National Security

The Global Economy Is Threatened Again by Trade Imbalances

The £4m Lifeboat: Why the Treasury is Treating SME Debt as a Structural Contagion

Kevin Warsh Wants the Fed to Stop Explaining Everything

UK Japan Investment Agreement: Inside the £18bn Deal

AI Fundraising Trends: Wall Street’s Record Capital Influx

China Tungsten Export Curbs: Is Japan’s AI Chip Supply at Risk?

Pakistan Textile Body Welcomes FY27 Budget, Seeks FTR

US Economic Resilience: Why the Economy Keeps Defying the Odds

Global Strategic Oil Reserves Depletion: The Empty Vaults

Dubai Consumer Protection: 155,000+ Inspections Secure Price Stability

18% Shipping Sales Tax Abolition Sparks Maritime Economy Growth

Bank Indonesia Rate Hike 2026: New Mandate’s First Market Test

The Silicon Silk Road: How Memory Chips Rewrote the Retail Map

China Overhauls the World’s Biggest Surveillance Network with Advanced AI

Kevin Warsh Takes the Fed’s Helm — and Walks Straight Into a Rate-Hike Storm

SpaceX, OpenAI & Anthropic IPOs: Wall Street’s $200B AI Test

SpaceX IPO: Inside the $2 Trillion Market Debut

How AI Is Forcing McKinsey and Its Peers to Rethink Pricing

KPMG Australia CEO Resigns After Whistleblower Claims Exposed Investigation Failures

Pakistan Budget FY 2026-27: Relief, Prospects, and the Tightrope Walk

Broadcom Market Value Loss: Revenue Forecast Disappoints

The Guardrails Are Down: How Meta and Google’s AI Models Fold Under Pressure

Is AI Already Putting Graduates Out of Work? The Grim Reality Facing the Class of 2026

Stock Market Correction Risk Mounts as Bond Yields Defy the Bull Case

Five PSX Stocks Worth Owning Before the Second Quarter Ends

Benefitbay Raises $18M to Build the Plumbing for America’s ICHRA Shift

China Warns of ‘Severe’ Global Conditions as Economy Shows Weakness
-

 Markets & Finance5 months ago
Top 15 Stocks for Investment in 2026 in PSX: Your Complete Guide to Pakistan’s Best Investment Opportunities
-

 Analysis4 months ago
Top 10 Stocks for Investment in PSX for Quick Returns in 2026
-

 Analysis4 months ago
Brazil’s Rare Earth Race: US, EU, and China Compete for Critical Minerals as Tensions Rise
-

 Banks5 months ago
Best Investments in Pakistan 2026: Top 10 Low-Price Shares and Long-Term Picks for the PSX
-

 Investment5 months ago
Top 10 Mutual Fund Managers in Pakistan for Investment in 2026: A Comprehensive Guide for Optimal Returns
-

 Analysis4 months ago
Johor’s Investment Boom: The Hidden Costs Behind Malaysia’s Most Ambitious Economic Surge
-

 Global Economy6 months ago
15 Most Lucrative Sectors for Investment in Pakistan: A 2025 Data-Driven Analysis
-

 Global Economy6 months ago
Pakistan’s Export Goldmine: 10 Game-Changing Markets Where Pakistani Businesses Are Winning Big in 2025