
Markets & Finance
Markets May Have Just Had Their Second “DeepSeek Shock”


US semiconductor stocks fell sharply in mid-July 2026 after a decline in chipmakers dragged the broader market lower, coinciding with growing reports that a new Chinese AI lab — reportedly named after a Pink Floyd album — is delivering competitive AI performance at a fraction of the cost of leading US models. The episode echoes the original “DeepSeek shock” of early 2025 and reflects a deeper structural trend: US businesses increasingly experimenting with cheaper Chinese AI models even as export controls tighten.
What Happened in the Markets
US stocks fell for a second consecutive session in mid-July 2026, with the S&P 500 losing 1.01% to close at 7,457.69 and the Nasdaq Composite dropping 1.4% to 25,520.24 as tech stocks came under renewed scrutiny (CNBC). For the week, the S&P 500 fell 1.6% and the Nasdaq slid 2.9%, with the VanEck Semiconductor ETF posting its third weekly decline in four weeks, down almost 9% over that period. Fortune’s coverage directly ties renewed market anxiety to “a Chinese AI lab named after a Pink Floyd album,” describing the episode as potentially markets’ “second DeepSeek shock” (Fortune).
Why “Second” Matters
The original DeepSeek shock, in early 2025, saw the Chinese startup demonstrate AI performance comparable to leading US models while relying on less advanced semiconductor hardware — a direct consequence of Chinese labs adapting to US export restrictions through aggressive software optimization, including model compression, sparse computation, and custom low-level code that squeezed more capability out of constrained hardware (Binaryverse AI reporting). That episode triggered a sharp repricing of the assumption that US chip export controls could reliably constrain Chinese AI progress.
A second such episode in 2026 would reinforce a thesis many analysts have been reluctant to fully price in: that software-side innovation in China is proving more durable and more replicable than a one-off event, and that the gap between US and Chinese AI capability — measured in practical deployed performance rather than raw compute access — may be narrower and more persistent than export-control policy assumes.
The Cost Angle Is the Real Story
Fortune’s broader coverage of the moment highlights a parallel trend that may matter more commercially than the headline model comparison: businesses are experimenting with cheaper Chinese AI models specifically because US rivals are getting more expensive (Fortune). If enterprise AI adoption increasingly bifurcates along a cost axis — with Chinese models capturing price-sensitive use cases globally — that has direct implications for the pricing power and market share assumptions embedded in US AI company valuations.
The Export Control Backdrop
This is unfolding against Washington’s January 2026 tightening of AI chip export rules, which introduced new total processing power (TPP) thresholds for chips destined for China, alongside 25% tariffs, 50% volume caps and mandatory US-based testing for the narrow band of chips still eligible for case-by-case licensing (Informed Clearly). The persistence of competitive Chinese AI output despite these restrictions raises the same question the original DeepSeek episode raised in 2025: are export controls constraining capability, or primarily constraining the hardware pathway to capability while leaving the software pathway open?
Key Takeaways
- A new Chinese AI lab has triggered renewed market anxiety, contributing to a multi-week decline in US semiconductor stocks through mid-July 2026.
- The episode is being compared directly to the original 2025 DeepSeek shock, which demonstrated that Chinese labs could match US AI performance despite chip export restrictions.
- US businesses are increasingly adopting cheaper Chinese AI models as domestic alternatives become more expensive, a commercially significant trend beyond the headline capability comparison.
- The recurrence of this pattern raises fresh doubts about whether hardware-focused export controls can durably constrain Chinese AI progress.
Discover more from The Economy
Subscribe to get the latest posts sent to your email.


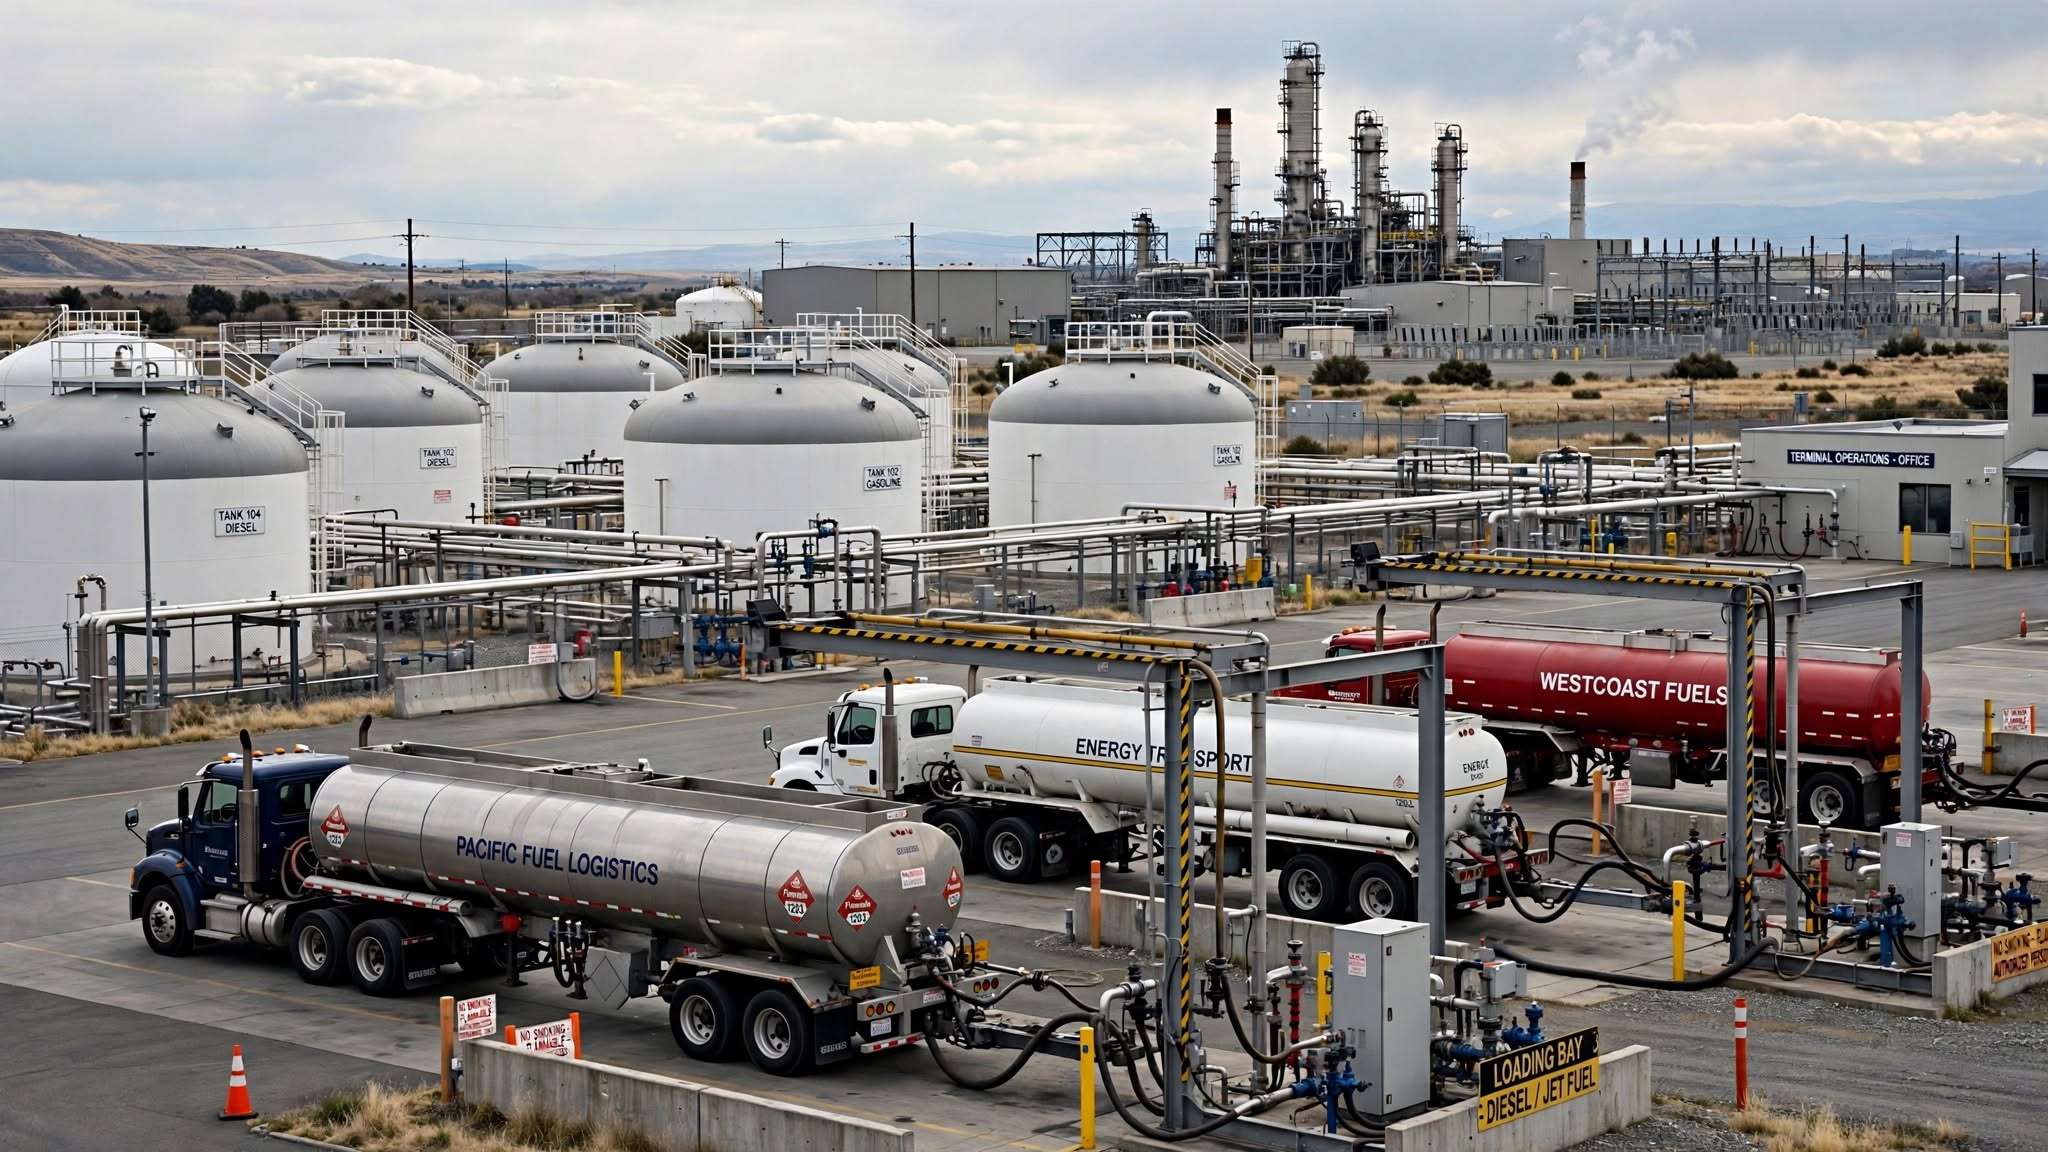
Crude prices and diesel prices follow related but different supply chains. Refinery capacity, transport and product inventories help explain the gap. Original research October 12; updated October 15, 2026. Verify newer developments before publication.
Reuters reported on October 15 that ongoing conflict and maritime disruptions continue to influence oil and energy prices. Avoid equating a crude price change with an identical movement in retail diesel prices. Source. Historical material further below is contextual and must not be mistaken for a live quotation or price.
What changed since the original research cutoff
Reuters reported on October 15 that ongoing conflict and maritime disruptions continue to influence oil and energy prices. Avoid equating a crude price change with an identical movement in retail diesel prices. The publication date and observation time are crucial: market prices, competition results and government announcements cannot be extrapolated from an earlier snapshot. A more useful reader question is what remains current today and what requires verification at the moment of a financial or travel decision. The new development should be checked against the primary or contemporary reference rather than assumed from an older headline.
What is happening and why readers are searching
Energy prices are back near the center of the inflation debate in October 2026. Associated Press reporting on October 12 described elevated crude prices and market reactions to proposed Russian diesel purchases against the backdrop of international tensions. The existence of political announcements does not establish that contracted volumes have already arrived or reduced retail pump prices. Sources: Associated Press energy coverage and International Monetary Fund.
The important context competitors can overlook
Crude oil and diesel are related but different markets. Refineries need the right feedstock, sufficient capacity, suitable shipping routes and compliance with regulations. A region can have adequate crude yet experience tight middle-distillate supply because of refinery disruptions, inventory shortages or freight bottlenecks. Trucking, agriculture and industrial logistics transmit fuel costs into goods prices with different time lags. For primary-source checks and current reporting, see Associated Press energy coverage and World Trade Organization. The key distinction is separate crude headlines from finished fuel supply.
A practical way to use this information
Follow refinery output, diesel inventories, freight costs and wholesale spreads alongside Brent and WTI. For consumers, compare a weekly average fuel price with the prior month rather than inferring national inflation from one service station. For businesses, test whether fuel surcharges are formula-based or discretionary. The honest answer to “will diesel get cheaper?” depends on both delivered product supply and demand.
Why lower crude does not always mean cheaper diesel
| Link in the chain | Potential bottleneck | What to watch |
|---|---|---|
| Crude extraction | Disruption or policy limits | Delivered crude availability |
| Transportation | Tanker capacity and insurance | Freight and route costs |
| Refining | Unit outages and product mix | Diesel output and margins |
| Distribution | Storage, taxes and local supply | Wholesale-to-retail lag |
A political agreement may improve expectations before physical shipments change inventories. This is why fuel inflation coverage should distinguish a possible future supply release from barrels or diesel cargoes actually received.
What to verify before making a decision
The right next step is to identify the source, timestamp and applicable market or jurisdiction. Check whether a number is a historical observation, official announcement, target, forecast or scenario. If you intend to act financially, legally or commercially, use the relevant provider’s current terms and obtain professional advice where appropriate. The sources cited here establish context; they are not a substitute for live prices, individual eligibility checks or binding agreements.
Reader questions
Is diesel price the same as oil price? No. Refining capacity, product inventories, shipping and local taxes create substantial differences.
Do policy announcements lower pump prices immediately? Not necessarily; delivery timing and wholesale markets determine pass-through.
Crude oil and diesel are connected—but not the same commodity
Crude oil is a refinery input, while diesel is one of several refined fuels that emerge from processing it. A change in the crude benchmark affects refiners’ input costs, but the price of diesel also depends on local refinery capacity, maintenance, fuel specifications, product inventories and transport availability. A refinery can have access to crude and still be unable to produce enough diesel for its market. Conversely, a region with healthy diesel inventories may see pump prices respond more slowly to an international crude rally. This is why headlines about a political agreement to increase crude supply should not automatically promise immediate relief to truck drivers.
The difference between the selling price of a refined product and its crude input cost is often discussed through a refining margin or crack spread. These spreads fluctuate as product demand and refinery utilization change. They can rise sharply when product supply is constrained even if crude prices soften. For readers, a graph of Brent oil alone cannot explain every regional diesel price move. Look for product-level benchmarks and inventory data alongside the crude quotation.
How a fuel shock enters broader inflation
Fuel costs affect more than motorists. Trucks carry food, building materials and consumer goods; farm machinery uses diesel; ships and industrial users depend on related refined energy products. Higher transport costs can flow into freight contracts and eventually shelf prices, but the timing depends on contract terms, profit margins and competition. Airlines typically face jet-fuel costs rather than road-diesel costs, so a service article should not present every transport sector as using the same product. Households also respond differently depending on commuting needs and heating arrangements.
An energy shock can affect headline inflation quickly through direct fuel prices, while broader price pressure may take longer. Central banks often distinguish volatile energy components from measures intended to capture underlying inflation, but persistent energy increases can influence expectations and wage negotiations. Reporting should describe the channels without claiming a specific change in CPI before the statistics agency releases its measured result.
Four scenarios for October’s energy market
First, an announced supply deal may be implemented and deliver usable fuel after shipping, payment and compliance arrangements are complete. Second, the deal may be delayed or revised, leaving near-term product shortages unresolved. Third, refinery disruptions or shipping bottlenecks may offset additional crude availability. Fourth, weakening economic demand could reduce consumption even while geopolitical risks remain elevated. In each case, the direction of the crude price, diesel price and pump price may differ. A scenario is a tool for reasoning, not an assertion that an event has occurred.
The distinction is especially important when headlines mention a government statement or preliminary agreement. A political declaration is not physical delivery; a cargo nomination is not necessarily a completed arrival; and the arrival of crude is not itself the production of road-ready diesel. For verification, identify the party making the statement, the product and volume involved, the destination, the delivery window and any relevant sanctions or trade restrictions.
What businesses can do about fuel exposure
A delivery company can examine route optimization, fleet efficiency and whether fuel surcharges fairly reflect current costs. A manufacturer can review freight contracts, supplier concentration and inventory policies. A small retailer should calculate how much of total expense is actually fuel-sensitive before raising prices across the board. Households may compare total travel costs, not just the pump-price sign. All these responses have tradeoffs: extra inventory ties up cash, and hedging instruments can create their own financial risks.
For investors, energy producers, refiners and transport companies can react very differently to the same headline. An oil producer may benefit from higher crude prices while an airline faces higher fuel costs. A refiner’s profitability can depend more on product margins than on crude’s absolute level. Sector labels should never substitute for analyzing actual business exposure.
A practical fuel-price monitoring dashboard
Compare Brent and WTI crude with regional diesel benchmarks, refinery utilization, relevant inventories, transport constraints and local tax structures. Date each observation and note whether figures are daily prices, weekly averages or monthly reports. The U.S. Energy Information Administration is a useful primary source for U.S. energy data. Official inflation releases help distinguish the impact on consumer prices from speculative claims about a future inflation wave.
A good oil-and-diesel article protects readers from two oversimplifications: that every supply announcement immediately changes retail prices, and that every increase in crude produces an identical change in diesel. The market has multiple stages, each with its own constraints and lags.
Discover more from The Economy
Subscribe to get the latest posts sent to your email.
TSMC reported record third-quarter revenue of approximately NT$1.49 trillion, up about 50% year over year. The key editorial question is how much optimism was already priced into shares. Source. Historical material further below is contextual and must not be mistaken for a live quotation or price.
What changed since the original research cutoff
TSMC reported record third-quarter revenue of approximately NT$1.49 trillion, up about 50% year over year. The key editorial question is how much optimism was already priced into shares. The publication date and observation time are crucial: market prices, competition results and government announcements cannot be extrapolated from an earlier snapshot. A more useful reader question is what remains current today and what requires verification at the moment of a financial or travel decision. The new development should be checked against the primary or contemporary reference rather than assumed from an older headline.
What is happening and why readers are searching
The AI boom increasingly looks like an industrial investment cycle rather than a story about chatbots alone. Reuters’ October 12 preview described expectations for another very strong quarter at TSMC, reflecting demand for advanced chips and packaging. The nuance matters: a foundry’s sales, a GPU supplier’s orders and a cloud operator’s eventual return on investment occupy different points in the chain. Sources: Reuters chip demand report and IREN fiscal results.
The important context competitors can overlook
Investors should distinguish model training hardware from inference demand, production capacity from booked orders, and one-time buildouts from recurring utilization. Advanced packaging, memory, power availability and data-center cooling can become bottlenecks even when silicon demand is strong. A boom in infrastructure spending is not automatically proof that every new capacity project will produce attractive cash returns. For primary-source checks and current reporting, see Reuters chip demand report and Reuters bond market analysis. The key distinction is connect chipmaker profits to supply-chain constraints.
A practical way to use this information
An evidence-led article should compare announced capital spending with actual deployments, gross margin trends, customer concentration and power constraints. Avoid ranking chip companies solely on price appreciation; a more useful framework examines whether a business captures durable economics as the cost of AI computation changes. Revenue forecasts must be dated and clearly identified as estimates.
Follow the money along the AI supply chain
A cloud company budgets for compute; a chip designer sells accelerators; a foundry fabricates the designs; memory and packaging suppliers help assemble deployable systems; and a data-center operator supplies space, cooling and power. Delays at any stage can push revenue recognition into a different quarter. The October 12 Reuters TSMC preview is a useful piece of the story, but not proof that all participants share equally in the profits.
The strongest follow-up article would compare order backlogs, capital intensity and gross margins across these stages rather than extrapolating from one supplier’s exceptional growth.
What to verify before making a decision
The right next step is to identify the source, timestamp and applicable market or jurisdiction. Check whether a number is a historical observation, official announcement, target, forecast or scenario. If you intend to act financially, legally or commercially, use the relevant provider’s current terms and obtain professional advice where appropriate. The sources cited here establish context; they are not a substitute for live prices, individual eligibility checks or binding agreements.
Reader questions
Why is TSMC important to AI? It manufactures advanced semiconductors used by major technology companies.
Can rising AI demand still hurt some investors? Yes. Heavy capital spending, valuation risk and financing costs can offset revenue growth.
Follow the hardware from design to deployment
An AI accelerator does not arrive in a functioning data center simply because a chipmaker announces high demand. Designers such as Nvidia develop chips and systems; contract manufacturers such as TSMC fabricate advanced semiconductors; packaging providers integrate critical components; memory suppliers deliver high-bandwidth memory; network equipment and power infrastructure complete the installation. Bottlenecks at any stage can prevent a customer from using purchased capacity on schedule. Investors who focus only on the most visible brand miss the economics and constraints of the suppliers behind it.
The supply chain is also geographically distributed. Semiconductor fabrication and advanced packaging involve specialized equipment and long qualification processes. A customer cannot necessarily replace one advanced production facility with another at short notice. This supports supplier bargaining power in some circumstances but can increase geopolitical and operational concentration risk. The right editorial question is which constraint is binding now, supported by current evidence, rather than assuming every part of the chain faces identical shortages.
Four numbers reveal more than a chip-sales headline
First, look at revenue by segment and how rapidly each segment is changing. Second, inspect gross margin to see whether pricing power and production efficiency are translating into earnings. Third, review capital expenditure and capital intensity: growth that needs enormous new factories has a different funding profile from growth on existing capacity. Fourth, compare customer inventories and order visibility where those details are disclosed. Rising shipments into warehouses are not equivalent to a sustainable rise in end-user consumption.
Companies report different financial calendars and currencies. A Taiwanese foundry’s monthly sales announcement may not align neatly with a U.S. semiconductor designer’s fiscal quarter. Foreign-exchange translation can distort comparisons. When an article uses quarter-on-quarter or year-on-year growth, make the period explicit and avoid mixing projected sales with realized earnings. A comparison table should describe the business model of each company as well as its latest relevant metric.
Why packaging, memory and electricity can limit AI growth
Advanced packaging connects processors and memory in dense, high-performance systems. Manufacturing these components at scale requires engineering expertise and expensive equipment. Even when enough compute chips are available, a shortage of qualified packaging or memory can delay completed systems. At the deployment site, customers need reliable grid connections, transformers, cooling and networking. An equipment delivery that arrives before the building is ready does not immediately create usable computing capacity.
Power availability is not a purely technological footnote. Electricity contracts can influence operating costs for years; permitting and interconnection queues can delay planned facilities. Investors evaluating a data-center project should distinguish contracted megawatts, physically energized capacity and servers generating billable workloads. Headlines often conflate those milestones. The gap between ordering equipment and earning revenue is a critical part of the investment risk.
How AI investment could disappoint without a collapse
One scenario is that software adoption grows but not fast enough to justify every planned data-center investment. Another is that demand remains high, but competition lowers the price customers pay per unit of computing. A third is that hardware improves quickly, making recent generations less economically attractive before they are fully depreciated. None implies that AI is useless; they describe how a useful technology can produce uneven shareholder returns. Telecom investment cycles offer an instructive reminder that demand growth and attractive capital returns are not identical.
The upside scenario also deserves fair treatment. If enterprises discover reliable, high-value applications and capacity becomes heavily utilized, recurring compute revenue could support continued equipment demand. Evidence would include contracted usage, improved utilization, margins and identifiable business outcomes—not just press releases announcing larger model sizes. Investors should evaluate multiple possibilities rather than extrapolate the best recent quarter indefinitely.
An AI infrastructure due-diligence sheet
For chip designers: note product mix, customer concentration, gross margin and potential restrictions on sales. For foundries: monitor leading-edge capacity, packaging constraints, yield trends and capital expenditure. For memory suppliers: distinguish conventional memory from advanced HBM demand. For cloud operators: track compute utilization, capital cost, customer retention and cash generation. For data-center developers: verify grid power, physical construction, commissioning and signed customer commitments.
Use earnings materials and regulatory filings from each company, supported by market coverage that distinguishes analyst estimates from actual results. A strong AI chip article can capture the excitement of the investment cycle without implying that all parts of the supply chain will prosper equally.
Discover more from The Economy
Subscribe to get the latest posts sent to your email.

A correction, a bear market and a crash describe different price events. No single indicator can reliably predict a market collapse; portfolio resilience is more actionable. Original research October 12; updated October 15, 2026. Verify newer developments before publication.
The October 14 inflation report contributed to a selloff in AI-linked equities. This is an observed sector decline, not proof that a broader crash is inevitable. Source. Historical material further below is contextual and must not be mistaken for a live quotation or price.
What changed since the original research cutoff
The October 14 inflation report contributed to a selloff in AI-linked equities. This is an observed sector decline, not proof that a broader crash is inevitable. The publication date and observation time are crucial: market prices, competition results and government announcements cannot be extrapolated from an earlier snapshot. A more useful reader question is what remains current today and what requires verification at the moment of a financial or travel decision. The new development should be checked against the primary or contemporary reference rather than assumed from an older headline.
What is happening and why readers are searching
A stock market crash is a scenario to prepare for, not an event that can be declared merely because a few technology stocks fall. Reuters reported on October 12 that the S&P 500’s 2026 advance was relatively narrow, with more than four in ten constituents down for the year even as the benchmark had gained. That is a market-breadth warning worth analyzing, but it does not by itself prove that a crash is imminent. Sources: Reuters market breadth and Reuters bond market analysis.
The important context competitors can overlook
Watch the relationship among corporate earnings, long-term Treasury yields, credit conditions and the durability of AI spending. Higher yields can pressure expensive growth shares by raising discount rates, yet resilient earnings can offset part of that effect. It is important to distinguish a routine pullback, an index correction and a systemic crisis. None is the same as an unavoidable recession, and exact timing forecasts are notoriously unreliable. For primary-source checks and current reporting, see Reuters market breadth and Investor.gov. The key distinction is turn fear-driven headline into evidence-led risk analysis.
A practical way to use this information
For a household, start with the financial plan: maintain cash needed soon, review whether holdings are excessively concentrated, check investment fees and avoid leveraged bets on a headline. A retiree drawing income has different exposure to early losses than a worker contributing for decades. Stress-test an illustrative decline, confirm how much would need to be sold, and document rebalancing rules before volatility arrives.
Crash risk or ordinary volatility? A four-part test
| Question | Evidence to gather | Why it matters |
|---|---|---|
| Is the weakness broad? | Number of stocks falling, sector breadth | A few giant companies can hide weaker participation |
| Is financing tightening? | Treasury yields and credit spreads | Borrowing stress can amplify selling |
| Are profits weakening? | Earnings revisions and guidance | Valuation may need to reset if cash flows disappoint |
| Is your plan fragile? | Near-term withdrawals and concentration | Personal exposure differs from market headlines |
The October 12 Reuters breadth report supports asking these questions, not publishing a certain crash date. Always specify what would falsify an alarming thesis.
What to verify before making a decision
The right next step is to identify the source, timestamp and applicable market or jurisdiction. Check whether a number is a historical observation, official announcement, target, forecast or scenario. If you intend to act financially, legally or commercially, use the relevant provider’s current terms and obtain professional advice where appropriate. The sources cited here establish context; they are not a substitute for live prices, individual eligibility checks or binding agreements.
Reader questions
Is there a confirmed market crash today? The cited October 12 evidence describes market concentration and risk, not a confirmed broad-market crash.
Which signal should investors watch first? No single metric works; consider breadth, earnings, funding conditions and your own time horizon together.
What would distinguish a correction from a crash?
Market vocabulary matters. A correction is commonly used to describe a broad decline of roughly 10% from a recent peak, while a bear market often refers to a fall of about 20%. “Crash” has no universally binding numerical definition; it often describes an unusually fast and disorderly fall. Those labels summarize price behavior but do not diagnose the economic cause. A 3% decline after a strong rally can feel alarming, especially in speculative stocks, yet it should not automatically be promoted as evidence that the entire market has entered crisis.
A more useful question is how many securities participate in a decline. Indexes weighted by company size can hide weakness beneath headline levels. When a handful of companies account for much of an index’s gains, weakness in smaller constituents may go unnoticed. Still, narrow breadth alone is not a reliable crash clock. It should be assessed together with earnings expectations, credit conditions, unemployment trends and funding-market stress. For real-time broad-market reporting, prefer clearly time-stamped sources such as Reuters.
Four risks investors can measure instead of guessing
Valuation risk: expensive shares can be vulnerable when projected growth disappoints or discount rates rise. Compare the valuation measure with realistic earnings scenarios rather than treating one ratio as a verdict. Concentration risk: calculate how much of a portfolio depends on a few stocks, industries or factors. Two funds can appear diversified while holding many of the same underlying companies. Liquidity risk: an investment may be difficult to sell near a quoted price during stress. Leverage risk: borrowed money and margin calls can turn an ordinary setback into a forced sale.
These risks interact. A portfolio concentrated in highly valued growth companies, financed partly with leverage, may be more fragile than a broadly diversified portfolio even if both posted similar returns last year. Conversely, a company with strong cash generation does not become risk-free merely because its balance sheet is healthy. Markets can reprice excellent businesses when required returns change. Good analysis distinguishes possible loss mechanisms from unsupported claims that a specific collapse is certain.
A stress test that does not require forecasting the market
Assume a household has $40,000 invested, needs $8,000 for tuition within nine months and can tolerate a temporary paper loss of $5,000. If a 20% market decline cut the account to $32,000, selling $8,000 for tuition would lock in a portion of the loss and leave less capital to recover. The important weakness is not the prediction of a 20% decline; it is using a volatile portfolio to fund a near-term unavoidable expense. A dedicated cash reserve can reduce that timing risk, though cash also has inflation and opportunity costs.
For longer-term savers, test the impact of several hypothetical market drops against current asset allocation and future contributions. Ask whether the household could maintain essential spending and avoid forced selling. This is more constructive than changing a retirement strategy in reaction to an intraday headline. It is also useful to review emergency liquidity, high-interest debt and insurance arrangements before increasing exposure to volatile investments.
Why an economic slowdown is not the same as a stock crash
GDP data, employment, consumer spending and corporate earnings influence markets, but share prices reflect expectations about the future. Stocks can fall ahead of a recession, rise while the economy is still weak or remain volatile without a recession occurring. Monetary policy can affect both discount rates and borrowing costs; its influence is important but not mechanically predictable. Financial news should not confuse a large move in Treasury yields with a confirmed default, or a disappointing earnings report with proof of an economy-wide breakdown.
Investors should separate observations from hypotheses: “credit spreads widened” is measurable; “credit spreads guarantee a crash next month” is speculative. Charts become more trustworthy when they show units, beginning and ending dates, and data sources. A scary percentage without a reference period may exaggerate or disguise risk.
Questions to ask before making portfolio changes
- What is the time horizon for this money and what spending does it need to cover?
- How concentrated is the portfolio in equities, technology or a single employer?
- Is there borrowing, margin exposure or a short-term cash obligation?
- Did the market move because of confirmed data, policy news or unverified speculation?
- Would a proposed trade still make sense if the market recovered tomorrow?
A clear checklist cannot eliminate losses. It can, however, keep a stressful search for “stock market crash” from turning into a decision based on a sensational headline alone.
Discover more from The Economy
Subscribe to get the latest posts sent to your email.

Treasury Yields and Inflation 2026: What Bond Moves Mean for Borrowers

Social Security COLA 2027 Is 3.6%: Payments, Examples and Dates

Ukraine’s Oil Strike Strategy: Can It Break Russia’s War Economy?

Power Grid Emergency Across 13 States? What the October 2026 PJM Order Actually Says

Oil Prices October 2026: Iran Conflict, Shipping and Inflation Risks

TSMC Stock in October 2026: AI Chip Demand, Earnings and Valuation Risks

Stock Market Crash 2026: What the Inflation and AI Selloff Means

Student Loans and the 2026 Midterms: SAVE Plan Deadlines and Borrower Choices

KOSPI Crash October 2026: What Korea’s Chip Selloff Reveals

CoreWeave Stock 2026: CRWV, AI Infrastructure Debt and the Selloff Explained

OP-ED:The AI Race Has No Single Winner — And Pakistan Must Choose Its Own Future

VA Disability Rates Increase 2027: The Confirmed 3.6% COLA Explained

US–China AI Export Controls in 2026: Chips, Testing Rules and Corporate Risk

World Trade in 2026: Tariffs, Supply Chains and the Cost of Fragmentation

World’s Largest Economies: Ranking the Top Global Powers

Crude Oil & Petroleum Market Analysis: OPEC+ Decisions and Price Forecasts

Global Pension Systems Ranked: The World’s Best and Worst Retirement Frameworks

Pakistan Economy 2026: Inside the SBP’s Balancing Act

Bitcoin Price Forecast 2026–2027: Will the 4-Year Cycle Hold?

Silver Price Today: Why the Xi-Trump AI Standoff Is Fueling a Safe-Haven Rally

Asian Stock Markets 2026: Japan, China, Pakistan & More

SpaceX IPO: How Aerospace Is Reshaping Tech Startup News

SpaceX IPO 2026: History’s Biggest Stock Debut?

Oil Prices 2026: Inside the Hormuz Crisis That Won’t End

Algorithmic Dogfights: Why the U.S. and China Must Establish Rules of Engagement for Autonomous Air Power

IMF Reports 2026: What the Latest Data Means for the Global Economy

Top US Convenience Store Chains: Store Counts, EV Charging, and Sales Trends

Business Insurance: What Coverage You Actually Need and What It Costs in 2026
-

 Markets & Finance9 months ago
Top 15 Stocks for Investment in 2026 in PSX: Your Complete Guide to Pakistan’s Best Investment Opportunities
-

 Analysis8 months ago
Johor’s Investment Boom: The Hidden Costs Behind Malaysia’s Most Ambitious Economic Surge
-

 Analysis8 months ago
Top 10 Stocks for Investment in PSX for Quick Returns in 2026
-

 Banks9 months ago
Best Investments in Pakistan 2026: Top 10 Low-Price Shares and Long-Term Picks for the PSX
-

 Analysis8 months ago
Brazil’s Rare Earth Race: US, EU, and China Compete for Critical Minerals as Tensions Rise
-

 Investment9 months ago
Top 10 Mutual Fund Managers in Pakistan for Investment in 2026: A Comprehensive Guide for Optimal Returns
-

 Global Economy10 months ago
15 Most Lucrative Sectors for Investment in Pakistan: A 2025 Data-Driven Analysis
-

 Global Economy10 months ago
Pakistan’s Export Goldmine: 10 Game-Changing Markets Where Pakistani Businesses Are Winning Big in 2025