
Auto
Indonesia’s Nickel U-Turn Could Reshape Global EV Battery Prices

Indonesia controls roughly 60% of the world’s nickel supply. A single policy reversal there in mid-2026 is now doing more to move global battery-metal prices than any OEM announcement or central bank decision — and it’s getting far less coverage than it deserves.
The whiplash, in numbers
Indonesia’s Energy and Mineral Resources Ministry began 2026 by tightening its annual mining work plan and budget quota (RKAB) sharply, cutting the approved nickel production quota to 260–270 million tons — roughly one-third lower than 2025’s approved quota of 379 million tons, according to Argus Media. That tightening, combined with a shift from three-year to annual RKAB approval cycles and a revised ore-pricing formula, pushed London Metal Exchange nickel prices to an 18-month high of $18,950 per tonne on January 29, 2026.
Now Indonesia is reportedly reversing course. The ministry has informed some miners that mid-year revisions will boost total 2026 mining quotas to 360 million tons — up from roughly 260 million tons issued in the first half — according to Bloomberg. Benchmark nickel futures dropped as much as 2.7% to $16,705 a tonne on the news, per Mining.com.
Why the whiplash happened
The tightening earlier in 2026 had real operational consequences: PT Weda Bay Nickel, formerly the world’s largest nickel ore producer, was forced to suspend output after exhausting its drastically reduced quota, per Mining.com. Eramet, Weda Bay’s operator, placed part of its mining operations into care and maintenance, and financial pressure emerged at downstream producers including Gunbuster Nickel, according to ING Think. Meanwhile, PT Vale Indonesia and other producers needed significantly higher quotas to feed new processing plants coming online — creating pressure from within Indonesia’s own downstream industry to reverse the restriction.
The reversal, if confirmed, would represent Indonesia’s first meaningful easing of nickel supply restrictions this year, according to ING Think — and underscores just how influential Indonesian policy has become for the global nickel market: “expectations around mining quotas and ore pricing have repeatedly moved prices well before any impact on actual production has materialised.”
The underreported gap between quota and reality
The most important nuance missing from most coverage: approved quotas do not automatically translate into actual production. In 2025, authorities ultimately approved a much higher RKAB than initially proposed, yet actual ore output remained well below the permitted ceiling because of operational and financial constraints, according to ING Think. Nickel output is still projected to rise 11.9% in 2026 to 2.9 million tonnes regardless of the quota back-and-forth, because much of the capacity expansion is already “built-in” from prior investment decisions, particularly by Chinese-backed firms, per Mining Technology.
The International Nickel Study Group forecasts only a modest 32,000-tonne primary nickel deficit for 2026 — a narrow enough margin that a higher RKAB could quickly erase any expected shortfall, according to ING Think.
Why this matters for EV and battery supply chains
China-led foreign direct investment has been the primary catalyst behind Indonesia’s nickel boom, financing the rapid build-out of smelters and high-pressure acid leaching (HPAL) plants used for battery-grade nickel, per Mining Technology. Global EV sales grew 21% through late 2025, with Europe up 33% and China up 19%, according to Crux Investor — sustained demand growth that means Indonesia’s supply decisions have an outsized effect on the input costs behind every EV battery pack sold globally, whether or not the end consumer or automaker ever sees the word “RKAB.”
Canada is positioning itself as a secondary supply source: Canada Nickel’s Crawford project was designated a “National-Building Project” by Prime Minister Mark Carney, targeting construction by year-end 2026 — though Crawford and comparable projects like Lifezone Metals’ Kabanga in Tanzania each represent less than 1% of the global nickel market, meaning Indonesia’s policy will remain the dominant swing factor for years, per Crux Investor.
What this means for buyers and investors
For battery manufacturers, EV makers, and commodities investors, the message is that Indonesian regulatory decisions — not mine discoveries or demand shocks — are now the primary driver of near-term nickel price volatility. Given the RKAB system’s shift to annual review cycles, expect this pattern of policy-driven price swings to repeat at least once a year going forward, rather than settling into a stable supply regime.
FAQ
What is Indonesia’s RKAB nickel quota system? RKAB (Rencana Kerja dan Anggaran Biaya) is Indonesia’s annual mining work plan and budget approval process, which sets how much nickel ore each company is permitted to produce.
Why did nickel prices rally in early 2026? Indonesia tightened its RKAB nickel quota to 260–270 million tons, down about one-third from 2025’s approved level, pushing LME nickel prices to an 18-month high of $18,950 a tonne.
Is Indonesia now increasing its nickel production quota? Reports indicate Indonesia is considering raising its 2026 quota to around 360 million tons, though the change has not been officially confirmed and remains at the discretion of the Energy Minister.
Discover more from The Economy
Subscribe to get the latest posts sent to your email.


Paris and Berlin have reached a pivotal automotive compromise. Its implications extend well beyond tariffs, raising difficult questions about manufacturing, technology, jobs, trade alliances and the future of affordable electric vehicles.
Europe’s automotive confrontation with China is entering a more consequential phase. Having imposed tariffs on Chinese-made electric vehicles, the European Union is now moving toward a policy that could influence not only where cars are sold, but also where their components are manufactured, their batteries are sourced and their technology is developed.
A new Franco-German agreement announced on October 16 seeks to strengthen European production through stricter Made in Europe requirements while offering greater flexibility on vehicle emissions.
For Chinese manufacturers such as BYD, Chery, Xpeng and Changan, the message is increasingly difficult to ignore: access to European customers may remain open, but access to European industrial incentives could become dependent on making a substantially greater economic contribution within the region.
The agreement represents a political breakthrough between Europe’s two largest economies. But it is not yet binding EU legislation, and crucial details remain subject to negotiation.
According to Reuters’ October 16 report, Germany and France must secure support from other EU governments and the European Parliament before their proposals can take effect.
The stakes are considerable. Europe’s automotive industry supports extensive manufacturing and supplier networks, while Chinese companies increasingly regard the continent as an important destination for overseas expansion.
The central question is no longer simply whether Chinese electric vehicles can compete in Europe. It is whether European policy can preserve industrial value without undermining competition, investment and the transition to cleaner transport.
What Germany and France Have Agreed
At the centre of the compromise is a narrower definition of what constitutes a European-made vehicle for specified public financial support and government procurement.
The French and German position builds on the European Commission’s Industrial Accelerator Act, proposed on March 4, 2026.
That initiative seeks to strengthen domestic industrial capacity by linking certain subsidies, procurement decisions and investment incentives to European production and lower-carbon manufacturing.
Under the latest Franco-German approach, qualifying automotive production would primarily cover the EU’s 27 member states. Some closely integrated European partners could participate under additional conditions.
Reporting by Euronews identifies a proposed threshold requiring 70% European-origin components, excluding batteries, alongside European battery-content conditions.
The October agreement also points toward stronger expectations for research and development in Europe.
Three elements deserve particular attention.
First, assembling a vehicle in Europe may not be enough. The value of its components and the structure of its supply chain could determine whether it qualifies for public incentives.
Second, battery sourcing matters separately. European policymakers want more of the economic value generated by electric vehicles—including battery technology and manufacturing—to remain within the region.
Third, engineering and research could become part of industrial eligibility. A factory that assembles imported components offers a different economic contribution from a facility supported by local suppliers, researchers and engineering teams.
Reports on the Franco-German position indicate a potential 2028 implementation horizon for key automotive sourcing conditions. However, eligibility calculations, transitional arrangements and research requirements remain unsettled.
These distinctions matter because the new framework would not automatically prohibit the sale of foreign vehicles. Instead, it could affect which vehicles benefit from specified public support.
Why Germany and France Reached a Compromise
France and Germany share concerns about competition from Chinese manufacturers, but their approaches to industrial policy have not always aligned.
France has consistently advocated a stronger European preference in industrial subsidies and public procurement. Its argument is that public spending should support production, investment and employment within Europe.
Germany has traditionally placed greater emphasis on maintaining internationally integrated supply chains and protecting established automotive manufacturers from abrupt regulatory change.
German brands depend on extensive supplier relationships and sell vehicles in international markets, including China. Policies designed to restrict Chinese competition could also complicate their own global operations.
The October compromise connects these industrial interests with a politically sensitive question: the EU’s vehicle emissions framework for 2035.
Under the joint position, the proposed 2035 emissions target would be a 90% reduction from 2021 levels, without requiring manufacturers to compensate for the remaining 10% through additional measures.
That offers greater flexibility than the European Commission’s earlier proposal.
Reuters reported that European automotive shares advanced following the agreement, while Volkswagen welcomed the prospect of stronger incentives for European manufacturing.
The political bargain is therefore clear.
Germany gains greater flexibility over future automotive technologies. France gains stronger support for European industrial preferences.
Yet neither outcome is guaranteed. Other EU institutions and member states retain a role in determining the final rules.
China’s Expanding Automotive Presence Explains Europe’s Urgency
The debate is taking place against an extraordinary transformation in international vehicle trade.
China has become the world’s largest vehicle exporter, with domestic manufacturers expanding across electric vehicles, plug-in hybrids and conventional models.
European companies remain major global manufacturers. Yet Chinese competitors have demonstrated increasingly strong capabilities in battery technology, software integration, manufacturing scale and price competitiveness.
The latest Eurostat figures, published October 13, show that China accounted for 42% of the EU’s electric-car imports in 2025.
That figure measures China’s share of imported electric cars, not its share of all vehicles sold in the EU—a distinction that is essential for interpreting the market.
The same Eurostat release shows that:
- EU imports of electric and hybrid cars reached €45.1 billion in 2025.
- Exports of these vehicles totaled €64.7 billion.
- Almost 4.8 million hybrid and electric cars were produced in the EU.
- Hybrid and electric models accounted for nearly 40% of EU car production.
These numbers demonstrate that Europe is not a passive participant in the electric-vehicle transition. It retains substantial production capabilities and an important export position.
But its manufacturing base faces intense competition over costs, batteries and future technologies.
China’s domestic market conditions provide an additional reason for its automakers to expand overseas.
According to Associated Press reporting on October 12, Chinese passenger-vehicle exports increased 64% year over year in September 2026, reaching approximately 919,000 units.
Weakness in domestic demand has made foreign markets particularly important for Chinese carmakers.
Europe consequently faces two interconnected pressures: a wave of increasingly competitive imports and the need to attract long-term investment into its own automotive industry.
The Three Layers of Europe’s New Automotive Trade Strategy
Europe’s emerging approach combines existing tariffs, restrictions on certain imports and proposed local-production incentives.
Understanding the differences is essential.
1. Existing tariffs on Chinese battery-electric cars
In October 2024, the European Commission imposed additional countervailing duties on battery-electric vehicles manufactured in China following an anti-subsidy investigation.
The definitive rates included:
| Manufacturer | Additional countervailing duty |
|---|---|
| BYD | 17.0% |
| Geely | 18.8% |
| SAIC | 35.3% |
| Tesla’s Shanghai production | 7.8% |
These are additional countervailing duties, not necessarily the complete applicable import-tariff burden.
The duties were introduced to address subsidy-related injury concerns identified by the Commission. They are distinct from the proposed Made in Europe requirements.
The legal basis and company-specific rates appear in the EU’s definitive countervailing duty regulation.
2. New restrictions on hybrid-vehicle imports
Chinese manufacturers responded to the earlier battery-electric tariffs partly by expanding sales of hybrid vehicles.
Brussels and Beijing subsequently reached an agreement aimed at limiting Chinese-built hybrid imports.
On October 12, Reuters reported that the EU and China had agreed on an initial annual limit of 350,000 hybrid vehicles, with the volume allowed to increase by 6% annually.
The safeguard arrangement is intended to last four years and would apply to other trading partners under its broader framework.
Its precise implementation remains important, particularly for companies planning European sales and production.
3. Proposed incentives favouring European manufacturing
The third layer is potentially the most transformative.
Unlike import duties or quotas, local-content requirements influence investment decisions inside the European economy.
A Chinese-owned company that establishes genuine manufacturing operations within the EU could potentially qualify under the relevant rules if its vehicles meet the applicable component, battery and other eligibility conditions.
This means the policy distinguishes between the location of production and the nationality of the corporate owner.
That distinction could fundamentally change Chinese automakers’ strategies.
How BYD, Chery, Xpeng and Changan Could Respond
Chinese manufacturers are not approaching this policy shift without preparation.
Many have already started building or developing European production capacity.
Reuters reported on October 13 that several major Chinese manufacturers were accelerating local manufacturing, engineering and supplier partnerships before the rules were finalized.
BYD: From vehicle exports toward European production
BYD has pursued overseas manufacturing expansion, including investment in Hungary.
European production could reduce reliance on imports from China and provide a more durable base for growth.
However, a European assembly plant would not automatically satisfy the proposed sourcing requirements.
The company would also need to evaluate where batteries, electronics, motors and other vehicle components originate.
The economic calculation is straightforward but demanding: local production may improve regulatory resilience while adding new capital expenditure and operating costs.
Chery: Building a localized industrial strategy
Chery has emphasized European production and local engineering capabilities.
For the company, establishing relationships with European component manufacturers could become as important as developing competitive models.
Such partnerships can provide access to technical capabilities, distribution networks and manufacturing expertise.
But integrating an international supplier base takes time, especially when production schedules and regulatory standards are evolving.
Xpeng: Partnerships as a route to market
Xpeng provides another example of how Chinese manufacturers can enter Europe without relying exclusively on new, wholly owned factories.
Reuters reported that Magna was already building electric vehicles for Xpeng in Austria.
Contract manufacturing can accelerate market access by using established production facilities.
Yet the proposed rules suggest that production location alone may be insufficient. Component sourcing and potentially research activity could become important additional considerations.
Changan: A longer-term European commitment
Changan has outlined ambitious plans for European production.
According to Reuters, the company is targeting production capacity of 180,000 vehicles annually in Europe by 2028 and 350,000 by 2030.
These are company targets rather than achieved production figures.
If implemented successfully, they would demonstrate how Chinese manufacturers can respond to trade restrictions by becoming increasingly embedded in Europe’s industrial ecosystem.
The broader implication is striking: policies intended to protect European manufacturing may also attract greater investment from Chinese competitors.
That could create European jobs while intensifying competition for established local brands.
The 70% Rule Could Transform Automotive Supply Chains
The most economically important feature of the proposed framework may be the component-value requirement.
Automotive production depends on complex international networks supplying batteries, semiconductors, electronic systems, transmissions, motors and other components.
A car sold as European-made can contain substantial imported value.
The proposed 70% threshold for non-battery components would therefore affect procurement decisions throughout the industry.
Manufacturers seeking to qualify for particular subsidies could need to purchase more components from EU suppliers or reorganize existing production networks.
For European parts manufacturers, this could create significant commercial opportunities.
For automakers, however, the transition may prove expensive.
A company might need to replace an efficient international supplier with a local alternative that initially has higher costs or limited production capacity.
The result could be higher short-term manufacturing expenses, even if additional investment eventually improves European competitiveness.
There is also a longer-term industrial benefit to consider.
Component factories generate more than direct employment. They support specialist engineering, machinery purchases, logistics services and technical training.
If local-content rules encourage these activities, the economic gains could extend beyond individual assembly plants.
But the outcome depends on whether European suppliers can achieve competitive costs and reliable production at scale.
Protection alone cannot guarantee industrial efficiency.
Why Britain, Turkey, Japan and South Korea Are Concerned
The emerging definition of Europe presents a challenge for countries with automotive industries closely connected to EU manufacturers.
Britain has historically been deeply integrated into European automotive production.
Turkey is another important manufacturing partner, supplying vehicles and components through longstanding commercial relationships.
Japan and South Korea are major automotive investors with extensive European operations and international supply chains.
The Franco-German proposal leaves room for certain European partners that were part of the EU internal market on January 1, 2020, but participation would be conditional.
The United Kingdom could potentially qualify if it accepted relevant trade-defence and investment-alignment requirements.
This could involve difficult choices over Britain’s treatment of Chinese-manufactured vehicles.
As The Guardian reported, UK officials have been weighing the implications of closer alignment with Europe’s automotive trade measures.
Turkey faces a different problem.
Despite extensive automotive supply-chain integration with Europe, it may fall outside the narrower geographical conditions.
A vehicle manufactured in Turkey could therefore encounter different treatment from a comparable vehicle made within the EU, depending on the eventual legislation.
This matters for European manufacturers as much as for Chinese brands.
Companies cannot reorganize decades of industrial specialization without costs.
The European Parliament’s September 2026 briefing on the Industrial Accelerator Act highlights the importance of international trade and investment considerations in implementing the proposal.
The political challenge will be defining European economic interests without unnecessarily disrupting production networks that already contribute to European employment.
Europe’s Trade Deficit With China Adds Pressure
The automotive dispute is part of a much broader economic imbalance.
According to Eurostat’s April 2026 publication, the EU imported €559.4 billion in goods from China during 2025 while exporting €199.6 billion.
That produced a merchandise trade deficit of €359.8 billion.
This deficit extends well beyond automobiles, covering machinery, electronics, chemicals and other manufactured products.
For European policymakers, the figures reinforce concerns about industrial competitiveness and reliance on external suppliers.
But trade deficits alone do not establish that particular imports are unfair or economically harmful.
Imports also provide inputs for European factories and affordable products for businesses and households.
The more difficult policy question is whether Europe can reduce strategically important dependencies without sacrificing the benefits of international trade.
The automotive sector is becoming a test case for that broader industrial strategy.
Could ‘Made in Europe’ Make Electric Cars More Expensive?
For European consumers, the consequences are less certain than the political debate sometimes suggests.
There are several competing effects.
Stricter local-content conditions could increase manufacturing costs when companies must replace established suppliers or invest in additional European facilities.
Reduced access to subsidies for some imported models could also affect their effective purchase prices.
Meanwhile, tariffs and import quotas can reduce competitive pressure from foreign manufacturers.
These developments may slow price reductions in some vehicle segments.
On the other hand, new factories and supplier investment could eventually improve production efficiency and reduce Europe’s dependence on imported components.
Competition among Chinese-owned manufacturers producing inside Europe and established European brands could remain substantial.
The Commission’s proposal is also targeted: it does not create a blanket prohibition on selling imported cars.
The impact on consumer prices will therefore depend on the final eligibility rules, available incentives, manufacturers’ pricing strategies and the extent of local investment.
Consumers should not assume that every Chinese-made vehicle will become ineligible for purchase or that all electric cars will necessarily become more expensive.
The Climate Policy Dilemma
Europe’s automotive industrial ambitions are colliding with its climate objectives.
Local production is intended to strengthen manufacturing employment and reduce strategic dependencies.
But loosening 2035 emissions requirements could alter manufacturers’ incentives to accelerate the shift toward fully electric vehicles.
This is why environmental organizations have criticized the Franco-German agreement.
The central concern is that additional flexibility for combustion-engine and hybrid technologies may delay investment in the next generation of affordable electric cars.
Supporters of the compromise offer a different argument.
They contend that manufacturers need realistic timelines, affordable energy and financial flexibility to survive the transition.
The challenge is not choosing between industrial competitiveness and decarbonization as though the two objectives are always mutually exclusive.
It is creating a framework in which European companies can develop competitive clean technologies while managing the costs of transforming factories, workforces and supply chains.
Without continued technological innovation, trade protection could offer only temporary relief.
What Happens Next: The 2026–2028 Policy Timeline
The agreement announced by France and Germany marks an important political step rather than the end of the legislative process.
Several developments will determine what the new automotive framework eventually looks like.
Late 2026: EU institutions and member states are expected to continue negotiating the automotive package and local-content requirements. Additional trade initiatives involving China are also under consideration.
November 20, 2026: A planned EU–UK summit could influence discussions over Britain’s role in the proposed European preference framework.
Early 2027: A common legislative text could begin to emerge, although adoption remains uncertain.
2028: The reported Franco-German position envisages implementation of important automotive local-content conditions, subject to the legislative process.
2035: Proposed changes to vehicle-emissions requirements could significantly influence the long-term balance between battery-electric, hybrid and combustion-engine technologies.
These are policy milestones and negotiating expectations, not confirmation that every proposed measure will enter into force on the dates described.
Frequently Asked Questions
What is the Made in Europe automotive policy?
It is a proposed framework linking certain public procurement decisions, subsidies and industrial incentives to European manufacturing and component sourcing. It forms part of the EU’s wider efforts to strengthen industrial competitiveness.
Does the policy ban Chinese electric vehicles?
No. The proposed local-content requirements are not a blanket import ban. They primarily concern eligibility for specified public support and procurement. Separate EU tariffs and proposed safeguards affect certain China-made vehicles.
What does the 70% European-content requirement mean?
The proposed rule concerns the value of European-origin vehicle components, excluding batteries. It should not be interpreted as a requirement that 70% of the entire vehicle’s weight, retail price or battery must originate in Europe.
Can Chinese carmakers qualify by building factories in Europe?
Potentially, yes. Chinese ownership does not automatically exclude a vehicle from satisfying geographical manufacturing requirements. However, assembly location, component origin and other conditions would still need to be met.
When could the new rules take effect?
Some proposals envisage implementation from 2028, but final dates depend on negotiations among EU institutions and member states. As of October 18, 2026, the Franco-German compromise is not binding EU law.
Will the agreement increase electric-car prices?
It could raise costs for some manufacturers or affect subsidy eligibility for particular models. However, its overall influence on retail prices remains uncertain and will depend on competition, investment and the final rules.
Conclusion: Europe Is Redefining the Terms of Automotive Competition
The Franco-German agreement marks a shift in Europe’s approach to competition with Chinese automakers.
Tariffs remain important, but the emerging strategy goes further: public industrial support may increasingly depend on where automotive value is created.
That creates opportunities for European suppliers, workers and manufacturing regions. It also offers Chinese automakers a path toward deeper localization rather than exclusion.
The policy’s success will ultimately be measured less by the number of imports it restricts than by the competitive industries it helps create.
Europe needs more than protected factories. It needs affordable vehicles, advanced battery technology, productive supply chains, skilled workers and manufacturers capable of competing internationally without permanent dependence on public support.
Chinese automakers, meanwhile, face a choice between relying on exports and committing greater capital, technology and expertise to European operations.
The likely result is not a simple retreat by China from Europe’s automotive market.
It could instead be the beginning of a new industrial contest—one increasingly fought inside Europe itself.
Discover more from The Economy
Subscribe to get the latest posts sent to your email.

7-Eleven, Circle K, and Casey’s lead US convenience retail by store count. See how EV charging is spreading across the top chains and where fuel sales stand.
Key Takeaways
- The US had 151,975 convenience stores at the end of 2025, down 280 from the year before, according to NACS and NIQ TDLinx.
- 7-Eleven is the largest chain by store count, with about 12,700 US locations on CSP’s January 2026 ranking. Circle K, Casey’s, and Murphy USA follow.
- Fuel is still the core. Convenience stores sell about 80% of the gasoline bought in the US, and 122,620 stores now sell fuel, the highest number in eight years.
- EV charging remains thin. Wawa and Sheetz have chargers at 11% to 30% of their sites in a Consumer Reports sample, while the two largest chains have added chargers to less than 1% of their stores.
- Most chains are partnering with charging networks rather than building their own, and that model is shifting as 7-Eleven, Circle K, and Wawa take on more ownership.
Search Intent Summary
Readers searching this topic want to know which convenience chains are biggest, how they compare, and whether they’re investing in EV charging. This guide ranks the top chains by store count, explains the EV strategies, and covers the sales and fuel context.
How Market Share Is Measured
Market share in convenience retail can be measured several ways: by store count, by fuel gallons, or by in-store sales dollars. Public data is strongest on store counts, so this ranking uses store counts. Dollar-share estimates are sold by market research firms, and I did not verify figures that would support a revenue-based ranking.
Different sources also count stores differently. CSP’s Top 202 uses stores owned, operated, or franchised as of January 1, 2026. The NACS/NIQ TDLinx count is a separate industry tally. For Circle K, CSP lists 7,308 stores, while the NACS count lists 6,038 locations, so the figures should not be combined or compared directly across sources.
The Largest Chains by Store Count
On CSP’s 2026 Top 202, the leaders are:
- 7-Eleven: about 12,700 stores, the largest chain in the industry
- Alimentation Couche-Tard (Circle K): 7,308 stores under CSP’s count, the second-largest
- Casey’s General Stores: 2,921 stores, concentrated in the Midwest
- Murphy USA: 1,800 stores, a major fuel-focused operator
- bp America: 1,708 stores
- EG America: 1,464 stores
- QuikTrip: 1,196 stores, a Southern and Midwestern chain
- Wawa: 1,189 stores, a Mid-Atlantic favorite
- ExtraMile: 1,174 stores
- GPM Investments: 1,118 stores
Kwik Trip (919), Maverik (818), Sheetz (815), Love’s Travel Stops (668), and Pilot (658) round out the next tier. The threshold for the top 100 in 2025 was 67 stores, which shows how concentrated the market is at the top.
Store counts shifted in 2025 mostly through acquisitions. Circle K’s gain came largely from finishing its purchase of GetGo Café and Market, formerly owned by Giant Eagle. Sunoco’s $9.1 billion acquisition of Parkland Corp. also reshaped the rankings.
Fuel Sales Remain the Core Business
Convenience stores are, first and foremost, fuel retailers. NACS estimates that the industry sells about 80% of the gasoline purchased by consumers in the US, and the number of stores selling fuel rose by 768 in 2025 to 122,620, the highest count in eight years. Overall, 80.7% of convenience stores sell fuel.
That mix matters for margins and for the strategy of the largest chains. Fuel brings traffic, and inside sales, especially food service and tobacco, bring profit. NACS reported the industry generated $837.4 billion in sales in 2024, driven largely by foodservice. Industry-wide 2025 sales were scheduled for release at the NACS summit in April 2026, and readers should check the NACS site for the latest figure.
Gasoline price swings affect this business directly. National average prices reached $4.41 on October 1, 2026, according to AAA, which means fuel margins and foot traffic move with crude oil headlines.
EV Charging: Who Is Investing and How
Convenience stores have become a major location for public charging, but coverage is still limited. A Consumer Reports study of 75 major retailers, covering 11 convenience-store companies, found that Wawa and Sheetz had EV chargers at between 11% and 30% of their locations, averaging six to ten fast chargers per site. Royal Farms was similar. The remaining chains averaged between two and five chargers per site.
Across the sample, only 1.4% of convenience stores offered EV charging. The study noted that c-stores are the only retail category where nearly all chargers are fast chargers, which is a good fit for a quick stop but expensive to install.
The two largest chains are taking a different approach. 7-Eleven launched its own 7Charge network and app, with a stated goal of building one of the largest fast-charging networks of any retailer in North America. Circle K has partnered with IONNA, an EV charging company backed by eight automakers, to add chargers at 350 US stores, including converting about 85 existing charging sites. Neither 7-Eleven nor Circle K had chargers at more than 1% of their stores in the Consumer Reports sample.
Other chains are moving in similar directions. Casey’s is installing IONNA chargers at several locations in six states, with plans to expand the partnership. Sheetz and Wawa also partner with IONNA. Wawa announced in September 2026 that it would install eight branded DC fast chargers in Pennsylvania through a partnership with Electrify America, its first move into owning and operating its own charging equipment rather than hosting third-party chargers. Wawa has operated EV charging at more than 280 locations since 2017.
The model matters for shoppers. Partnerships usually mean the charging company runs the equipment and handles payment, while the store provides the site and drives traffic. Chains that own their chargers get more control over pricing and reliability, but they also take on the cost and risk.
Customer Satisfaction Rankings
Store counts and charging networks are only part of the picture. The American Customer Satisfaction Index’s 2026 convenience store study, released October 6, ranked Meijer first, followed by QuikTrip in second and a tie for third between Wawa and Sheetz. The survey asked 9,465 consumers to score chains on factors including store hours, coffee freshness, bathroom cleanliness, food quality, wait times, and app usability.
Overall satisfaction fell 1% to 75 points, and store layout and cleanliness dropped 3%. Wawa led in the South and Northeast regions in the survey. The findings suggest that growth in food service and digital offerings is not yet translating into higher satisfaction across the industry.
Practical Guidance for Shoppers and Investors
For drivers choosing a chain, the EV question depends on where you travel. If you drive an electric vehicle, check the chain’s charging network and app before a long trip. Many chargers are partnership sites with different payment systems, so confirm the plug type and fees in advance.
For fuel shoppers, the fuel-selling store count is a good sign of supply, but prices vary by brand and region. Compare the station’s posted price with the AAA state average before you fill up.
For investors and industry watchers, the key questions are whether chains can grow charging in high-traffic locations without pressuring margins, and whether the largest chains will move from partnership models to owned networks.
Future Outlook
Store counts are roughly flat, with growth coming from acquisitions and new formats rather than from a rapid expansion of the total store base. EV charging is growing from a small base, and the chains that build dependable fast-charging networks may gain traffic from drivers who need a quick stop. Fuel price volatility will continue to shape the economics of the whole sector.
Frequently Asked Questions
Which convenience store chain is the largest in the US?
7-Eleven is the largest by store count, with about 12,700 US stores on CSP’s January 2026 ranking. Circle K is second, although counts differ by data source.
Which convenience stores have the most EV chargers?
Wawa and Sheetz had chargers at 11% to 30% of their locations in the Consumer Reports sample, with six to ten fast chargers per site on average. 7-Eleven and Circle K have expanded their charging networks but had chargers at less than 1% of their stores in that sample.
How many convenience stores are there in the US?
The NACS/NIQ TDLinx count put the total at 151,975 at the end of 2025, down 280 stores from the year before. About 63% of stores are owned by companies with ten or fewer locations.
Do convenience stores sell most of the gas in the US?
NACS estimates convenience stores sell about 80% of the gasoline purchased by consumers in the US. Fuel is the core product for most chains, even as inside sales and food service grow.
Discover more from The Economy
Subscribe to get the latest posts sent to your email.
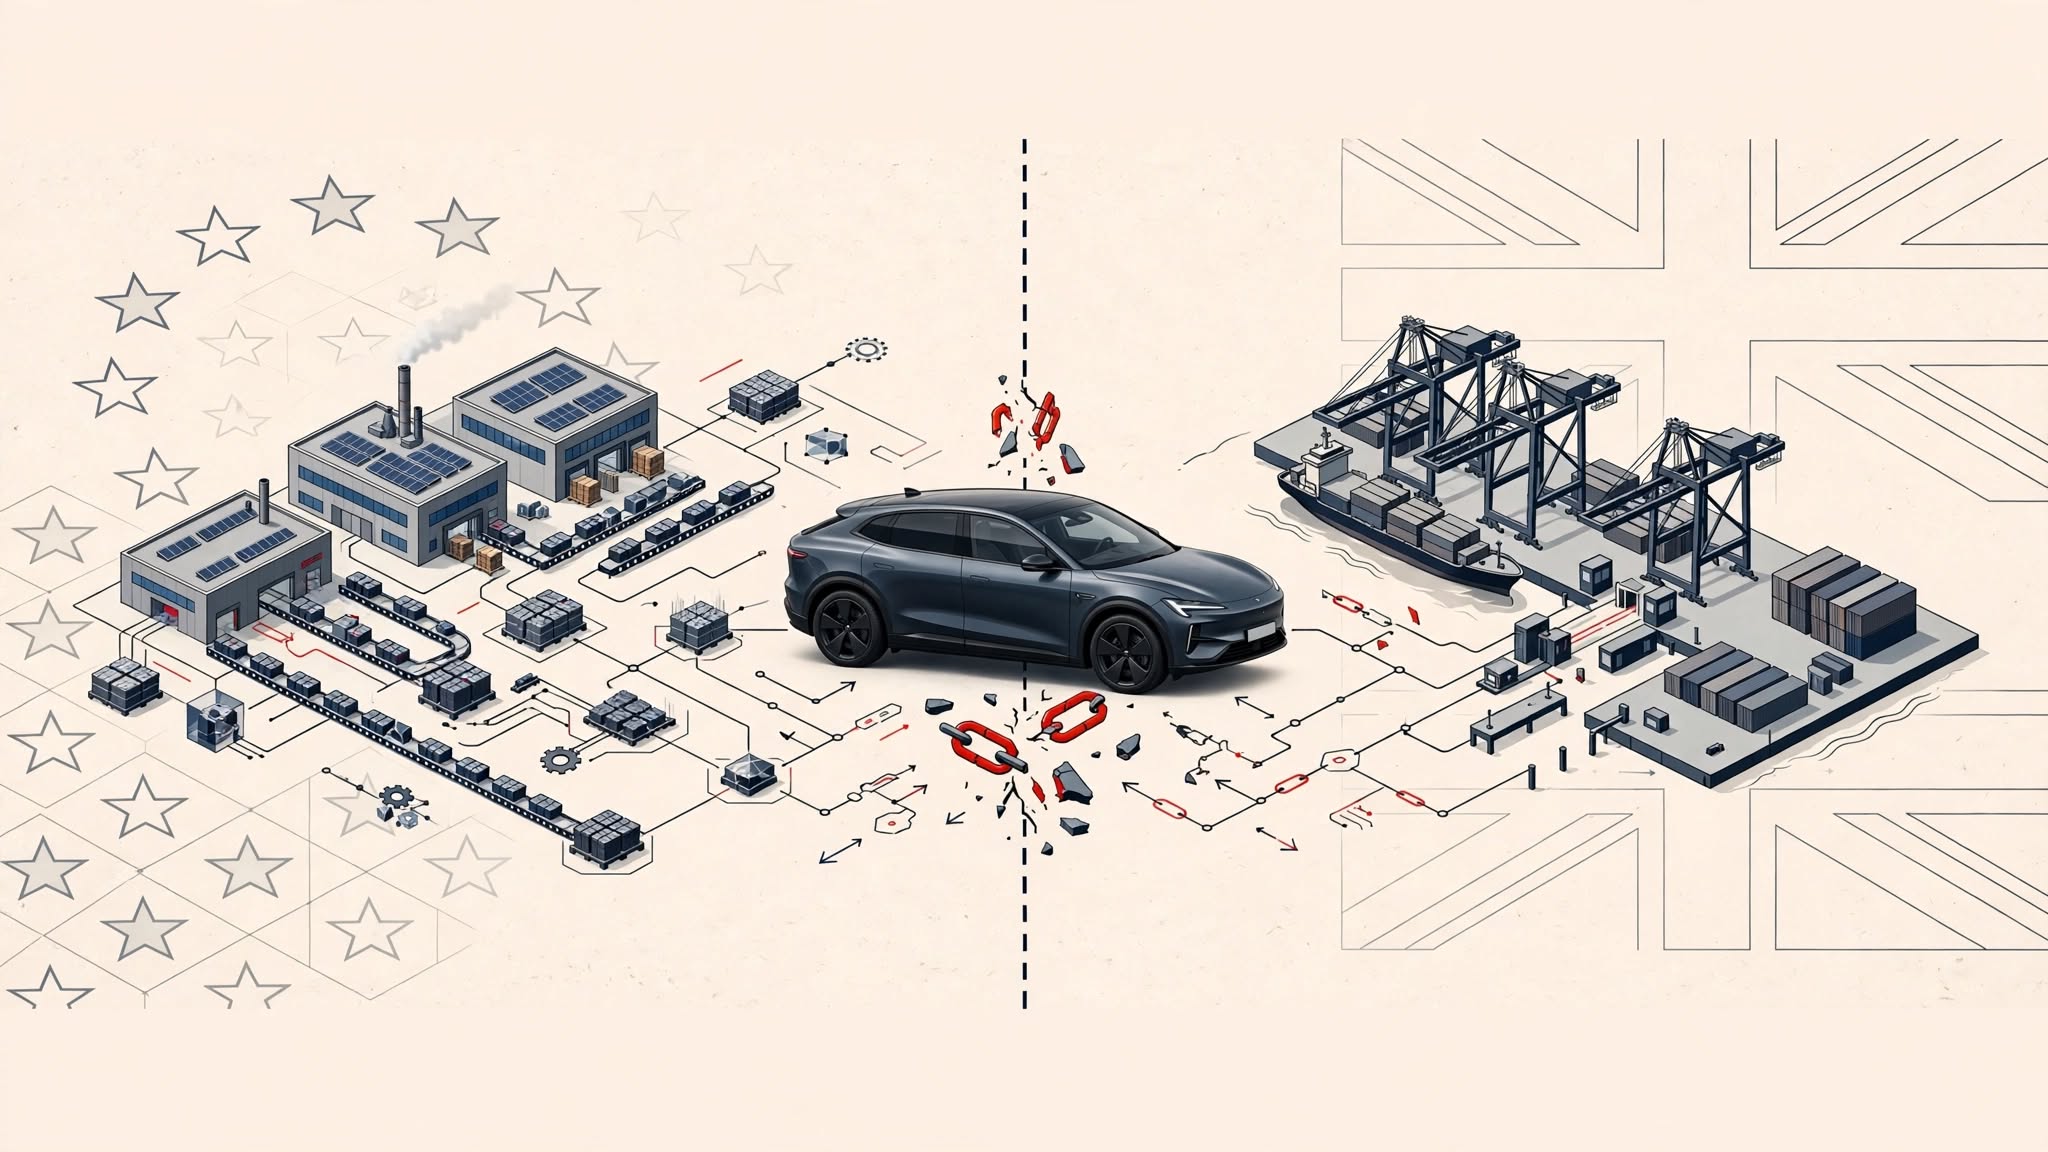
EU duties on Chinese EVs reach 45.3% while the UK charges 10%. Here’s how the tariff gap works, what the 2027 rules change, and who pays.
Key Takeaways
- The EU applies countervailing duties on Chinese-built battery electric vehicles of 17.0% (BYD), 18.8% (Geely), and 35.3% (SAIC), on top of the 10% standard tariff. Non-cooperating exporters face 35.3%.
- The UK has not adopted EU-style duties on Chinese EVs. Chinese-built cars pay the standard 10% rate.
- Under the EU-UK Trade and Cooperation Agreement, EVs made in either market can enter the other tariff-free only if they meet local-content thresholds. Those transitional rules expire at the end of 2026.
- Stricter rules from 2027 could expose roughly 82% of EU battery-electric car exports to the UK to a 10% tariff, according to industry estimates.
- Tariffs are paid by importers, so their effect on shoppers depends on how manufacturers price and source their cars.
Search Intent Summary
Readers searching this topic usually want to know one thing: why does the same electric car cost different amounts in Europe and Britain, and will that change? This article covers the current duty rates, the rules-of-origin deadline, and what each market’s policy means for supply chains and prices.
The EU’s Anti-Subsidy Duties on Chinese EVs
The European Commission’s dispute with China began with an investigation into Chinese state subsidies. The Commission found that subsidies were distorting prices and threatening European carmakers. In October 2024, it imposed definitive countervailing duties on imports of battery electric vehicles from China, applicable from 30 October 2024 under Regulation 2024/2754. The duties apply for five years.
The rates vary by manufacturer. Sampled producers BYD, Geely, and SAIC were assigned 17.0%, 18.8%, and 35.3%. Other cooperating companies face 20.7%. Companies that did not cooperate with the investigation face 35.3%. Those rates stack on the existing 10% MFN tariff, so the highest total is 45.3%.
The EU has since amended those rates. In February 2026, the Commission adopted Implementing Regulation (EU) 2026/330, which amended the original regulation following a partial interim review. Check the amended schedule before quoting any specific rate, because the figures above come from the original 2024 decision.
The duties apply to fully electric passenger cars made in China. Plug-in hybrids and cars built outside China fall outside the measure.
The UK’s Different Approach
Britain left the EU’s trade defence system after Brexit and has made a different choice. Chinese-built electric cars entering the UK pay the standard 10% tariff, with no additional anti-subsidy duty. Reporting in the Financial Times and elsewhere in 2026 describes the UK as keeping this position under review rather than committing to match Brussels.
That gap has become a bargaining issue. Reporting in September 2026 says Brussels has pressed London to align its China policy as a condition for British manufacturers to take part in the EU’s “Made in Europe” industrial initiatives. London has responded that the tariffs remain under review, without committing to a change.
The UK’s position has a practical logic. Chinese manufacturers have not yet pushed large volumes into the British market. Trade press has noted that Chinese brands account for a growing share of new registrations, which gives policymakers a reason to weigh investment against protection.
The Rules-of-Origin Deadline
The more immediate issue for manufacturers is the Trade and Cooperation Agreement’s rules of origin. Under that deal, electric vehicles traded between the UK and the EU avoid tariffs only when they contain enough local content.
The IEA’s summary of the EU-UK rules set the thresholds for the second phase, January 2024 to December 2026, at 45% of vehicle value, 60% for battery packs, and 50% for battery cells. The thresholds were originally due to rise further in 2027, but the two sides agreed to hold the current rules through 2026 to give manufacturers time.
That transitional period ends on 31 December 2026. The European Automobile Manufacturers’ Association, ACEA, has warned that the stricter rules will be hard to meet. Its estimates, reported by trade publication electrive in September 2026, suggest around 520,000 battery-electric cars and light commercial vehicles worth €17.9 billion would be exported from the EU to the UK in 2027. About 82% of those, roughly 426,000 vehicles, could fail the new thresholds. At a 10% tariff, ACEA calculates that would cost €1.47 billion. ACEA has asked for battery-specific rules to be delayed until 2029, while keeping the vehicle rules tightening on schedule.
ACEA’s figures are an industry estimate, not an official forecast. Whether the UK and EU agree another extension is the key open question for 2027.
How the Tariffs Reach Supply Chains
The tariff gap changes where manufacturers choose to build and source. Three effects stand out.
Manufacturers importing Chinese-built cars into the EU face a total duty that can reach 45.3%. That pushes carmakers to build in Europe, source batteries locally, or shift volume to the UK, which currently charges 10%.
Carmakers building cars in the UK for export to the EU face their own problem. A UK-built electric car that fails the rules of origin pays a 10% duty when entering the EU. Nissan’s Sunderland plant, which builds the Leaf, is one example of a site where the rules matter directly.
Battery supply is the pinch point. Meeting the 60% and 50% battery thresholds requires cell and pack production in the EU or UK, and the industry says that capacity is still being built.
The Consumer Price Question
Tariffs are paid by importers, not directly by shoppers. A duty raises the cost of importing a car, and the importer decides whether to pass that cost on through the price, absorb it, or cut the car’s spec.
A simple example shows the scale. Suppose a Chinese-built EV has a customs value of €30,000. At the 10% standard rate, the duty is €3,000. At a combined 27% (17% anti-subsidy plus 10% standard), it rises to €8,100. The extra €5,100 is a cost the importer must recover somehow. This example is hypothetical, and the real figure depends on the car’s customs valuation and the manufacturer’s rate.
Competition shapes the outcome. Industry analysts have noted that the EU’s duties averaged around 20% for many Chinese producers, which carmakers in China argued would have a limited effect on sales. Price impact is therefore uneven across brands and models.
Practical Strategy for Buyers and Businesses
For buyers, the most useful step is checking a car’s country of origin and manufacturer before comparing prices across markets. A model built in one country can carry very different duty costs in another, even if the badge is the same.
For fleet operators and importers, the 2027 deadline is the priority. Confirm whether a model qualifies under the current rules of origin, and ask suppliers for documented local-content figures. Build a contingency for a 10% tariff on any cars that fail.
For policy watchers, track three signals: whether the UK decides on China tariffs, whether the EU and UK agree to extend or modify the rules of origin, and whether the EU’s price-undertaking talks with Chinese manufacturers produce a settlement. Any of these could shift the picture quickly.
Future Outlook
The likely direction is toward more alignment, but not uniformity. The EU has tied its “Made in Europe” access to tougher China policy, and the UK has every incentive to protect access to its largest trading partner’s industrial programs. At the same time, the UK’s market has been more open, and some British policymakers want to keep it that way.
The 2027 rules of origin are the first hard test. Whether they tighten as scheduled, get delayed, or are softened for batteries will determine how much duty lands on cars that cross the Channel.
Frequently Asked Questions
Why are Chinese electric cars more expensive in the EU than in the UK?
The EU imposes countervailing duties of 17% to 35.3% on China-built battery electric cars, on top of a 10% standard tariff. The UK charges the standard 10% without the extra anti-subsidy duty. The difference comes from the EU’s subsidy investigation, which the UK has not replicated.
Do EU electric car tariffs apply to plug-in hybrids?
No. The anti-subsidy duties cover new battery electric vehicles designed for transporting people, and the regulation names vehicles propelled solely by electric motors, including those with a range extender. Plug-in hybrids fall outside the measure, and cars built outside China are not subject to the countervailing duties.
What happens to UK-EU electric car trade in 2027?
The current transitional rules of origin expire on 31 December 2026, and stricter local-content requirements apply from 2027 unless the two sides agree otherwise. Industry estimates suggest many EU exports to the UK would fail the new thresholds and face a 10% tariff. Watch for an extension or modification before the deadline.
Who pays electric car tariffs?
The importer pays the duty when the car enters the market. Whether the cost reaches the buyer depends on the importer’s pricing decisions, competition, and the manufacturer’s sourcing choices. The tariff does not appear as a line item on a shopper’s invoice.
Discover more from The Economy
Subscribe to get the latest posts sent to your email.

Wind Farm Economics in 2026: What Determines Whether a Project Pays?

Boomers vs Young Adults: Why the Net Worth Gap Is More Complicated Than It Looks

Is the AI Bubble Bursting in 2026? Five Tests Investors Should Watch

Germany–France ‘Made in Europe’ Deal Could Reshape China’s EV Ambitions

Treasury Yields and Inflation 2026: What Bond Moves Mean for Borrowers

Social Security COLA 2027 Is 3.6%: Payments, Examples and Dates

Ukraine’s Oil Strike Strategy: Can It Break Russia’s War Economy?

Power Grid Emergency Across 13 States? What the October 2026 PJM Order Actually Says

Oil Prices October 2026: Iran Conflict, Shipping and Inflation Risks

TSMC Stock in October 2026: AI Chip Demand, Earnings and Valuation Risks

Stock Market Crash 2026: What the Inflation and AI Selloff Means

Student Loans and the 2026 Midterms: SAVE Plan Deadlines and Borrower Choices

KOSPI Crash October 2026: What Korea’s Chip Selloff Reveals

CoreWeave Stock 2026: CRWV, AI Infrastructure Debt and the Selloff Explained

World’s Largest Economies: Ranking the Top Global Powers

Crude Oil & Petroleum Market Analysis: OPEC+ Decisions and Price Forecasts

Global Pension Systems Ranked: The World’s Best and Worst Retirement Frameworks

Pakistan Economy 2026: Inside the SBP’s Balancing Act

Bitcoin Price Forecast 2026–2027: Will the 4-Year Cycle Hold?

Silver Price Today: Why the Xi-Trump AI Standoff Is Fueling a Safe-Haven Rally

Asian Stock Markets 2026: Japan, China, Pakistan & More

SpaceX IPO: How Aerospace Is Reshaping Tech Startup News

SpaceX IPO 2026: History’s Biggest Stock Debut?

Oil Prices 2026: Inside the Hormuz Crisis That Won’t End

Algorithmic Dogfights: Why the U.S. and China Must Establish Rules of Engagement for Autonomous Air Power

IMF Reports 2026: What the Latest Data Means for the Global Economy

Business Insurance: What Coverage You Actually Need and What It Costs in 2026

Top US Convenience Store Chains: Store Counts, EV Charging, and Sales Trends
-

 Markets & Finance9 months ago
Top 15 Stocks for Investment in 2026 in PSX: Your Complete Guide to Pakistan’s Best Investment Opportunities
-

 Analysis8 months ago
Johor’s Investment Boom: The Hidden Costs Behind Malaysia’s Most Ambitious Economic Surge
-

 Analysis8 months ago
Top 10 Stocks for Investment in PSX for Quick Returns in 2026
-

 Banks9 months ago
Best Investments in Pakistan 2026: Top 10 Low-Price Shares and Long-Term Picks for the PSX
-

 Analysis8 months ago
Brazil’s Rare Earth Race: US, EU, and China Compete for Critical Minerals as Tensions Rise
-

 Investment9 months ago
Top 10 Mutual Fund Managers in Pakistan for Investment in 2026: A Comprehensive Guide for Optimal Returns
-

 Global Economy10 months ago
15 Most Lucrative Sectors for Investment in Pakistan: A 2025 Data-Driven Analysis
-

 Global Economy10 months ago
Pakistan’s Export Goldmine: 10 Game-Changing Markets Where Pakistani Businesses Are Winning Big in 2025