
Analysis
Indonesia’s $1.5 Trillion Economy on the Edge: chances of MSCI Downgrade
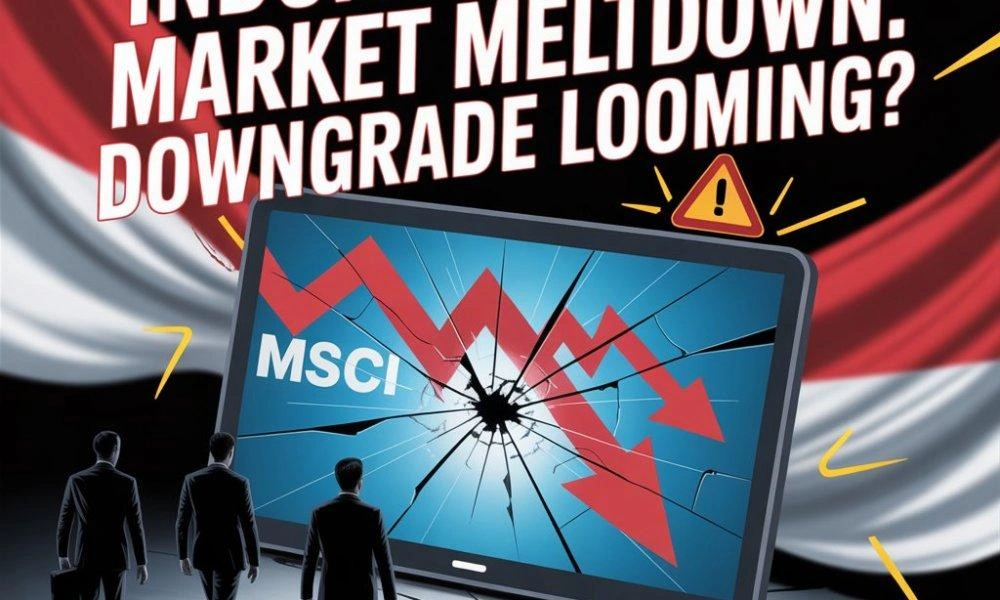
MSCI has extended its review of Indonesia’s emerging market status until November 2026. A downgrade to frontier market could trigger up to $60 billion in capital outflows from Southeast Asia’s largest economy. Here is everything you need to know.
A $1.5 Trillion Economy Facing a Classification Crisis
Indonesia has spent decades establishing itself as one of the world’s most important emerging markets. Now the country — Southeast Asia’s largest economy, with a GDP of about $1.5 trillion — risks losing that standing, potentially jeopardizing billions of dollars in foreign investment. The threat is not abstract. It is quantified, ongoing, and has already caused one of the worst stock market selloffs in Indonesian history.
In January 2026, index provider MSCI Inc. warned it might downgrade Indonesia’s equity market from “emerging” to “frontier.” Those classifications help determine how global investors allocate trillions of dollars across markets, influencing how easily governments and companies can raise capital. The announcement crystallized long-standing concerns over ownership concentration and market integrity, triggering immediate and severe market reaction.
MSCI’s January warning sent the Jakarta Composite Index into freefall, wiping out over $80 billion in market capitalization within days. The index has since fallen around 28% since the beginning of 2026 — one of the worst-performing major equity markets in the world.
What Is the Difference Between Emerging and Frontier Market Status?
These classifications are not mere labels. They determine where trillions of dollars of institutional capital flows. Emerging market status means that major global index funds — tracking indices used by pension funds, sovereign wealth funds, and institutional investors worldwide — include Indonesian assets in their portfolios. Frontier market status effectively removes Indonesia from the investable universe of most major institutional allocators.
The financial consequences of a downgrade would be immediate and severe. Analysts estimate that a full downgrade to frontier status could trigger foreign capital outflows ranging from $7.8 billion on the conservative end to as much as $60 billion on the dire end. Goldman Sachs estimated outflows of up to $13 billion in forced selling alone. This would cascade into a weaker rupiah, higher borrowing costs for the government and corporates, and slowing economic growth.
What Triggered the Warning? The “Deep-Fried” Governance Problem
MSCI’s concerns center on structural issues in Indonesia’s equity market that have worried analysts for years:
Ownership concentration: A small group of powerful conglomerates and tycoons control a disproportionate share of listed companies, limiting the “free float” available to ordinary investors.
Market integrity concerns: MSCI lowered Indonesia’s information flow criterion to “negative,” reflecting “structural issues in the opacity in shareholding structures and concerns about coordinated trading.”
Insufficient free float: Indonesia’s minimum free float requirement of 7.5% is well below the 15% MSCI now demands, and far below the 25% standard common in peers like India and Hong Kong.
The challenges run deeper than regulation. Indonesia’s President Prabowo Subianto has since taking office in October 2024 pursued high-spending populist policies that have pushed the fiscal deficit toward its legally mandated ceiling of 3% of GDP. The rupiah has depreciated by more than 14% since Prabowo took office. Investor confidence has been steadily eroding.
The November Deadline: What Happens Next
MSCI has extended its assessment period to November 2026, giving Indonesia a window to demonstrate meaningful progress on governance and transparency issues. The extension was greeted with a brief market rally — but the warning is explicit. If progress is deemed insufficient by November, MSCI “will consider a range of options for the appropriate treatment for the Indonesia market, potentially including a consultation on the reclassification.”
The Indonesian government’s regulatory response has been swift. New rules tightening market governance have been introduced. Plans to double the minimum free-float requirement to 15% are on the table. FTSE Russell maintained Indonesia’s Secondary Emerging status in April 2026 — a small positive signal.
Some analysts remain cautiously optimistic. Mirae Asset Sekuritas analyst Wilbert Arifin noted that of the 18 market accessibility indicators MSCI assessed, only the Information Flow indicator was downgraded — describing the “absence of broader deterioration” as “actually a more important signal.”
Others point out that the structural issues — tycoon-controlled markets, governance opacity, populist fiscal policies — cannot be fixed by November. They are embedded in Indonesia’s political economy.
The Broader Stakes: What a Downgrade Would Mean for Asia
Indonesia’s crisis is a warning sign for the entire emerging market ecosystem. As major economies like the United States and China increasingly compete for allies and supply chains, Southeast Asian nations have been positioning themselves as beneficiaries of supply chain diversification. A downgrade that signals governance failure and capital flight would undermine that positioning precisely when it matters most.
For global investors, Indonesia is a test case for a broader question: can populous, resource-rich developing nations modernize their financial markets fast enough to retain institutional capital during a period of intense global competition for investment?
The November 2026 deadline is not just about Indonesia’s stock market. It is about whether Southeast Asia’s largest economy can make good on its promise.
FAQ
Q: What is MSCI’s role in global finance? MSCI is the world’s most influential equity index provider. Its emerging market indices are tracked by trillions of dollars in institutional investment globally. When MSCI classifies or reclassifies a country’s market, it triggers automatic buying or selling by funds tracking those indices.
Q: How much has Indonesia’s stock market fallen? The Jakarta Composite Index (IHSG) has fallen approximately 28% year-to-date as of late June 2026, making it one of the worst-performing major equity markets in the world.
Q: What is a frontier market? Frontier markets are a step below emerging markets in the MSCI classification hierarchy — typically characterized by lower liquidity, higher transaction costs, and less institutional investor participation. Examples include countries like Vietnam, Kazakhstan, and Nigeria.
Q: When will MSCI make its final decision? MSCI extended its review to November 2026. If Indonesia does not demonstrate sufficient progress on market governance reforms by then, a formal reclassification consultation could be launched.
Discover more from The Economy
Subscribe to get the latest posts sent to your email.


On June 24, 2026, Micron Technology shares fell 13% in a single session — the stock’s worst single-day performance since June 5. The memory chipmaker had become a proxy for AI infrastructure demand, a stock that had ridden the AI enthusiasm wave to gains that justified its premium valuation. When it fell, the signal it sent through technology markets was unmistakable: the AI trade is not a one-way bet.
The Micron crash was not an isolated event. It was the latest episode in a pattern of volatility that has characterised the Nasdaq Composite throughout 2026 — a market that has delivered extraordinary returns over the past three years while simultaneously exhibiting the kind of volatility that characterises late-stage speculative cycles.
Understanding what Micron’s collapse reveals — and what it doesn’t — is essential for investors navigating the most complex technology market environment since 1999.
What Actually Happened: The Micron Story
Micron reported fiscal third-quarter results after the close on June 25, 2026. The earnings release came after a session in which the stock had already declined sharply on what appeared to be pre-announcement anxiety. The 13% single-day drop on June 24 — before the results — reflected a combination of factors:
High expectations were embedded in the valuation. Micron had been one of the primary beneficiaries of the AI-driven memory boom, as high-bandwidth memory (HBM) — the type of memory chip most important for AI compute workloads — commands significant pricing premiums and rapid volume growth. A stock priced for perfection leaves no margin for disappointment.
South Korean technology stocks had already broken. The Kospi — South Korea’s benchmark index, heavily weighted toward semiconductor companies including Samsung and SK Hynix — had plunged approximately 10% in the period leading up to the Micron selloff. Given the integrated nature of the global memory supply chain, this was a significant signal.
The SpaceX IPO absorbed market attention and capital. With the SPCX listing consuming enormous institutional bandwidth — and with some evidence of portfolio rebalancing as money rotated into the new AI pure-play listing — technology sector positioning was unsettled heading into the Micron earnings window.
Wedbush Securities’ Dan Ives was among the bulls holding the line. Following his channel checks across Asia and enterprise AI demand trends, Ives saw “no cracks in the armor,” arguing that the South Korean selloff was more likely a pause after a near-100% Kospi rally in 2026 rather than a signal of weakening AI fundamentals. His view: “The selloff in South Korean technology stocks was more likely a pause after a near-100% rally in the Kospi this year, rather than a sign of weakening fundamentals.”
The distinction Ives draws — between valuation-driven volatility and fundamental deterioration — is the central analytical question for investors in AI semiconductors.
The Broader Tech Picture: Nasdaq in a Choppy Range
The Nasdaq Composite closed at 25,476.64 on June 24 — down 0.43% on the day — as the Micron selloff pulled the tech-heavy index lower. The S&P 500 declined 0.10% to 7,358.22, while the Dow Jones Industrial Average — dominated by financials and industrials rather than technology — actually gained 182 points, advancing 0.35%.
This divergence is important. It reflects the continued rotation dynamic that has characterised 2026 markets: investors moving from high-multiple technology and AI stocks into more stable financials, industrials, and defensive sectors. The Dow rising while the Nasdaq falls is a classic late-cycle rotation signal — not necessarily a precursor to a market crash, but a sign that the consensus AI enthusiasm is being repriced.
The Nasdaq’s trajectory in 2026 has been shaped by three conflicting forces:
Bull case: AI capex is real and accelerating ($725 billion from hyperscalers in 2026), enterprise adoption is proceeding even if slowly, and the SpaceX/OpenAI IPO wave is bringing new capital into AI-adjacent public markets.
Bear case: Valuations remain extended relative to earnings, the AI bubble concern is growing (the CEPR launched its AI Bubble Monitor in June), and earnings multiples across the semiconductor sector leave no margin for guidance disappointment.
Wild card: The Federal Reserve’s hawkish turn under Kevin Warsh. Higher-for-longer rates are unequivocally negative for high-multiple growth stocks — the precise companies that dominate the Nasdaq. If BofA’s forecast of three rate hikes materialises, the discount rate applied to future earnings rises, compressing multiples across technology.
Memory Chips Specifically: The Supply-Demand Calculus
Micron’s situation reflects a supply-demand dynamic in memory chips that is more complex than the simple “AI = buy semiconductors” narrative suggests.
High-bandwidth memory (HBM) for AI training and inference is in strong demand, with supply constrained by the technical complexity of the manufacturing process. This segment is performing well for Micron, Samsung, and SK Hynix.
Standard DRAM and NAND flash — the memory types used in conventional computing, consumer electronics, and data storage — remain in a more normalised supply-demand balance. Consumer electronics demand has not recovered to the peaks of the 2021–2022 pandemic era. PC refresh cycles are extending. Mobile upgrade rates are slowing.
The result is a bifurcated memory market where AI-specific products command premium pricing but represent a smaller share of overall revenue, while conventional memory faces ongoing pricing pressure. Investors who extrapolate AI demand across the entire semiconductor industry are making an analytical error.
The South Korea Kospi: A Canary or a Correction?
South Korea’s Kospi is among the most AI-intensive equity markets in the world, with Samsung Electronics and SK Hynix representing major index weights. The 100% Kospi rally in 2026 — before the recent pullback — was one of the most dramatic performances of any major market globally.
A near-100% rally in under a year, in a market concentrated in semiconductor names, followed by a 10% correction is — by historical standards — a healthy pause, not a fundamental reversal. But it deserves scrutiny.
The Kospi’s AI sensitivity cuts both ways. If AI infrastructure demand continues to accelerate, the South Korean memory supply chain is among the primary structural beneficiaries. If AI capital expenditure decelerates — whether from a bubble correction, enterprise budget fatigue, or recession — the Kospi would likely underperform global markets significantly.
Wedbush’s Ives is probably right that the 10% Kospi pullback is a pause, not a peak. But the risk scenario — where AI demand disappointment triggers a more serious Kospi correction — is the kind of fat tail that position sizing should account for.
Oil Prices and Tech: An Overlooked Correlation
One underappreciated dynamic in June 2026 tech markets is the negative correlation between oil price relief and technology performance. As Brent crude fell from elevated levels — reflecting Strait of Hormuz reopening optimism — energy sector stocks declined, while the capital freed from energy inflation concerns did not flow uniformly into technology.
Instead, falling oil prices reduced the inflation urgency that had been supporting gold and energy stocks, while simultaneously creating space for the Fed’s hawkish pivot to dominate the market narrative. The net effect on the Nasdaq was mildly negative, as rate-hike expectations offset the energy relief.
This interconnection illustrates a key feature of 2026 markets: macro factors are more dominant than sector fundamentals in driving short-term price action across equities. A portfolio manager who correctly identified Micron as a fundamentally sound business still lost 13% in a single session because macro sentiment — Fed hawkishness, oil-driven inflation dynamics, and South Korean contagion — overwhelmed the fundamental picture.
The Investment Outlook for AI Semiconductors
Despite the volatility, the long-term structural case for AI semiconductor demand remains intact. The $725 billion hyperscaler AI infrastructure buildout generates genuine and sustained demand for compute hardware. Nvidia’s GPU dominance in AI training is real. HBM demand from data centres will grow as AI models scale.
The relevant question is not whether to own AI semiconductors, but at what price and with what risk management.
The risk-adjusted approach for investors:
Avoid concentration in single names that are priced for perfect execution — a 13% single-day decline on pre-announcement anxiety illustrates the asymmetry of high-expectation positioning.
Consider broader index exposure through semiconductor ETFs (SOXX, SMH) rather than individual stock concentration, allowing participation in structural AI demand without maximum idiosyncratic risk.
Monitor HBM-specific positioning — the AI-specific memory segment that genuinely benefits from training demand — versus conventional memory exposure, which faces different supply-demand dynamics.
Watch the Fed. Three rate hikes by year-end would put meaningful pressure on Nasdaq multiples. The tech sector’s performance in 2H 2026 is as much a function of monetary policy as it is of AI earnings delivery.
Micron’s 13% crash is not the beginning of an AI semiconductor collapse. It is a reminder that valuation matters, expectations matter, and late-cycle technology markets are not immune to gravity.
The South Korean Kospi correction, the SPCX post-IPO decline of 17%, and the Nasdaq’s choppy performance in June 2026 are all consistent with a market that has priced AI excellence aggressively and is now requiring proof of delivery.
The AI semiconductor thesis is intact. The trade needs to earn its valuation — and the process of earning it will involve more of the volatility that June 2026 has delivered.
FAQ
Q: Why did Micron stock drop 13% in June 2026?
A: Micron fell 13% on June 24, 2026 — its worst session since June 5 — amid high earnings expectations, a broader AI semiconductor selloff that followed South Korean technology stock declines, and pre-announcement anxiety ahead of its quarterly results.
Q: Is the Nasdaq in a correction in 2026?
A: The Nasdaq has been volatile in 2026, with multiple single-session declines and a rotation dynamic away from high-multiple technology stocks. As of late June, the index has not entered formal correction territory (a 10% decline from highs), but valuations remain stretched relative to earnings.
Q: Should I buy semiconductor stocks in 2026?
A: The structural case for AI semiconductor demand remains intact, but individual stock selection and entry point matter significantly. Broad-based ETF exposure (SOXX, SMH) reduces idiosyncratic risk compared to single-name concentration. The Federal Reserve’s rate trajectory is a key near-term risk to watch.
Q: What happened to South Korean tech stocks in June 2026?
A: The South Korean Kospi fell approximately 10% from recent highs, with semiconductor-heavy names including Samsung and SK Hynix leading the decline. Most analysts characterised the move as a valuation-driven pause after a near-100% 2026 rally rather than a sign of fundamental AI demand deterioration.
Discover more from The Economy
Subscribe to get the latest posts sent to your email.

How the Iran war, Mediterranean demand consolidation, and Europe’s geopolitical stability premium are producing a structural realignment in global tourism flows that will outlast any single crisis.
Spain is approaching a number that no country has ever reached: 100 million international tourists in a single calendar year. As of the end of April 2026, with 26.6 million arrivals in the first four months alone — a 3.4% increase year-on-year — the trajectory has become, for the first time, a genuine statistical probability. The question facing the Spanish tourism industry, and the global travel market watching it, is not whether the milestone will be crossed but what it will cost, who will pay, and what it means for the structural architecture of global travel flows that produced it.
The answer to that last question is more important than the headline number. Spain’s tourism surge in 2026 is not a story about one country’s beaches and gastronomy. It is a story about how geopolitical instability in one region permanently redirects demand to another, how safety perception drives structural rather than cyclical change in travel behaviour, and why the Mediterranean is consolidating a dominance in global tourism that its infrastructure was not built to absorb.
The Record and Its Arithmetic
Spain’s National Statistics Institute (INE) confirmed that the country received 96.8 million international visitors in 2025, a new all-time record and a 3.2% increase over 2024 — which was itself a record year. International tourist spending in 2025 reached €134.7 billion, a 6.8% increase on the prior year, reflecting a shift toward higher-value, longer-duration travel by wealthier visitors spending more per trip.
In April 2026 alone, Spain received 9.1 million international tourists — a 5.2% increase year-on-year and a new monthly record. March saw 6.8 million visitors, a 3.3% rise. The United Kingdom remained the single largest source market, contributing approximately 1.7 million visitors in April, followed by France with 1.3 million and Germany with 1.2 million. Average expenditure per traveller reached €1,291 in April, with daily spending of €189 — figures that confirm the premium tourism profile driving the spending surge even as volume growth moderates relative to the pandemic-rebound years.
Exceltur, the Spanish tourism alliance, forecasts tourism GDP at €229.4 billion in 2026, representing real growth of 2.4% on 2025 levels, with tourism’s share of the national economy reaching 13.1%. The World Travel & Tourism Council projects Spain’s tourism sector will contribute €315.7 billion to GDP by 2035, representing more than 17% of the Spanish economy, with 4 million jobs — 700,000 more than the 2025 baseline.
The Iran Variable: Geopolitics as a Tourism Accelerant
Behind the headline arithmetic is a geopolitical accelerant that the industry is only beginning to quantify. The ongoing conflict involving Iran has materially redirected travel demand away from Middle Eastern and Eastern Mediterranean destinations toward European markets perceived as safe, accessible, and well-connected. Spain, Italy, and France are the primary beneficiaries of this structural diversion.
Destinations in the Middle East and eastern Mediterranean normally draw up to 181 million visitors annually. That demand does not disappear when regional instability rises — it relocates. Summer flight bookings to Spain rose 32% year-on-year as of early April 2026, while hotel searches increased 28%, according to Sojern, the digital travel intelligence platform. Cruise lines have repositioned itineraries away from Red Sea and Persian Gulf routes, with the freed capacity redeployed on Mediterranean routes where demand is demonstrably stronger and operational risks are judged to be lower.
Phocuswright’s Spain Travel Market Brief 2026 is explicit on the causality: the geopolitical diversion is functioning as “an additional demand driver” on top of an already sustained positive trajectory. But the same analysis notes a critical asymmetry — the uncertainty created by ongoing conflict will require time to reverse. Traveller confidence in Middle Eastern destinations will not recover the moment a ceasefire is announced. The structural reallocation of travel demand toward perceived-safe European destinations may outlast the conflict by years.
A Structural Realignment, Not a Cyclical Bounce
The distinction between structural and cyclical change matters enormously for destination planning, hotel investment, and airline capacity allocation. A cyclical bounce returns to baseline when the disrupting condition resolves. A structural realignment produces a new baseline.
The evidence in Spain’s case points firmly toward structural. The country’s tourism growth pre-dates the Iran conflict by several years. It pre-dates the post-pandemic revenge travel surge by more than that. Spain has consistently grown its international visitor numbers and spending through multiple economic cycles, geopolitical disruptions, and health crises, with growth rates remaining firmly positive throughout. The Iran conflict has added volume to a trend that was already established.
European Travel Commission (ETC) data confirms that Southern Europe captured 11.71% of international travel intent in early 2026, marking a significant year-on-year increase. Within that, Spain captured the largest incremental gain in global travel demand share among benchmark Mediterranean destinations, ahead of Italy and France. Catalonia led regional arrivals in April with 1.9 million visitors, followed by Andalusia at 1.5 million and the Balearic Islands at 1.4 million.
What is particularly notable is the seasonality shift. Demand is no longer concentrated in the summer peak. Visitors are spreading across spring, autumn, and winter with increasing uniformity. For businesses, that distributes revenue more evenly through the year. For residents in popular areas, it means tourism pressure is becoming nearly permanent — which is producing the political backlash that is now the dominant narrative tension in Spain’s otherwise triumphant tourism story.
Overtourism: The Structural Cost of Success
A YouGov poll in 2024 found that 28% of Spaniards held negative views of foreign tourism — the highest rate in Europe. By 2026, the political economy of Spanish tourism has become significantly more complex. In Barcelona, the city government has committed to reducing the number of tourist rental properties by 10,000 by 2028. In Mallorca and Ibiza, short-term rental listings have already been reduced by approximately half. Nearly 70% of Balearic residents have expressed support for visitor caps.
The housing dimension is the most politically charged. Rising short-term rental supply in tourism-heavy cities has contributed to housing costs that outpace local wages, concentrating the economic benefits of tourism among property owners and hospitality businesses while distributing its costs — congestion, noise, displacement — across the broader resident population. Barcelona, San Sebastián, Seville, and the Canary and Balearic Islands are all managing active political tension over tourism capacity.
The Spanish government’s response has been measured: promoting higher-value, longer-stay, off-peak travel to reduce the per-arrival footprint; investing in infrastructure for northern and inland regions that remain significantly under-touristed; and implementing regulatory frameworks for short-term rentals that attempt to balance housing markets with legitimate hospitality supply.
The tourism-resident conflict in Spain is not exceptional. It is the leading edge of a pattern that will define destination governance globally as travel volumes continue to grow. Amsterdam, Venice, Kyoto, and Dubrovnik have all enacted visitor limitations in recent years. Spain’s scale makes its experience the most important test case for how high-income democracies manage the political economy of mass tourism without destroying the economic engine that funds the services residents depend on.
Spain’s Competitive Positioning in the Global Market
Spain’s emergence as the dominant beneficiary of geopolitical demand diversion is not accidental. It reflects a set of structural advantages that cannot be easily replicated by competing destinations on a short time horizon.
Infrastructure depth is the first advantage. Spain has large international airports — Madrid Barajas and Barcelona El Prat are two of Europe’s five busiest — major cruise ports on both Atlantic and Mediterranean coasts, and a high-speed rail network that connects mainland cities efficiently. The carrying capacity of this infrastructure is sufficient to absorb demand surges that would overwhelm smaller destinations.
Destination diversification is the second advantage. Spain offers beach tourism on four distinct coastlines, major urban cultural destinations (Madrid, Barcelona, Seville, Valencia), gastronomy tourism of global reputation, skiing in the Pyrenees and Sierra Nevada, and rural agrotourism across regions including La Rioja, Extremadura, and Galicia. No single demand category saturates the country’s capacity simultaneously — though the concentration of international arrivals in a handful of regions means that regional infrastructure remains under severe pressure.
Safety perception — relative to the Middle Eastern and eastern Mediterranean alternatives — is the third and currently most powerful advantage. Spain’s measured stance on foreign conflicts has allowed it to project stability to key visitor markets (UK, Germany, France, US) while its geographic position as a Western European democracy with NATO membership provides the institutional reassurance that wary travellers increasingly demand before booking non-refundable travel.
The 100 Million Question
Spain received approximately 96.8 million international tourists in 2025. The first four months of 2026 grew 3.4% year-on-year. Applying that rate to the full 2025 baseline produces a figure of approximately 100.1 million — comfortably above the symbolic threshold. But the final 2026 total will be determined by factors not yet known: summer weather patterns, air capacity constraints, fuel costs, household budget pressure in key source markets, and the trajectory of the Middle East conflict through the peak travel season.
What can be stated with confidence is that the structural conditions producing Spain’s tourism surge are neither temporary nor self-correcting. The geopolitical demand diversion from the Middle East will persist for as long as the conflict and its reputational aftermath endure. The Mediterranean’s safety premium relative to other long-haul alternatives will compound over time as infrastructure investment follows demand. And Spain’s fundamental tourism proposition — climate, culture, cuisine, connectivity — is not subject to the same political and security risks affecting its competitors for global travel demand.
The country approaching 100 million visitors is not the same country that first broke its previous records in the mid-2010s. It is wealthier by tourism spend, more diversified by season, more invested in premium visitor profiles, and more politically aware of the social costs of the industry it depends on. Managing the next 100 million — how many come, where they go, how long they stay, and what they spend — is the most consequential economic policy question facing Spanish tourism for the remainder of the decade.
Frequently Asked Questions (FAQs)
- Q: How many tourists visited Spain in 2026?
- A: Spain received 96.8 million international tourists in 2025, a new record, and is on course to approach or exceed 100 million in 2026 based on early data showing 3.4% year-on-year growth in the first four months.
- Q: Why is Spain breaking tourism records in 2026?
- A: Spain is benefiting from a combination of its established tourism infrastructure, safety perception relative to the Middle East, and geopolitical demand diversion from conflict-affected regions redirecting travellers toward stable European destinations.
- Q: What is overtourism in Spain?
- A: Overtourism refers to the strain on infrastructure, housing markets, and quality of life in popular Spanish destinations — including Barcelona, Mallorca, and the Canary Islands — caused by visitor volumes that exceed the carrying capacity of local communities and environments.
Discover more from The Economy
Subscribe to get the latest posts sent to your email.

From $438 billion in 2012 to a projected $1.4 trillion by 2029, wellness tourism has moved from a niche indulgence to the fastest-growing structural force in the $1.6 trillion global travel economy
When Hilton Hotels asked travellers what was driving their 2026 leisure decisions, 56% named a single motivation: to rest and recharge. Not to see a landmark. Not to tick off a bucket list. Not to attend an event. To rest. That answer — drawn from Hilton’s 2026 Trends Report, The Whycation: Travel’s New Starting Point — encapsulates a structural transformation underway in the $1.6 trillion global travel economy, one that has already produced a market now valued at close to $1 trillion and forecast to reach $1.4 trillion by the end of the decade.
Wellness tourism is no longer a niche amenity marketed to the affluent. It is the fastest-growing segment of the global travel industry by both absolute value and growth rate — and the operators, platforms, and destinations that treat it as a premium add-on rather than a core structural trend are misreading what is happening beneath the surface.
The Numbers That Define the Shift
The Global Wellness Institute places the wellness tourism market at $894 billion in 2024, more than double the $438 billion recorded in 2012 — a figure that surpasses pre-pandemic levels by 36%. Phocuswright and WiT’s Online Travel Tracker: The Wellness Stack projects the market will reach $1.4 trillion by 2029, growing at a compound annual rate of 9.1%.
Grand View Research places the 2025 market valuation at $990.4 billion, projecting growth to $1.085 trillion in 2026 and $2.4 trillion by 2035, at a CAGR of 9.3%. The variance across forecasting houses reflects different methodology and scope, but the directional consensus is unambiguous: wellness tourism is expanding faster than any other major travel segment, and its growth is accelerating as it moves from a secondary travel purpose to a primary one.
North America holds the largest regional share at approximately 35%, driven by high consumer spending on preventive health and premium spa retreats. Asia-Pacific is the fastest-growing region, with countries including Thailand, India, Indonesia, and Japan emerging as globally competitive wellness destinations through traditional healing practices — Ayurveda, yoga, onsens, forest bathing — that cannot be replicated at scale elsewhere. Europe maintains a 30% share, anchored by established spa cultures in Central and Eastern Europe and rapidly expanding luxury wellness infrastructure in Southern Europe.
Search Data Reveals Demand Beneath the Headlines
The consumer demand underpinning these projections is not abstract. Trip.com and Google’s 2025 “Why Travel?” report tracked year-on-year search growth across wellness categories in H1 2025 that signal a mainstream, not specialist, market:
- “Golf and spa resorts” searches grew 300% year-on-year
- “All inclusive spa” searches grew 250% year-on-year
- “Ski and spa” searches grew 250% year-on-year
- “Spa destination experiences” grew 140% year-on-year
- “Japanese tea ceremonies” grew 53% year-on-year
- “Onsens” grew 20% year-on-year
These are not searches by a niche demographic of yoga practitioners and meditation enthusiasts. Golf and spa resort searches growing at 300% represent an affluent, mainstream consumer base integrating wellness into existing travel patterns. That integration — wellness as a design element within conventional travel, rather than wellness as the sole purpose of a dedicated trip — is the most important structural feature of the current growth cycle.
The Whycation: How Traveller Motivation Is Changing
Phocuswright defines wellness tourism as “travel associated with the pursuit of maintaining or enhancing one’s personal wellbeing” — a proactive effort to maintain health and augment wellbeing, distinct from reactive medical tourism. What the 2026 data adds to this definition is urgency. Travellers are not booking wellness trips when it fits. They are budgeting for wellness experiences even when they cut back elsewhere.
Hilton’s 2026 Trends Report found that 67% of American travellers reported a stronger interest in nature immersion retreats, 60% in spiritual retreats, and 56% in meditation or silent retreats — figures that would have been implausible in any pre-pandemic survey of mainstream travel intent. The same report identified “the Whycation” as travel’s new starting point: trips defined not by destination but by outcome. The destination is incidental. The restorative function is the product.
McKinsey’s 2025 Future of Wellness report added demographic texture: millennials and Gen Z are spending more on wellness than on any other category, while Boomers are driving demand for longevity travel and preventive health experiences. The market has no dominant age cohort. It is growing across generations with different motivations and different price sensitivities, producing a product spectrum from accessible domestic wellness getaways to ultra-premium longevity resorts charging thousands per night.
Capital Is Following the Consumer
The investment response to wellness tourism’s growth trajectory is becoming visible in several simultaneous trends.
Hotel majors are incorporating wellness as a core product line rather than a spa add-on. Hyatt acquired miraval and Exhale to establish direct wellness brand positioning. Marriott has expanded its W Hotels wellness programming and integrated longevity-focused amenities across multiple tiers. The Oberoi Group launched Asmi by Oberoi in October 2025, a structured wellness programme built around five pillars — movement, nutrition, bodywork, breathwork, and mindfulness — delivered across its resort portfolio.
Cruise lines are incorporating floating wellness clinics into itineraries, responding to demand from professionals who cannot commit to destination stays. Canyon Ranch — the Arizona-founded wellness brand that helped define the category — now operates collaborations with Celebrity and Regent cruise lines, and opened a new wellness club in Austin’s Texas Hill Country in 2025, bringing premium wellness closer to urban markets without requiring multi-day commitment.
Incentive travel is undergoing a parallel structural shift. Australia has seen wellness move from a retreat option to a strategic design element in corporate incentive programmes, linked explicitly to productivity, engagement, and retention. This positioning — wellness as a measurable performance investment rather than a perk — significantly expands the addressable corporate travel budget.
Sleep Tourism: The Fastest-Growing Sub-Segment
Within wellness tourism’s already rapid expansion, sleep tourism is growing faster still. The global sleep tourism market was valued at $72.6 billion in 2024 and is projected to reach $237.9 billion by 2034 — a CAGR that substantially exceeds the broader wellness travel market.
The demand is documented in consumer behaviour data: 70% of luxury travellers choose hotels with sleep-centric amenities, and more than half of global respondents report sleeping better in hotels than at home. Miraval Arizona has made sleep optimisation a centrepiece of its 2026 strategy, integrating AI beds, sound therapy, and personalised sleep coaching — commodities that resonate precisely because the same traveller who cannot sleep in their own home is willing to travel to access therapeutic infrastructure they cannot build themselves.
RESET Hotel near Joshua Tree, which opened in mid-2025, exemplifies the new property model: hypnotherapy, yoga nidra, sound baths, and breathwork in a silence-optimised desert setting. Off-grid analogue lodges in the US — including LeConte Lodge, Hike Inn, and Muir Trail Ranch — are reporting unprecedented demand from families and professionals specifically seeking to disconnect from screens. The paradox is that the most expensive amenity some properties can now offer is the absence of connectivity.
What the $1.4 Trillion Forecast Means for OTAs and Distribution
The booking infrastructure question is wellness tourism’s most consequential commercial gap. Phocuswright and WiT’s Wellness Stack report identifies meaningful gaps in online booking infrastructure for wellness travel: the product is complex, frequently composed of bundled services with variable availability, and poorly served by the standardised booking interfaces designed for commodity accommodation transactions.
This creates a structural opportunity — and a structural risk. The opportunity: operators that invest in bookable wellness inventory across OTA and direct channels capture demand that is currently lost because the friction of booking is too high. The risk: OTAs that move faster than hotels and wellness operators to build structured wellness product pages will replicate the same intermediary dynamic that defines the accommodation market.
Klook, one of the leading online travel agencies focused on experiences, filed for a US IPO in late 2025. Expedia is expanding its experiences offering through the acquisition of Tiqets. Tripadvisor has confirmed its intention to merge its core brand with Viator, the experiences booking platform. The consolidation of the experiences booking infrastructure is happening now, in real time, and wellness experiences — spa bookings, retreat packages, longevity programmes — are directly in its path.
The Regenerative Turn
Wellness tourism is increasingly promoted alongside regenerative and sustainable tourism, positioning wellness for the traveller alongside wellness for the destination itself. This framing matters commercially because it shifts the competitive differentiation from price and amenity to mission and values — categories in which independent wellness destinations have structural advantages over major chains.
The Global Wellness Institute estimated the total wellness economy at $6.8 trillion in 2024, growing 7.9% year-on-year, with a forecast of $9.8 trillion by 2029. Wellness tourism, at $894 billion, represents approximately 13% of that total — a share that is growing as the wellness economy’s fastest-expanding vertical. The destinations and operators that understand they are competing not just against other travel products but against the entire wellness economy — gyms, supplements, apps, wearables — will price, package, and distribute their product accordingly.
The traveller seeking a nature immersion retreat in 2026 has a Whoop subscription, a Headspace account, and a Peloton in their home gym. The proposition travel must beat is not a cheap flight and a hotel room. It is transformation that requires physical presence in a place capable of delivering it.
FAQs
- Q: How big is the wellness tourism market in 2026? A: The wellness tourism market is estimated at approximately $1 trillion in 2026, having grown from $438 billion in 2012 to $894 billion in 2024, with projections to reach $1.4 trillion by 2029.
- Q: What is the fastest-growing wellness travel segment? A: Sleep tourism is the fastest-growing sub-segment, with the market projected to grow from $72.6 billion in 2024 to $237.9 billion by 2034.
- Q: What is regenerative tourism? A: Regenerative tourism is travel designed to improve the destination and local community, not just the traveller — pairing personal wellness with environmental and cultural restoration.
Discover more from The Economy
Subscribe to get the latest posts sent to your email.

AI Semiconductor Selloff 2026: Micron Crash, Nasdaq Pullback & What Comes Next

US Tariffs 2026: How Trump’s 11.7% Effective Rate Is Reshaping Global Trade & Inflation

Global Stock Markets 2026: S&P 500 at Record Highs Amid War, Inflation & Rate Risk

Spain Near 100M Tourists: A Structural Travel Map Shift : Booming Travel Economy

Wellness Tourism’s $1 Trillion Rise Is Rewriting Travel Rules

Warsh’s Fed Kills the Rate-Cut Trade:Inflation, and Your Money

Indonesia vs. MSCI, Greenspan’s Legacy vs. Warsh’s Revolution, Micron vs. the Memory Shortage: A Global Finance Scorecard for Mid-2026

The End of Visa and Mastercard’s Monopoly? Rise of Alternatives

AI’s Energy Hunger Is Rewriting Global Power Markets: Reshaping the World Economy

UK Political and Economic Turmoil: Rachel Reeves’ Fall, Britain’s Fiscal Crisis

China’s Export Miracle Masks a Property Disaster: Growing Without Its People

Indonesia’s $1.5 Trillion Economy on the Edge: chances of MSCI Downgrade

Oil Falls to $70 as US-Iran Peace Talks Advance: Global Energy Markets

Micron’s $41.5 Billion Quarter: How AI’s Insatiable Memory Hunger Is Reshaping the Semiconductor Industry

KPMG Australia CEO Resigns After Whistleblower Claims Exposed Investigation Failures

PwC China Partner Payouts Cut Amid Evergrande Audit Fraud

Broadcom Market Value Loss: Revenue Forecast Disappoints

Pakistan Budget FY 2026-27: Relief, Prospects, and the Tightrope Walk

Investors Pile Into Bullish Dollar Bets as ‘US Exceptionalism’ Trade Returns

Here’s How Much It’ll Cost You to Be Part of SpaceX’s Record-Breaking $75 Billion IPO

Nasdaq Tumbles 4% as Chip and Memory Stocks Sink: A $1.2 Trillion Wipeout

Japanese Mid-Sized Firms Flock to Southeast Asia for Growth

Smash Capital Leads $200M Funding for Allen Control Systems

How to Fix Pakistan’s Debt Economy: A Structural Blueprint

Chip Stocks Race Toward Biggest Gains Since Dotcom Era on AI Demand

New Investment Super-Cycle: AI, Green Energy & Re-Shoring

Democrats Draw a Red Line Around Military AI — And the Pentagon Is Already Pushing Back

Russia Overspends on Putin’s War in Ukraine by $28bn
-

 Markets & Finance6 months ago
Top 15 Stocks for Investment in 2026 in PSX: Your Complete Guide to Pakistan’s Best Investment Opportunities
-

 Analysis4 months ago
Top 10 Stocks for Investment in PSX for Quick Returns in 2026
-

 Analysis5 months ago
Brazil’s Rare Earth Race: US, EU, and China Compete for Critical Minerals as Tensions Rise
-

 Analysis4 months ago
Johor’s Investment Boom: The Hidden Costs Behind Malaysia’s Most Ambitious Economic Surge
-

 Banks5 months ago
Best Investments in Pakistan 2026: Top 10 Low-Price Shares and Long-Term Picks for the PSX
-

 Investment6 months ago
Top 10 Mutual Fund Managers in Pakistan for Investment in 2026: A Comprehensive Guide for Optimal Returns
-

 Global Economy6 months ago
15 Most Lucrative Sectors for Investment in Pakistan: A 2025 Data-Driven Analysis
-

 Global Economy6 months ago
Pakistan’s Export Goldmine: 10 Game-Changing Markets Where Pakistani Businesses Are Winning Big in 2025