
Geopolitics
Global Cooperation Barometer 2026: Why International Collaboration Isn’t Dead—It’s Just Evolving [WEF Report Analysis]

While 123 million people were forcibly displaced in 2024—the highest number on record—global cooperation metrics held remarkably steady. This paradox lies at the heart of the World Economic Forum’s Global Cooperation Barometer 2026, a comprehensive analysis that challenges our assumptions about international collaboration in an age of rising tensions.
The third edition of this landmark report, developed in partnership with McKinsey & Company, reveals a nuanced truth: global cooperation isn’t collapsing—it’s transforming. Traditional multilateral frameworks may be straining under geopolitical pressures, but smaller, more agile coalitions are emerging to fill critical gaps in trade, technology transfer, climate action, and even security.
This evolution represents what UN Secretary-General António Guterres calls “hard-headed pragmatism”—the recognition that cooperation makes sense when it delivers tangible mutual benefits, even in a fragmented world.
What is the Global Cooperation Barometer 2026?
The Global Cooperation Barometer is an annual assessment by the World Economic Forum and McKinsey & Company that measures international collaboration across five key areas: trade and capital, innovation and technology, climate and natural capital, health and wellness, and peace and security. Using 41 metrics indexed to 2020, the 2026 edition finds overall cooperation held steady despite geopolitical tensions, but its composition shifted dramatically—from large multilateral frameworks toward smaller, flexible coalitions based on aligned interests and pragmatic problem-solving.
After analyzing 41 distinct metrics across five essential pillars—trade and capital, innovation and technology, climate and natural capital, health and wellness, and peace and security—the report’s central finding is clear: cooperation is adapting to new realities rather than disappearing entirely.
The Surprising Resilience of Global Cooperation
The 2026 Global Cooperation Barometer tracks international collaboration from 2012 through 2024, with all data indexed to 2020 as a baseline. This methodology, endorsed by OECD economists, allows researchers to isolate trends that emerged before the COVID-19 pandemic and those accelerated by it.
The topline finding? Overall cooperation levels in 2024 remained virtually unchanged from 2023, despite an environment characterized by:
- Escalating trade barriers and protectionist policies
- Multiple active military conflicts across three continents
- Heightened mistrust between major economic powers
- Record levels of forced displacement
- Increasing restrictions on technology transfers
According to Børge Brende, President and CEO of the World Economic Forum, “The paradox is that, at a time of such rapid change, developing new and innovative approaches to cooperation requires refocusing on some of the basics—notably, doubling down on dialogue.”
Understanding the Methodology
The barometer’s rigor lies in its comprehensive approach. Each of the five pillars comprises two indices:
- Action Index: Measures concrete cooperative behaviors (trade flows, knowledge exchange, financial transfers)
- Outcome Index: Tracks results of cooperation (life expectancy, emissions levels, conflict casualties)
Data is normalized to account for economic growth and population changes, ensuring that trendlines reflect genuine cooperation shifts rather than simple expansion. For example, trade metrics are measured as a percentage of global GDP, while migration data is normalized to global population levels.
This methodology, reviewed by International Monetary Fund economists, provides an apples-to-apples comparison across vastly different domains—from pharmaceutical R&D cooperation to peacekeeping deployments.
The Composition Shift That Matters
While aggregate cooperation held steady, the composition of that cooperation shifted dramatically. Metrics tied to global multilateral institutions—those large-scale frameworks involving most of the world’s nations—declined sharply:
- UN Security Council resolutions fell from 50 in 2023 to 46 in 2024
- Multilateral peacekeeping operations dropped by 11% year-over-year
- Official Development Assistance plummeted 10.8% in 2024
- International Health Regulations compliance weakened
Simultaneously, cooperation flourished in areas where flexible, interest-based partnerships could operate:
- Cross-border data flows surged, with international bandwidth now 4x larger than pre-pandemic levels
- Services trade continued its five-year growth trajectory
- Climate finance reached record levels, approaching $1 trillion annually
- Foreign direct investment in strategic sectors (semiconductors, data centers, EV batteries) accelerated
This divergence reveals a fundamental shift: from universal frameworks to tailored coalitions. As McKinsey’s research demonstrates, cooperation increasingly follows geopolitical alignment, with partners choosing collaborators based on shared interests and values rather than institutional membership alone.
Trade and Capital: Reconfiguration Over Retreat
The trade and capital pillar reveals perhaps the most complex story in the entire report. On the surface, cooperation appears flat—neither advancing nor retreating significantly. But beneath this stability, tectonic plates are shifting.
The Great Trade Rearrangement
According to World Trade Organization data analyzed in the report, global goods trade grew slightly slower than overall GDP in 2024, leading to a marginal decline in trade intensity. More revealing than the volume, however, is the geographic redistribution underway.
McKinsey Global Institute research finds that the average “geopolitical distance” of global goods trade fell by approximately 7% between 2017 and 2024. Countries are trading more with geopolitically aligned partners and less with distant ones—particularly between the United States and China.
The numbers tell a stark story:
- US imports from China fell 20% in the first seven months of 2025 compared to the same period in 2024
- Developing countries’ share of manufacturing exports rose by 5 percentage points in 2024
- China represented over half of this growth, adding $276 billion in exports
- Trade concentration (measured by the Herfindahl-Hirschman Index) declined by about 1%, indicating slight diversification
“We’re witnessing not deglobalization but reglobalization,” explains Dr. Richard Baldwin, Professor of International Economics at the Graduate Institute Geneva. “Trade relationships are being rewired along lines of trust and strategic alignment.”
The Silent Surge in Services and Capital
While goods trade reconfigured, less visible but equally important flows accelerated. Services trade—encompassing IT services, professional services, travel, and digitally delivered offerings—continued climbing throughout 2024.
According to UNCTAD data, services trade growth was driven primarily by:
- Digitally delivered services: IT consulting, cloud services, software development
- Business services: R&D, engineering, professional services
- Travel services: Rebounding from pandemic lows, though not yet at 2019 levels
Foreign direct investment told a similar story. While overall FDI flows remained complex (influenced by “phantom FDI” in tax havens), greenfield investment announcements—representing real productive capacity—surged in future-shaping industries.
FDI Markets data reveals a striking trend: newly announced greenfield projects concentrated heavily in:
- Semiconductors: $89 billion in announced projects globally
- Data centers and AI infrastructure: $370 billion (up from $190 billion in 2024)
- EV battery manufacturing: $67 billion
- Critical minerals processing: $34 billion
These investments flowed predominantly between geopolitically aligned partners. Advanced economies, particularly the United States, attracted the lion’s share, while China’s portion of announced FDI inflows dropped from 9% (2015-19 average) to just 3% (2022-25).
The Multilateral Casualty: Foreign Aid
The sharpest decline in the trade and capital pillar came in Official Development Assistance. According to OECD tracking, ODA fell 10.8% in 2024, with only four donor countries exceeding the UN target of 0.7% of gross national income.
The 2025 outlook appears even bleaker. The OECD projects an additional 9-17% decline in ODA, driven by:
- Reduced humanitarian aid budgets
- Decreased refugee spending in donor countries
- Lower aid to Ukraine as military assistance shifts
- Domestic political pressures in major donor nations
This trend has profound implications for low and middle-income countries that depend on international assistance for health systems, education, and infrastructure development.
New Coalition Models Emerge
Despite these challenges, innovative cooperation frameworks are sprouting. The Future of Investment and Trade (FIT) Partnership, launched in September 2025, brings together 14 economies—including Singapore, New Zealand, Switzerland, and the UAE—to pilot practical trade cooperation mechanisms.
According to Brookings Institution analysis, such “minilateral” arrangements offer several advantages over traditional multilateral treaties:
- Speed: Smaller groups reach consensus faster
- Flexibility: Tailored agreements address specific needs
- Resilience: Less vulnerable to any single member’s withdrawal
- Pragmatism: Focus on mutual gains rather than universal principles
Other examples include the EU-Mercosur trade agreement (after a decade of negotiations), the ASEAN Digital Economy Framework Agreement, and bilateral critical minerals deals between the US and allies like Australia and Canada.
Innovation and Technology: The AI Race Drives Selective Cooperation
The innovation and technology pillar registered a 3% year-over-year increase—one of the strongest performances across all five domains. Yet this growth masks growing tensions over technology transfer, particularly in areas deemed strategically sensitive.
The Data Flow Explosion
International bandwidth capacity quadrupled between 2019 and 2024, according to International Telecommunication Union statistics. Cross-border data flows—measured as a percentage of total internet traffic—continued their upward trajectory, fueled by:
- Cloud computing adoption accelerating globally
- Remote work normalizing post-pandemic
- Streaming services expanding internationally
- AI model training requiring distributed datasets
Cisco’s annual internet report projects that global IP traffic will reach 4.8 zettabytes per year by 2027, with a growing share crossing international borders.
This digital connectivity enabled a corresponding rise in IT services trade. Software development, cloud services, and AI consultation increasingly operate as global markets, with talent and expertise flowing across borders despite physical restrictions.
The Strategic Technology Paradox
Even as general technology cooperation flourished, restrictions tightened on specific advanced technologies. The United States expanded export controls on:
- Advanced semiconductors and chipmaking equipment
- AI training systems above certain computational thresholds
- Quantum computing components
- Certain biotechnology applications
According to McKinsey research on export controls, these restrictions primarily target China but ripple across global supply chains, affecting companies and research institutions worldwide.
The paradox? Cooperation in cutting-edge technologies continues—but increasingly within aligned blocs. Examples include:
US-Aligned Technology Partnerships:
- US-India Initiative on Critical and Emerging Technology (iCET)
- US-EU Trade and Technology Council advancing AI safety standards
- US-Japan semiconductor research collaboration
- US-UAE framework on advanced technology cooperation
China-Led Technology Initiatives:
- 5G infrastructure partnerships across Southeast Asia and Africa
- AI research centers in Gulf states
- Data center investments in emerging markets
- Technology transfer agreements with Belt and Road countries
Foreign Affairs magazine describes this as “technological bifurcation”—not complete decoupling, but the emergence of parallel ecosystems with limited interconnection.
The Student Visa Squeeze
One concerning trend threatens long-term technology cooperation: declining international student mobility. After reaching record highs in 2024 (up 8% from 2023), international student flows appear to be contracting in 2025.
Data from major destination countries shows:
- United States: F-1 and M-1 student visas down 11% in Q1 2025
- United Kingdom: Student visa grants fell 2% year-over-year
- Australia: International student approvals dropped 64% (driven by new policy restrictions)
- Canada: Study permits declined amid new caps on international students
According to the Institute of International Education, this reversal could have long-term consequences for innovation. Historically, international students have contributed disproportionately to research breakthroughs, entrepreneurship, and cross-border knowledge networks.
Dr. Mary Sue Coleman, President of the Association of American Universities, warns: “When we restrict the flow of talent, we don’t just hurt international students—we diminish our own innovative capacity.”
The Productivity Question
Despite increases in most innovation metrics, one crucial outcome measure remained stubbornly flat: total factor productivity growth. The Conference Board’s data shows global productivity growth has stagnated for over a decade, raising questions about whether current cooperation patterns effectively translate into tangible economic benefits.
However, McKinsey Global Institute research suggests this may change. Generative AI could increase global productivity growth by 0.1 to 0.6 percentage points annually through 2040, but only if cooperation enables:
- Cross-border data access for model training
- International talent mobility for AI development
- Shared safety standards and governance frameworks
- Collaborative research on frontier applications
The question isn’t whether technology cooperation will matter—it’s whether current cooperation patterns will be sufficient to realize these gains.
Climate and Natural Capital: Deployment Rises, Outcomes Lag
The climate and natural capital pillar demonstrates both the promise and limitations of current cooperation patterns. Investment and deployment reached record levels, yet environmental outcomes continue deteriorating.
The Clean Energy Deployment Surge
Solar and wind capacity additions doubled between 2022 and 2024—from 300 to 600 gigawatts—according to the International Renewable Energy Agency. In the first half of 2025 alone, installations were 60% higher than the same period in 2024.
Remarkably, in the last 18 months, the world installed more solar capacity than in the previous three years combined.
International Energy Agency analysis attributes this acceleration to:
- Dramatic cost reductions: Solar module prices fell 90% over the past decade
- Global supply chains: Chinese manufacturing scale drove affordability
- Policy alignment: Domestic energy security goals converged with climate objectives
- Climate finance flows: Both public and private investment reached near $1 trillion annually
China accounted for two-thirds of solar, wind, and electric vehicle additions, but developing economies showed strong momentum. India became the world’s second-largest solar installer, while Brazil accelerated wind and solar deployment significantly.
The Natural Capital Challenge
While energy transition metrics improved, natural capital indicators stagnated or worsened:
- Marine protected areas: Growth stalled during 2023-24
- Terrestrial protected areas: Expansion slowed after steady progress
- Ocean Health Index: Continued gradual decline
- Biodiversity loss: Accelerated despite international commitments
The UN’s High Seas Treaty, reaching the required 60 ratifications in late 2025, offers hope. Entering force in January 2026, it creates the first legally binding framework for protecting two-thirds of the ocean beyond national jurisdiction.
Yet implementation remains uncertain, and the treaty faces the same multilateral pressures affecting other global agreements.
The Emissions Reality Check
Despite record clean energy deployment, global greenhouse gas emissions continued rising in 2024. Global Carbon Project data shows fossil fuel emissions reached approximately 37.8 billion tonnes of CO2 in 2024, up from 37.3 billion tonnes in 2023.
According to McKinsey Global Institute research, the energy transition is progressing at roughly half the speed needed to meet Paris Agreement goals of limiting warming to 1.5°C.
There is one encouraging trend: emissions intensity (emissions per unit of GDP) continues declining, demonstrating that economic growth can occur alongside emissions management—even if absolute reductions remain elusive.
Regional Climate Coalitions Take the Lead
As comprehensive global agreements prove challenging, regional cooperation is filling gaps:
European Union Initiatives:
- The Clean Industrial Deal (February 2025) aims to make decarbonization a competitive advantage
- The Net-Zero Industry Act accelerates manufacturing of clean technologies in Europe
- The Critical Raw Materials Act secures strategic inputs for the energy transition
- The EU-Central Asia Hydrogen Partnership (September 2025) creates new clean energy corridors
ASEAN Cooperation:
- The LTMS-PIP (Laos-Thailand-Malaysia-Singapore Power Integration Project) enables cross-border clean power trading
- Progress toward an integrated ASEAN Power Grid enhances energy security while enabling renewable deployment
- The ASEAN Community Vision 2025 and Master Plan on ASEAN Connectivity both reached target dates with mixed implementation
COP30 Outcomes: The UN climate conference in Brazil produced several commitments:
- Tripling of adaptation finance by 2035
- Launch of the Tropical Forests Forever Facility to boost investment in protected areas
- New mechanisms for loss and damage funding
Climate Policy Initiative analysis notes that while these commitments are significant, the critical challenge remains implementation—translating pledges into deployed capital and measurable emissions reductions.
The Just Energy Transition Shortfall
One area of cooperation that significantly underperformed expectations: the Just Energy Transition Partnerships (JETPs). These international financing mechanisms aim to assist emerging economies in transitioning to low-emission energy systems.
Despite commitments totaling $50 billion, only $7 billion had been delivered by June 2025—a 86% shortfall. According to World Resources Institute analysis, delays stemmed from:
- Bureaucratic complexity in mobilizing multilateral funds
- Competing domestic priorities among donor nations
- Difficulty coordinating between multiple financial institutions
- Recipients’ concerns about sovereignty and conditionality
This underperformance illustrates a broader challenge: while climate cooperation shows resilience in some areas (financing, trade, technology deployment), translating commitments into action remains difficult in the current geopolitical environment.
Health and Wellness: Resilient Outcomes, Eroding Support
The health and wellness pillar presents perhaps the most deceptive picture in the entire barometer. Overall cooperation appears stable—but this masks a dangerous erosion of the foundational support systems that enable positive health outcomes.
The Outcome Resilience
All major health outcome metrics improved in 2024, according to the Institute for Health Metrics and Evaluation:
- Life expectancy continued its post-pandemic recovery
- Child mortality (under-five) declined further
- Maternal mortality decreased in most regions
- Disability-adjusted life years (DALYs) improved globally
These improvements reflect long-term developmental trends, post-pandemic normalization, and the cumulative effect of previous investments in global health systems.
However, health experts warn these improvements may prove temporary if current trends in health cooperation continue.
The Development Assistance Crisis
Development Assistance for Health fell 6% to $50 billion in 2024—continuing a three-year downward trend. IHME projections suggest an additional $11 billion decline in 2025, largely due to expected cuts from US funding agencies (approximately $9 billion).
Major donor reductions include:
- United States: PEPFAR (President’s Emergency Plan for AIDS Relief) facing budget pressures; USAID tightening cost-sharing requirements
- United Kingdom: Continued retrenchment in global health spending amid domestic fiscal pressures
- Germany: ODA cuts affecting health assistance
According to World Health Organization officials, this creates a dangerous dynamic: bilateral health assistance increasingly focuses on direct service delivery (medicines, diagnostics, frontline care) while reducing support for health system infrastructure, training, and governance.
Dr. Tedros Adhanom Ghebreyesus, WHO Director-General, describes this as “robbing Peter to pay Paul—we’re treating today’s patients while dismantling the systems needed to care for tomorrow’s.”
The Multilateral-Bilateral Shift
A significant trend emerged in 2024: funding through multilateral channels (WHO, Global Fund, multilateral development banks) fell by approximately 20%, while bilateral country-to-country funding declined only 3%.
This shift toward bilateral assistance has several implications:
Potential Benefits:
- More direct accountability between donor and recipient
- Faster deployment to specific needs
- Reduced bureaucratic overhead
- Clearer metrics for impact assessment
Significant Risks:
- System-level costs (training, governance, infrastructure) go unfunded
- Recipients face increased burden on domestic budgets
- Coordination between different bilateral programs weakens
- Political considerations may override health priorities
- Smaller countries with less strategic importance receive less support
Pandemic Preparedness in Limbo
The WHO Pandemic Agreement, adopted in May 2025 after three years of challenging negotiations, represents both an achievement and a disappointment in health cooperation.
On one hand, the agreement marks the first binding global framework for pandemic response, addressing lessons from COVID-19 around:
- Equitable access to vaccines and therapeutics
- Information sharing during outbreaks
- Research collaboration and pathogen surveillance
- Capacity building in low-resource settings
On the other hand, the United States—the world’s largest economy and historically the leading contributor to global health—did not participate in the agreement. This absence raises questions about the framework’s practical effectiveness.
Dr. Jennifer Nuzzo, Director of the Pandemic Center at Brown University School of Public Health, notes: “Treaties create obligations on paper, but pandemic preparedness requires sustained investment, trust, and coordination—all of which are in short supply in the current environment.”
Regional Health Cooperation Gains Ground
As global multilateral frameworks face pressure, regional cooperation showed promising developments:
Africa:
- The African Medicines Agency held its second session in Kigali (June 2025), advancing pharmaceutical regulatory harmonization
- The Accra Compact aligned African governments on health sovereignty priorities
- South Africa’s Aspen Pharmacare expanded COVID-19 vaccine manufacturing for the continent
Caribbean:
- The Organisation of Eastern Caribbean States scaled a model to reduce insulin prices region-wide
- Negotiations advanced on a Caribbean pharmaceutical procurement alliance
Latin America:
- Brazil’s Butantan Institute partnered with other regional manufacturers on vaccine development
- The Pan American Health Organization (PAHO) strengthened regional disease surveillance
The Lancet, in a November 2025 editorial, described these developments as “pragmatic regionalism”—a recognition that health security increasingly depends on strong regional capacity rather than solely on global institutions.
The Healthspan-Lifespan Gap
One troubling trend that demands attention: while life expectancy continues rising, “health-adjusted life expectancy” (years lived in good health) lags behind. According to research published in JAMA Network Open, this means people are living more years with illness and disability.
This “healthspan-lifespan gap” varies significantly by geography and socioeconomic status, but it’s widening in most regions—suggesting that current health cooperation patterns, while extending life, may be less effective at ensuring those additional years are healthy and productive.
Peace and Security: The Pillar Under Greatest Strain
No pillar declined as sharply as peace and security. Every single metric tracked in this domain fell below pre-pandemic levels, reflecting an intensification of conflict and a weakening of multilateral conflict resolution mechanisms.
The Conflict Surge
The number of active conflicts increased in 2024, according to Uppsala Conflict Data Program. Major conflicts include:
- The ongoing Russia-Ukraine war (continuing into its third year)
- Israel-Hamas conflict in Gaza (beginning October 2023)
- Israel-Hezbollah hostilities (escalating in 2024)
- Civil war in Sudan (displacing 11.5 million people)
- Civil war in Myanmar (intensifying since 2021 coup)
- Intensified fighting in eastern Democratic Republic of Congo
Battle-related deaths remained near 2023 levels, with the Russia-Ukraine conflict accounting for over 40% of total fatalities.
The Displacement Crisis
Forcibly displaced people reached a record 123 million globally by the end of 2024, according to UNHCR. This represents an increase from 117 million in 2023 and 108 million in 2022.
The Sudan conflict alone displaced approximately 11.5 million people—the largest single-year displacement since Syria’s civil war peaked in 2013-2015.
Refugee flows strained hosting countries, particularly:
- Turkey (hosting 3.6 million Syrian refugees plus new arrivals)
- Pakistan (hosting Afghan refugees amid economic crisis)
- Uganda (hosting over 1.5 million refugees from multiple neighboring conflicts)
- Poland and other Eastern European nations (supporting Ukrainian refugees)
According to Internal Displacement Monitoring Centre, the costs of supporting displaced populations fall disproportionately on middle-income countries neighboring conflict zones—countries that often lack the resources for adequate support.
Multilateral Mechanisms Under Pressure
The decline in multilateral peace and security cooperation manifested in several metrics:
UN Security Council:
- Resolutions decreased from 50 (2023) to 46 (2024)
- Vetoes by permanent members blocked action on several major conflicts
- The ratio of resolutions to active conflicts declined significantly
- Until November 2025, no new peacekeeping operation had been mandated since 2014
Peacekeeping Operations:
- The ratio of multilateral peacekeeping operations to conflicts fell by approximately 11% year-over-year
- Personnel deployed to multilateral peace operations declined by more than 40% between 2015 and 2024
- Budget constraints disrupted operations, with the approved UN peacekeeping budget falling from $9.7 billion (2014) to $4.7 billion (2025)
Stockholm International Peace Research Institute attributes these declines to:
- Geopolitical tensions among major powers limiting consensus
- Donor fatigue and budget pressures in contributing countries
- Questions about peacekeeping effectiveness in complex civil wars
- Host country sovereignty concerns limiting mandate flexibility
The Cyber and Grey-Zone Threat
Beyond traditional kinetic conflict, 2024 saw intensification of cyberattacks and “grey-zone” activities—actions that fall below the threshold of open warfare but still inflict significant damage.
Verizon’s 2025 Data Breach Investigations Report documents surging cyber incidents across Asia, the Middle East, and Europe. High-profile attacks in 2024-25 included:
- Tata Motors’ Jaguar Land Rover halted production due to cyberattack (September 2025)
- Marks & Spencer faced up to £300 million losses from cyber breach (May 2025)
- Multiple critical infrastructure attacks across Europe
Physical infrastructure also came under attack through grey-zone operations:
- Sabotage of gas pipelines in Europe
- Damage to undersea internet cables in the Red Sea and West Africa (three major multi-cable outages)
- GPS jamming affecting civilian aviation
- Disinformation campaigns targeting elections in multiple democracies
Center for Strategic and International Studies analysis suggests these grey-zone activities are becoming the preferred tool for state and non-state actors seeking to achieve strategic objectives while avoiding direct military confrontation.
The Defense Spending Response
Countries responded to deteriorating security with increased defense budgets:
NATO:
- All 32 member states met the 2% of GDP defense spending target in 2025 (compared to fewer than 20 in 2024)
- The alliance raised its spending target to 5% of GDP for 2035 at The Hague Summit (June 2025)
Asia-Pacific:
- China continued double-digit defense budget increases
- Japan increased defense spending significantly, moving toward the 2% NATO target
- India expanded military modernization programs
- Australia boosted defense spending in response to regional tensions
European Union:
- The European Defence Agency reported increased spending across member states
- New EU defense industrial strategy launched to build autonomous capabilities
According to International Institute for Strategic Studies, global military expenditure reached approximately $2.4 trillion in 2024, representing roughly 2.2% of global GDP—the highest level since the early post-Cold War period.
Regional Peacekeeping Fills the Gap
Despite the decline in UN-led multilateral operations, regional bodies stepped up:
African Union:
- Led security transition in Somalia (ATMIS – African Union Transition Mission in Somalia)
- Deployed forces to eastern Democratic Republic of Congo
- Supported peacekeeping efforts in South Sudan
ECOWAS (Economic Community of West African States):
- Maintained presence in several West African nations
- Coordinated responses to coups and instability in the Sahel
Arab League and GCC (Gulf Cooperation Council):
- Mediation efforts in Yemen
- Coordination on security challenges in the Red Sea corridor
United States Institute of Peace research suggests regional organizations often have advantages in peacekeeping:
- Better understanding of local contexts and dynamics
- Greater perceived legitimacy among parties to conflicts
- Ability to act when great power politics block global action
- More flexible mandates and lighter bureaucracy
However, these operations also face significant challenges, including limited resources, potential conflicts of interest among regional powers, and questions about impartiality.
Emerging Bright Spots in Conflict Resolution
Despite the overall decline, some successful examples of cooperation emerged in 2024-25:
Türkiye’s Mediation:
- The Ankara Declaration (February 2025) led to de-escalation of tensions between Ethiopia and Somalia
- Turkish diplomacy facilitated technical talks and confidence-building measures
Armenia-Azerbaijan Progress:
- The two nations agreed on the text of a peace treaty with EU and US facilitation
- Steps taken to keep third-country forces off borders reduced immediate escalation risks
Israel-Hamas Ceasefire:
- After 15 months of conflict, Qatar and Egypt mediated a ceasefire agreement in January 2025
- While fragile, the agreement created space for humanitarian access and reconstruction discussions
These examples underscore a theme throughout the barometer: while large-scale multilateral frameworks struggle, tailored diplomatic efforts by committed mediators can still yield results.
The Rise of Minilateralism: From Global to Agile
The single most important trend across all five pillars is the shift from universal, rules-based multilateralism toward smaller, flexible, interest-based coalitions.
Defining the New Cooperation Landscape
Multilateralism traditionally involved:
- Near-universal membership (180+ countries)
- Comprehensive frameworks (covering many issues)
- Consensus-based decision-making
- Institutional permanence (UN, WTO, WHO, etc.)
- Rules-based order with dispute resolution mechanisms
Minilateralism (sometimes called “plurilateralism”) instead features:
- Small groups of like-minded countries (3-20 members)
- Focused agendas (addressing specific challenges)
- Streamlined decision-making (easier consensus)
- Purpose-built arrangements (dissolving when objectives met)
- Pragmatic cooperation based on mutual interests
According to Council on Foreign Relations analysis, minilateralism offers several advantages in the current environment:
- Speed: Smaller groups negotiate and implement faster
- Flexibility: Tailored solutions address specific needs without compromising for universal buy-in
- Resilience: Less vulnerable to any single member’s withdrawal or obstruction
- Effectiveness: Clear objectives and accountable membership improve outcomes
- Complementarity: Can coexist with and supplement multilateral frameworks
Examples Across the Five Pillars
Trade and Capital:
- Future of Investment and Trade (FIT) Partnership (14 economies)
- EU-Mercosur trade agreement (after decade of negotiations)
- ASEAN Digital Economy Framework Agreement
- US-Australia-Japan-India Quad economic cooperation
- Bilateral critical minerals partnerships (US-Australia, US-Canada, US-Japan)
Innovation and Technology:
- US-India Initiative on Critical and Emerging Technology
- US-EU Trade and Technology Council
- US-Japan semiconductor research collaboration
- US-UAE advanced technology cooperation framework
- Various AI safety research partnerships
Climate and Natural Capital:
- EU Clean Industrial Deal and regional decarbonization efforts
- LTMS-PIP Southeast Asian power grid integration
- EU-Central Asia Hydrogen Partnership
- Just Energy Transition Partnerships (despite underperformance, represent minilateral model)
Health and Wellness:
- African Medicines Agency regional pharmaceutical cooperation
- OECS insulin procurement collaboration (Caribbean)
- Accra Compact on African health sovereignty
- Various regional vaccine manufacturing partnerships
Peace and Security:
- African Union-led peacekeeping missions
- ECOWAS regional security coordination
- Türkiye-mediated bilateral negotiations (Ethiopia-Somalia, others)
- Quad security dialogue (US-Japan-Australia-India)
The Geopolitical Clustering Dynamic
McKinsey Global Institute research identifies a clear pattern: cooperation increasingly occurs within geopolitical blocs defined by shared values, security concerns, and economic interests.
Three broad clusters are emerging:
Western-Aligned Bloc:
- North America, Europe, developed Asia-Pacific (Japan, South Korea, Australia)
- Characterized by: democratic governance, market economies, security alliances (NATO, bilateral treaties)
- Deepening integration in technology, defense, critical supply chains
China-Aligned Bloc:
- China, Russia, some Central Asian nations, selective African and Latin American partnerships
- Characterized by: state-directed economics,alternative governance models, Belt and Road participation
- Growing integration in infrastructure, commodities, some technologies
Non-Aligned/Swing States:
- India, Brazil, Indonesia, Turkey, Gulf states, much of Africa and Latin America
- Characterized by: strategic autonomy, economic pragmatism, multiple partnerships
- Maintain relationships across blocs, optimize for national interests
Critically, these clusters are not rigid or exclusive. Many countries maintain relationships across boundaries, and cooperation patterns vary by issue area. India, for example, partners with the US on technology and security (Quad) while maintaining trade relationships with Russia and China.
The Dialogue Imperative
For this new cooperation landscape to function effectively, dialogue becomes more—not less—important.
As UN Secretary-General António Guterres emphasized in his September 2025 address to the General Assembly: “Taking steps forward to address global priorities can only happen if parties first talk with one another to find commonality.”
Yet dialogue quality has deteriorated. Too often, international engagements feature:
- Positioning statements rather than genuine exchange
- One-way communication designed to hold ground rather than find common ground
- Performative diplomacy focused on domestic audiences
- Tactical maneuvering instead of problem-solving
Effective dialogue in the minilateral era requires:
- Confidential channels: Away from public pressure and domestic political constraints
- Specific agendas: Focused on concrete problems with potential solutions
- Good-faith participation: Genuine willingness to find mutually beneficial outcomes
- Technical expertise: Subject matter experts alongside diplomats
- Follow-through mechanisms: Implementation plans with clear accountability
Harvard Negotiation Project research emphasizes that successful minilateral cooperation depends on participants separating people from problems, focusing on interests rather than positions, and generating options for mutual gain before deciding on specific approaches.
What the Shifting Cooperation Landscape Means for Global Business
The transformation in global cooperation patterns has profound implications for multinational corporations, investors, and business leaders navigating an increasingly complex environment.
The Corporate Sentiment Split
The Global Cooperation Barometer survey of approximately 800 executives across 81 economies revealed a striking divergence in perceptions:
- 40% reported that growing barriers in trade, talent, and capital flows hampered their ability to do business
- 60% said the effects were neutral or not substantially negative
This split suggests that business impacts depend heavily on:
- Industry: Technology and pharmaceuticals face more restrictions than services
- Geography: Companies operating between aligned partners less affected than those spanning geopolitical divides
- Business model: Digital platforms more adaptable than asset-heavy manufacturers
- Strategic positioning: Proactive adaptation mitigates negative effects
According to Harvard Business Review analysis, companies successfully navigating this environment share several characteristics:
- Geopolitical intelligence capabilities: Dedicated teams tracking regulatory changes, alliance shifts, and emerging restrictions
- Flexible supply chains: Multiple sourcing options and rapid reconfiguration ability
- Regional strategies: Tailored approaches for different geopolitical clusters
- Government relations excellence: Deep understanding of policy priorities and effective engagement
- Scenario planning: Regular war-gaming of geopolitical shocks and strategic responses
The Opportunity in Reconfiguration
While some business leaders focus on cooperation’s decline, others see opportunity in its transformation. McKinsey research identifies several emerging opportunities:
New Trade Corridors:
- Intra-ASEAN trade growing rapidly as regional integration deepens
- Africa-India trade expanding as both seek diversification
- Middle East-Europe connections strengthening (renewable energy, logistics)
- Latin American regional trade agreements creating larger effective markets
Strategic Industry Positioning:
- Semiconductor manufacturing expanding beyond East Asia (US, Europe, India investments)
- EV battery supply chains developing regional hubs (Europe, North America, Southeast Asia)
- Critical minerals processing diversifying away from China dominance
- Pharmaceutical manufacturing regionalizing for supply security
Services and Digital Growth:
- IT services demand surging as businesses digitize and adopt AI
- Professional services expanding as companies navigate complex regulatory environments
- Digital platforms less constrained by physical trade barriers
- Knowledge-intensive services benefiting from continued (if selective) talent mobility
Climate Transition Opportunities:
- $1 trillion+ annual climate finance creating massive market
- Clean technology manufacturing and deployment accelerating globally
- Energy transition requiring infrastructure investment across developing economies
- Carbon markets and climate services expanding
Building a Geopolitical Nerve Center
McKinsey research on geopolitical risk management recommends companies establish a dedicated “geopolitical nerve center”—a cross-functional team responsible for:
Monitoring and Intelligence:
- Track regulatory changes across jurisdictions
- Monitor geopolitical developments affecting operations
- Assess competitor positioning and strategic moves
- Maintain relationships with policy experts and government officials
Scenario Planning and War-Gaming:
- Develop detailed scenarios for potential geopolitical shocks (new sanctions, conflict escalation, alliance shifts)
- War-game company responses with senior leadership quarterly
- Identify trigger points for pre-authorized decisions
- Maintain updated playbooks for rapid response
Strategic Coordination:
- Align business unit strategies with geopolitical realities
- Coordinate government relations across regions
- Manage trade-offs between efficiency and resilience
- Balance short-term costs of adaptation with long-term risk reduction
Capability Building:
- Develop internal expertise on key geographies and issues
- Build relationships with external experts and advisors
- Train leadership on geopolitical risk assessment
- Foster cultural awareness and sensitivity
Companies that invested in these capabilities earlier are now outperforming. According to Boston Consulting Group analysis, firms in the top quartile of geopolitical preparedness showed 3-5 percentage points higher return on invested capital during 2022-24 compared to bottom-quartile peers.
Three Strategies for Navigating the New Cooperation Paradigm
As global cooperation evolves, leaders in both public and private sectors must adapt their approaches. Three strategies emerge from the barometer’s findings:
1. Match Cooperation Format to Specific Issues
Not all challenges require universal, multilateral solutions. Leaders should strategically choose cooperation formats based on:
Issue Characteristics:
- Technical problems with clear solutions: Small expert groups (e.g., technology standards)
- Economic opportunities with aligned incentives: Bilateral or regional trade agreements
- Security challenges with geographic concentration: Regional organizations
- Global challenges requiring universal participation: Reformed multilateral institutions (climate, pandemics)
Partner Alignment:
- High alignment: Deep integration possible (single markets, currency unions, defense alliances)
- Moderate alignment: Issue-specific cooperation (trade agreements, technology partnerships)
- Low alignment: Transactional engagement (commodity trade, specific projects)
Time Sensitivity:
- Immediate crises: Ad hoc coalitions of capable and willing actors
- Medium-term challenges: Purpose-built minilateral partnerships
- Long-term systemic issues: Institutional frameworks with staying power
The key is strategic flexibility—maintaining participation in multiple cooperation formats simultaneously, activating different partnerships for different challenges.
2. Strengthen Resilience Through New Organizational Capabilities
Both governments and businesses must build capabilities to thrive in a more fragmented cooperation landscape:
For Governments:
Intelligence and Foresight:
- Establish forward-looking analytical units tracking cooperation trends
- Maintain comprehensive mapping of existing partnerships and potential new ones
- Develop scenario planning for different cooperation futures
Diplomatic Agility:
- Train diplomats in minilateral negotiation techniques
- Empower smaller negotiating teams with flexible mandates
- Build rapid response capacity for emerging cooperation opportunities
Policy Coordination:
- Break down silos between trade, security, climate, and health policy
- Recognize interconnections across cooperation domains
- Develop whole-of-government strategies for key relationships
For Businesses:
Geopolitical Intelligence:
- Build dedicated teams monitoring regulatory and political developments
- Develop early warning systems for cooperation disruptions
- Maintain networks of advisors across key geographies
Operational Flexibility:
- Design supply chains with multiple sourcing options
- Maintain manufacturing and service delivery capacity in multiple regions
- Develop rapid reconfiguration capabilities
Strategic Relationships:
- Cultivate relationships with policymakers in key markets
- Participate actively in industry associations and multi-stakeholder forums
- Build trust through consistent engagement, not just during crises
According to McKinsey & Company research, companies that systematically built these capabilities showed higher revenue growth (2-4 percentage points annually) and lower volatility (15-25% lower earnings variance) compared to peers during 2020-24.
3. Pursue Public-Private and Private-Private Coalitions
Cooperation need not flow only through governmental channels. Innovative partnership models can accelerate progress:
Public-Private Coalitions:
These partnerships leverage complementary strengths:
- Government: Convening power, regulatory authority, patient capital, long-term perspective
- Business: Technical expertise, operational efficiency, innovation capacity, private capital
Successful examples include:
Minerals Security Partnership:
- Governments and leading mining/manufacturing companies
- Objective: Accelerate critical mineral projects
- Approach: Coordinated investment and market-making
- Result: Pipeline of projects moving toward financial close
Coalition for Epidemic Preparedness Innovations (CEPI):
- Governments, foundations, pharmaceutical companies
- Objective: Accelerate vaccine development for emerging threats
- Approach: Coordinated R&D funding and manufacturing capacity
- Result: Rapid COVID-19 vaccine development and future preparedness
Private-Private Coalitions:
When public policy moves slowly, businesses can self-organize:
The Resilience Consortium (World Economic Forum/McKinsey):
- Brings together businesses’ agility, MDBs’ capital mobilization capacity
- Focus on building resilience in critical supply chains
- Enables rapid coordination without waiting for government action
Industry-Specific Standards Bodies:
- Technology companies collaborating on AI safety standards
- Pharmaceutical companies coordinating on pandemic preparedness
- Logistics companies optimizing supply chain resilience
According to World Economic Forum research, effective public-private partnerships share common characteristics:
- Clear governance: Defined roles, decision-making processes, accountability
- Aligned incentives: Structure ensuring all parties benefit from success
- Measurable objectives: Concrete targets and transparent progress tracking
- Risk sharing: Appropriate distribution of risks and rewards
- Long-term commitment: Patience through inevitable implementation challenges
Looking Ahead: Cooperation’s Future in 2026 and Beyond
As we move deeper into 2026, several trends deserve close attention:
Pressure Points to Watch
US Policy Direction:
- Tariff policies and their implementation affecting global trade flows
- Foreign aid levels impacting health and development cooperation
- Technology export controls shaping innovation ecosystems
- Immigration policies affecting talent mobility
China’s Strategic Choices:
- Economic opening or further self-reliance emphasis
- Technology cooperation with developing economies
- Belt and Road Initiative evolution
- Role in multilateral institutions
European Union Cohesion:
- Internal political dynamics affecting unity
- Defense spending and security cooperation expansion
- Industrial policy and subsidy competition
- Enlargement and neighborhood relations
Emerging Economy Agency:
- India’s positioning between major powers
- Gulf states’ technology and economic partnerships
- African regional integration progress
- Latin American trade and political alignments
Multilateral Institution Reform:
- UN Security Council reform discussions
- WTO dispute resolution restoration
- World Bank/IMF governance changes
- WHO funding and authority
Reasons for Measured Optimism
Despite significant challenges, several factors suggest cooperation’s resilience:
Economic Incentives Remain Strong:
- Global supply chains still deliver efficiency gains
- Cross-border investment creates wealth
- International students and workers enhance innovation
- Trade benefits consumers through lower prices and greater choice
Technology Enables New Forms:
- Digital platforms reduce coordination costs
- Data flows enable distributed collaboration
- Remote communication makes distance less relevant
- AI could enhance translation and cross-cultural understanding
Shared Challenges Demand Collective Action:
- Climate change affects all countries
- Pandemics ignore borders
- Cybersecurity threats require coordination
- Economic instability ripples globally
Pragmatic Leaders Understand Value:
- Surveys show majority recognize cooperation benefits
- Business leaders adapt strategies rather than retreat
- Diplomats seek creative solutions within constraints
- Civil society maintains cross-border networks
The Adaptation Imperative
The central message of the Global Cooperation Barometer 2026 is neither pessimistic nor naively optimistic. Instead, it offers a realistic assessment: cooperation is under pressure but adapting.
The question isn’t whether countries and organizations will cooperate—they will, because they must. The question is whether they’ll adapt quickly and effectively enough to address urgent challenges while managing tensions.
As Børge Brende of the World Economic Forum notes: “Cooperative approaches are vital for advancing corporate, national and global interests. The barometer finds that, in the face of strong headwinds, cooperation is still taking place, albeit in different forms than in the past.”
The path forward requires:
- Dialogue: Open, constructive engagement to identify common interests
- Flexibility: Willingness to try new cooperation formats and partnerships
- Pragmatism: Focus on tangible outcomes rather than ideological purity
- Patience: Recognition that building trust and achieving results takes time
- Innovation: Creative approaches to long-standing challenges
Conclusion: Cooperation Evolving, Not Collapsing
The 2026 Global Cooperation Barometer paints a nuanced picture of international collaboration in an era of geopolitical fragmentation. While traditional multilateral frameworks face unprecedented strain, cooperation persists and evolves through smaller, more flexible coalitions.
Across trade, technology, climate, health, and security—the five pillars of global cooperation—we see common patterns:
- Multilateral mechanisms declining but not disappearing entirely
- Regional and minilateral partnerships filling gaps with agile, interest-based cooperation
- Economic incentives continuing to drive collaboration where mutual benefits are clear
- Outcomes holding steady or improving in some areas, deteriorating in others
- Adaptability emerging as the key to navigating uncertainty
For business leaders, this environment demands new capabilities: geopolitical intelligence, supply chain flexibility, strategic relationship management, and scenario planning. Companies that proactively adapt can find opportunity in reconfiguration rather than merely managing decline.
For government officials and diplomats, success requires matching cooperation formats to specific challenges, building diverse partnership portfolios, and maintaining dialogue even—especially—with those with whom disagreement runs deep.
For all stakeholders, the fundamental truth remains: many of today’s most pressing challenges cannot be solved by any country or organization alone. Climate change, pandemic preparedness, economic prosperity, technological innovation, and peace all require cooperative effort.
The shape of that cooperation may look different from the post-World War II multilateral order. It may be more fragmented, more pragmatic, more selective about participants and more focused on concrete outcomes. But cooperation itself—the human capacity to work together toward shared goals—endures.
As we navigate 2026 and beyond, the barometer’s message is clear: cooperation isn’t dying. It’s evolving. And our collective ability to adapt will determine whether that evolution leads to a more resilient, prosperous, and peaceful world—or to continued fragmentation and missed opportunities.
The choice isn’t between cooperation and isolation. It’s between rigid adherence to fading frameworks and creative adaptation to new realities. The data suggests pragmatic optimism: cooperation is down but not out, strained but not shattered, adapting even as it’s tested.
In this era of transformation, the question each leader must answer is not “should we cooperate?” but “how shall we cooperate most effectively?” The Global Cooperation Barometer 2026 provides essential data for answering that question wisely.
Methodology Note: This article draws primarily from the World Economic Forum’s Global Cooperation Barometer 2026 Third Edition, produced in partnership with McKinsey & Company. All statistics are sourced from the report’s 41 tracked metrics unless otherwise noted. Additional reporting includes interviews with policy experts, analysis of supplementary data sources, and review of academic literature on international cooperation.
Discover more from The Economy
Subscribe to get the latest posts sent to your email.


Analysis
Cash is King: How Asian Airlines’ Liquidity Hoarding During the 2026 Oil Shock Will Make Them Stronger | Aviation Analysis

The Fuel Shock That Rewrites the Rules
There is a particular kind of clarity that arrives only in a genuine crisis. Not the manufactured urgency of quarterly earnings calls, not the performative alarm of airline investor days — but the cold, existential arithmetic of an industry staring at a cost structure that has been torn apart in a matter of weeks.
Jet fuel, the single most volatile line item on any airline’s balance sheet, has more than doubled in the month since the U.S.-Israeli war on Iran began, surpassing $195 a barrel as a global average. Foreign Policy For context: the refining spread alone — the premium of processed jet fuel over crude — surged to as high as $144 per barrel before easing to around $65, still far above anything considered normal. Modern Diplomacy Benchmark Brent crude has settled between $100 and $115. But that, as Foreign Policy noted this week, is not the number that matters. What matters is what actually goes into the wing tanks.
The closure of the Strait of Hormuz by Iran has effectively severed nearly 21% of global jet fuel supply Travel And Tour World — a chokepoint through which a significant share of Middle Eastern refined product passes on its way to Asia’s thirsty aviation hubs. The ripple effects have been immediate: Jet A-1 prices have surged from around $80 per barrel to approximately $220 per barrel Nation Thailand, compressing airline margins to the point where, for carriers flying on pre-crisis booking revenues, every departure is potentially loss-making.
And yet, if you look carefully beneath the screaming headlines, something strategically interesting is happening among Asia’s major carriers. A quiet, disciplined, and — dare I say it — admirable act of financial self-preservation is underway. Call it what it is: a masterclass in crisis liquidity management.
How the 2026 Shock Compares to the 1973 and 1980s Crises
The historical echoes are not merely rhetorical. Chai Eamsiri, the President and CEO of Thai Airways International — a man who has navigated nearly four decades of aviation cycles — did not mince words when assessing what his industry is now facing. “This is the worst one,” he told journalists. “This time is about the infrastructure that was destroyed. It will take some time to call back all the supply, the facilities, the refinery, the infrastructure.” Free Malaysia Today
He is right to reach for historical superlatives, and the comparison demands unpacking.
The 1973 OPEC embargo and the 1979–1980 second oil shock were demand-destruction events rooted in cartel politics. Airlines of that era operated with none of today’s financial sophistication — no fuel hedging programs, no dynamic pricing algorithms, no diversified revenue streams from cargo or ancillaries. Pan American World Airways, Braniff International, and Laker Airways entered those shocks with high debt, aging fleets, and zero liquidity buffers. The results were catastrophic: Braniff filed for bankruptcy in 1982; Laker collapsed the same year; Pan Am began its long death spiral.
The 2026 shock differs structurally. Most airline hedging programs are tied to crude oil benchmarks, not to the refined jet fuel that actually goes into aircraft — a critical structural weakness exposed by this crisis. Modern Diplomacy When refining margins spike as they have now, even well-hedged carriers face significant exposure. But the key difference between 2026 and 1980 is this: today’s Asian flag carriers have cash. Meaningful, fortress-grade cash — built up deliberately through post-COVID restructuring, equity raises, and restrained capital allocation. And they know exactly how to use it.
The Liquidity Fortress: Carrier-by-Carrier Case Studies
Thai Airways: The THB 120 Billion Shield
Thai Airways International has moved into cash-saving mode, with CEO Chai Eamsiri confirming the airline has begun delaying non-essential investment plans and tightening spending to preserve as much as possible of its existing THB 120 billion (approximately $3.3 billion) cash position. Nation Thailand
The discipline is surgical rather than panicked. Consider what Thai Airways is not cutting: its fleet expansion from 80 to 102 aircraft by year-end 2026, new routes including Bangkok–Amsterdam (a comeback after 28 years) and Bangkok–Auckland, and the THB 10 billion MRO centre at U-Tapao Airport — all remain on schedule. KAOHOON INTERNATIONAL What is being deferred is the discretionary: onboard equipment upgrades, non-critical vendor contracts, premature hedging at punishing spot prices. Thai Airways has already locked in approximately 50% of its fuel requirements through June 2026 but has opted not to hedge further, judging the volatility too high to add new positions at current elevated prices. KAOHOON INTERNATIONAL
This is not a sign of weakness. It is a sign of a CFO who understands that locking in $195/barrel fuel in a crisis environment is a trap, not a solution.
Singapore Airlines and Scoot: Hedging Sophistication Meets Commercial Discipline
Singapore Airlines is regarded as operating one of the more robust fuel hedging programmes in the Asia-Pacific region, providing meaningful protection against the refined jet fuel price surge. TTG Asia Scoot, its low-cost subsidiary, has deployed what its Vice President for Pricing described as a combination of fuel hedging, selective fare increases, and commercial capacity discipline Nation Thailand — a three-pronged response that reflects the parent group’s institutional risk management culture.
Critically, Singapore’s government delayed a sustainable aviation fuel levy that airlines were scheduled to start paying in May 2026, citing the surge in fuel costs from the Iran war — with the charge now deferred to October 1, 2026. Bloomberg This is sovereign-level recognition that preserving airline liquidity during the shock window is a national economic priority, not merely a commercial accommodation.
Cathay Pacific: Surcharges as a Cash Generation Engine
Cathay Pacific doubled its fuel surcharges on all tickets from March 18, 2026, with the airline stating that jet fuel has approximately doubled since the start of the Middle East crisis. LoyaltyLobby The surcharge mechanism is, in effect, a real-time cash flow transfer from demand-inelastic travellers to the carrier’s operating account — elegant, legally defensible, and brutally effective. By April 1, Cathay had raised fuel surcharges a further 34% Gulf News, a move that signals confidence in its ability to pass costs through without material load factor destruction.
AirAsia X: Managed Contraction, Not Collapse
AirAsia X has raised fares by up to 40% and imposed a 20% fuel surcharge, while cutting approximately 10% of flights — targeting non-profitable exploratory routes rather than core network services. Malay Mail Group CEO Bo Lingam has been explicit: the carrier is “optimising its fleet without resorting to staff reductions.” AirAsia X carries no fuel hedges, leaving it fully exposed to spot market prices The Edge Malaysia — a vulnerability, certainly, but one being managed through aggressive yield management rather than capacity capitulation.
The Great Hedging Divide: Asia Versus the West
Here is where the conventional narrative gets genuinely interesting. Much commentary has focused on European carriers’ superior hedging positions as evidence of Western operational sophistication. European airlines have on average hedged around 80% of their 2026 fuel requirements, with Ryanair holding the strongest position at 84% of the current quarter locked in at $77 per barrel. AeroTime
But here is the structural irony that almost every competitor publication has missed: those hedges are front-loaded and thinning. Coverage thins as the year progresses AeroTime, meaning European carriers’ apparent advantage evaporates precisely as the shock, if prolonged, bites deepest — in Q3 and Q4 2026. Lufthansa, hedged at 82% for the current quarter and 77% for the rest of 2026, has halted all new fuel hedging activities AeroTime, a tacit admission that the forward market has become too expensive and too uncertain to navigate confidently.
Meanwhile, the structural weakness that hedge programs tied to crude oil benchmarks expose means that in extreme market conditions, even well-hedged airlines remain vulnerable Modern Diplomacy to the refining spread explosion — which is precisely what has occurred. The jet fuel hedging market is thin, expensive, and insufficient for absorbing a shock of this magnitude.
The Asian carriers who are building cash buffers, cutting capacity precisely where unit economics break, and deferring discretionary capex — rather than betting on futures markets — may emerge from this crisis with balance sheets that are, paradoxically, stronger than peers who spent aggressively on hedging infrastructure.
The Macro Ripple: Asian Tourism and the Regional Economic Calculus
The aviation liquidity crisis is not occurring in a vacuum. It is unfolding against a regional tourism backdrop that was, until February 2026, one of the most compelling growth stories in global travel economics.
Thailand’s 2026 tourism season began with strong momentum, with early-year arrivals topping 7 million visitors in the first months — before geopolitical tension slowed weekly growth. Chiang Rai Times The medium-term danger is not the short-haul regional market, which tends to be resilient to fuel shocks given shorter flight times and lower absolute fuel burn per seat. It is the long-haul leisure segment — Europe to Bangkok, Australia to Bali, the transatlantic Asian diaspora flows — where reduced flight frequency and higher fares could put significant pressure on hundreds of thousands of visitor arrivals, with revenue losses estimated in the tens of billions of baht Chiang Rai Times if the crisis persists past Q2.
The carriers that preserve cash through this window are not merely surviving for their own sakes. They are the arterial infrastructure of tourism-dependent economies across Southeast Asia, South Asia, and Northeast Asia. An airline that runs out of liquidity does not merely disappear from a stock exchange — it removes a country from the global route map. The geopolitical stakes of airline liquidity management are, in this sense, considerably higher than most financial commentary acknowledges.
Five Strategic Moves That Define the 2026 Winners
The data across this crisis reveals a clear behavioral taxonomy that will separate aviation’s resilient performers from its casualties. The carriers executing all five of the following actions are, in my assessment, the ones to watch for the 2027 recovery:
1. Fortress Cash, Not Fire Sales: Preserving liquidity buffers in excess of six months of operating costs rather than deploying cash into opportunistic asset acquisitions. Thai Airways’ THB 120 billion reserve is the archetype.
2. Selective Capex Preservation: Distinguishing between strategic investments (fleet renewal, MRO infrastructure, digital systems) and discretionary spending. The carriers cutting AI investment and technology programs will pay a competitive price in 2027–28.
3. Revenue Yield Over Capacity Vanity: Accepting lower seat counts at higher yields rather than defending market share with cheap, loss-generating inventory. AirAsia X’s fare hikes of up to 40% — paired with a 10% capacity cut — reflects this discipline.
4. Hedging Agnosticism at the Peak: Refusing to layer new hedge positions at $195/barrel spot prices. As Thai Airways CFO reasoning shows, hedging during a crisis peak locks in losses rather than protecting against them.
5. Government Partnership Activation: Working with civil aviation authorities on fuel surcharge frameworks and levy deferrals — as Singapore’s CAAS demonstrated — to distribute the cost shock across the value chain rather than absorbing it entirely on the airline’s income statement.
What This Means for the 2027 Recovery
Let me be direct: the 2026 oil shock will end. Every previous shock in aviation history — 1973, 1979, 1990, 2008 — resolved, eventually, through some combination of supply restoration, demand destruction, political settlement, or technological substitution. CEO Chai Eamsiri himself noted that U.S. midterm elections in November 2026 create a political incentive structure that could influence conflict resolution timelines. Nation Thailand
CLSA’s analysis forecasts Singapore Airlines’ FY27 core net profit declining 30% year-on-year due to the jet fuel surge, but projects FY28 profits unchanged on the assumption of oil price normalization and gradual fare adjustments — with dividend yield expected to recover to 4.8% in FY28. Minichart
The carriers that will capture disproportionate market share in that normalization window are precisely those that did not panic-sell routes, did not dilute equity at distressed prices, did not gut their technology and workforce infrastructure in a short-sighted cost-cutting frenzy. The Asian airlines building liquidity fortresses today are positioning themselves to be the aggressive fleet-deployers and route-expanders of 2027 — when fuel prices ease, pent-up demand unleashes, and weakened competitors have neither the aircraft nor the operational capacity to respond.
This is the contrarian insight that most aviation commentary — fixated on the immediate pain — is missing entirely. The 1980s crisis eliminated Pan Am, Braniff, and Laker. But it also created the conditions under which a disciplined Singapore Airlines, flush with government-backed capital and operational conservatism, spent the subsequent decade cementing itself as the world’s most admired full-service carrier. History, as ever, rewards the patient.
The Verdict: Discipline as Competitive Moat
The IATA forecast of $41 billion industry profit for 2026, made at the end of 2025, now seems unattainable. The Conversation That is certain. What is less certain — and far more interesting — is which carriers emerge from this shock with durable competitive advantages rather than merely surviving it.
My assessment: Singapore Airlines and Thai Airways, both of which entered 2026 with restructured balance sheets, cash reserves, and clear strategic frameworks for navigating fuel volatility, are the strongest positioned for 2027 recovery. Cathay Pacific’s aggressive surcharge strategy preserves revenue integrity without destroying demand. AirAsia X’s managed contraction — painful but rational — keeps the network intact for the eventual bounce.
The carriers I worry about most are those without hedges, without cash buffers, and without the cost-discipline culture that turns a crisis into a competitive sorting mechanism. The airlines most likely to fail are those with weak balance sheets, low operational efficiency, no state backing, and little or no fuel hedging, leaving them fully exposed to sharp cost rises. The Conversation
Cash, as every Asian airline CFO is now demonstrating with unusual clarity, is not merely a financial metric. It is a strategic weapon. And in the worst oil shock since the 1980s, the carriers who hoarded it most ruthlessly will be the ones defining Asian aviation’s next decade.
The headlines say crisis. The balance sheets say opportunity.
Inline Citations and Sources
- Foreign Policy — “Jet Fuel Prices Spell Bad News for Iran War Energy Crisis”
- The Nation Thailand — “Thai Airways board to weigh crisis measures as oil surge hits costs”
- The Nation Thailand — “THAI enters cash-saving mode as fuel costs soar”
- Bloomberg — “Singapore Delays Flight Tax as Oil Crisis Lifts Jet Prices”
- Aerotime Hub — “Airline fuel hedging: who is protected in Iran’s fuel crisis”
- The Conversation — “Airlines are facing yet more turbulence — expert assesses what they need to get through it”
- The Edge Malaysia — “High jet fuel costs threaten airline recovery”
- Malay Mail — “AirAsia X raises fares by up to 40pc, cuts some flights”
- Minichart — “Singapore Airlines Earnings Outlook 2026–2027: Impact of Iran War”
- TTG Asia — “Asian carriers cancel flights, implement surcharges as fuel crisis intensifies”
Discover more from The Economy
Subscribe to get the latest posts sent to your email.
Analysis
When Rivals Share a Rocket: The China-Europe SMILE Mission and the Fragile Promise of Space Science Diplomacy
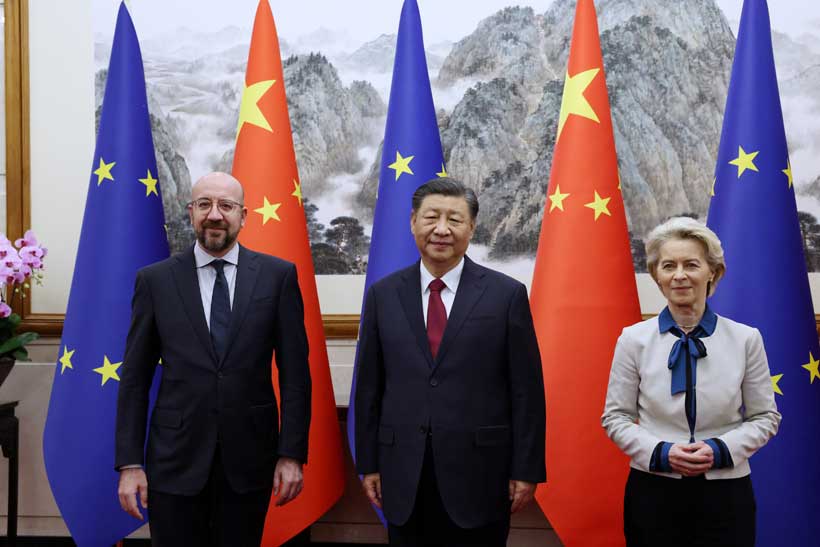
On April 9, a European rocket will lift a Chinese-European spacecraft into orbit from the jungle coast of French Guiana. In a world tearing itself apart over chips, trade routes, and strategic chokepoints, this is not nothing.
The Countdown the World Isn’t Watching — But Should Be
At 08:29 CEST on April 9, 2026, an Avio-built Vega-C rocket — designated mission VV29, the first Vega-C flight operated by Avio Avio — will ignite its first-stage engines at Europe’s Spaceport in Kourou, French Guiana. Riding atop it will be SMILE: the Solar wind Magnetosphere Ionosphere Link Explorer, a 2,250-kilogram spacecraft nearly a decade in the making. The mission is a joint undertaking between the European Space Agency (ESA) and the Chinese Academy of Sciences (CAS) — and it is, by any reasonable measure, the most symbolically weighted space launch of 2026.
Not because of its destination. Not because of the science alone, though the science is genuinely groundbreaking. But because of what it represents at this particular moment in history: two of the world’s major technology powers, locked in an increasingly fraught geopolitical relationship, sharing data, sharing hardware, and sharing a launchpad.
SMILE is China’s first mission-level, fully comprehensive in-depth cooperation space science exploration mission with ESA GitHub — a statement that, when you sit with it, reveals how exceptional this collaboration actually is. After years of US-led pressure to isolate Chinese space activities, after the Wolf Amendment that has effectively banned NASA from bilateral cooperation with China since 2011, after wave after wave of technology export restrictions, here is a European rocket carrying instruments built simultaneously in Leicester and Beijing, tested jointly in the Netherlands, fuelled in Kourou, and aimed at a shared scientific horizon.
This is worth examining closely — not with naïve optimism, but with clear eyes.
What SMILE Actually Does, and Why It Matters
Before the geopolitics, the science — because the science is the point, and it deserves more serious attention than it typically receives in the English-language press.
Earth is constantly bombarded by gentle streams — and occasionally stormy bursts — of charged particles from the Sun. Luckily, a massive magnetic shield called the magnetosphere stops most of these particles from reaching us. If it weren’t for the magnetosphere, life could not survive on planet Earth. ESA
SMILE’s purpose is to give humanity its first comprehensive, simultaneous, global view of how that shield actually works — how it bends, buckles, and recovers under the assault of solar wind and coronal mass ejections (CMEs). Although several spacecraft have observed the effects of the solar wind and coronal mass ejections on Earth’s magnetic shield, they have mostly done so piecemeal ESA, through point measurements that are a bit like trying to understand a hurricane by sticking your hand out a single window.
SMILE changes that. The mission is a novel self-standing effort to observe the coupling of the solar wind and Earth’s magnetosphere via X-ray imaging of the solar wind-magnetosphere interaction zones, UV imaging of global auroral distributions, and simultaneous in-situ solar wind, magnetosheath plasma and magnetic field measurements. SPIE Digital Library
The four instruments it carries — the Soft X-ray Imager (SXI) built at the University of Leicester, a UV Aurora Imager, a Light Ion Analyser, and a Magnetometer — will work in concert from a highly inclined, highly elliptical orbit, with an apogee of 121,000 km and a perigee of 5,000 km. Avio From that sweeping vantage, SMILE will watch in real time as solar storms slam into Earth’s magnetic bubble, deform its boundaries, and trigger the geomagnetic disturbances we call space weather.
The Economic Stakes of Space Weather
Here is where the science becomes urgently, uncomfortably practical.
A severe geomagnetic storm — the kind triggered by a powerful CME — can induce electrical currents in long-distance transmission lines powerful enough to melt transformer cores. It can cripple GPS satellites, knock out shortwave radio communications, accelerate the degradation of satellite hardware, and expose astronauts to dangerous radiation doses. The Carrington Event of 1859 — the largest geomagnetic storm in recorded history — set telegraph offices on fire and produced auroras visible from the Caribbean.
Were a Carrington-scale event to strike the modern infrastructure-dependent world, the consequences would be catastrophic. Lloyd’s of London has estimated that a severe geomagnetic storm striking North America could leave between 20 and 40 million people without power for periods ranging from weeks to years, at a cost that would run into the trillions. The May 2024 geomagnetic storm — the most powerful in two decades — disrupted GPS signals and degraded satellite operations across the globe, offering a modest preview of what a truly extreme event might look like.
Better forecasting requires better physics. And better physics requires exactly what SMILE is designed to provide: a complete, global picture of how the magnetosphere actually responds to solar assault. By improving our understanding of the solar wind, solar storms and space weather, SMILE will fill a stark gap in our understanding of the Solar System and help keep our technology and astronauts safe in the future. ESA
A Mission Born in a Different World
The story of how SMILE came to be is, in itself, a small geopolitical parable.
The SMILE project was selected in 2015 out of 13 other proposals, and became the first deep mission-level cooperation between the European Space Agency and China. Orbital Today It was conceived when relations between China and the West, while not without tension, still operated under a broadly cooperative logic — when the prevailing assumption in Brussels and Beijing alike was that economic interdependence would gradually soften political friction and that scientific collaboration was a relatively safe space for engagement.
The Principal Investigators were Graziella Branduardi-Raymont from Mullard Space Science Laboratory, University College London, and Chi Wang from the State Key Laboratory of Space Weather at NSSC, CAS. ESA
What strikes me most about this pairing is its elegance and its tragedy. Professor Branduardi-Raymont — who, it should be noted, passed away in November 2023 after a lifetime of X-ray astronomy — had spent decades frustrated that no existing observatory could directly image X-ray emission from Earth’s magnetosphere. Her perseverance eventually produced this mission. She did not live to see its launch. But her instrument, built at the University of Leicester and calibrated with painstaking care across multiple European institutions, will fly on April 9 in the spacecraft she helped conceive. There is something moving in that continuity.
Professor Chi Wang, her Chinese counterpart, continued the work — a collaboration that survived COVID-era isolation, supply chain disruptions, and the gathering chill of US-China technology competition.
The SMILE mission entered full launch implementation phase after passing the joint China-Europe factory acceptance review on October 28, 2025. At the end of November 2025, the propellant required for the satellite departed from Shanghai, arriving at Kourou port in early February 2026. CGTN
On February 11, 2026, the flight model and ground support equipment departed from ESTEC in the Netherlands, sailing across the Atlantic from Amsterdam port aboard the cargo vessel Colibri, arriving at Kourou port on February 26, 2026, and being successfully transferred to the launch site. CGTN
That detail — a cargo ship named Colibri, sailing from Amsterdam to French Guiana carrying a satellite built in two countries on opposite ends of the Eurasian continent — is, to me, the most vivid emblem of what scientific cooperation can accomplish when given enough time, enough stubbornness, and enough shared wonder.
Europe’s Delicate Balancing Act
The launch of SMILE does not occur in a geopolitical vacuum. It occurs at a moment when Europe’s relationship with both China and the United States has become extraordinarily complex.
Washington has grown increasingly vocal about the risks of European technological cooperation with Beijing. The US-China Economic and Security Review Commission has flagged joint space missions as a potential vector for technology transfer. The US Space Force has publicly warned allies about sharing sensitive sensor data with Chinese partners. And while SMILE is a pure science mission — studying solar-terrestrial physics, not military reconnaissance — the distinction between civilian and dual-use space technology is one that Washington now views with considerable scepticism.
ESA, for its part, has walked this line with notable care. ESA Director General Josef Aschbacher confirmed SMILE’s launch timeline in January 2025, framing the mission squarely within the agency’s Cosmic Vision scientific programme — an agenda governed by scientific merit, not geopolitical alignment. “Building on the 24-year legacy of our Cluster mission,” said ESA Director of Science Prof. Carole Mundell, “SMILE is the next big step in revealing how our planet’s magnetic shield protects us from the solar wind.” ESA
That framing matters. ESA is positioning SMILE not as a concession to Beijing, but as the natural scientific successor to decades of European magnetospheric research — a mission that happens to have a Chinese partner because the Chinese partner brought the best science proposal to the table in 2015.
Strategic Autonomy in Orbit
Europe’s Strategic Autonomy agenda — the drive to reduce dependency on both American and Chinese platforms — finds an interesting expression in SMILE. The mission uses a European launcher (Vega-C), European testing facilities (ESTEC in the Netherlands), and a European payload module built by Airbus in Spain. China contributes three scientific instruments and the spacecraft platform and operations. The division of labour is not equal, but it is genuine.
This is different from the model China has pursued in, say, its International Lunar Research Station programme — a Beijing-led effort to build a Moon base with selective partner participation on China’s terms. SMILE was born from a joint call for proposals, adjudicated by both ESA and CAS, on scientific merit alone. The symmetry of its origins is a meaningful safeguard.
What the mission also illustrates, however, is the limits of that safeguard. Despite ongoing delays of the launch and geopolitical tensions between Europe and China, this mission marks an important collaboration between the two parties. Orbital Today Delays stretched from an original 2021 target across five years. COVID disrupted joint testing. Geopolitics hovered over every logistics decision. That the satellite is sitting on a Vega-C in Kourou today is a testament to institutional resilience on both sides — and a reminder of how fragile such resilience can be when the political weather changes.
What Comes Next: Blueprint or One-Off?
The successful implementation of the SMILE mission will set a benchmark for China-EU space science cooperation and lay the technological foundation for deeper future collaboration. GitHub
That Chinese Academy of Sciences statement is aspirational in tone. Whether it reflects reality will depend on choices that neither ESA nor CAS alone can make.
The scientific case for continued China-Europe cooperation in space is actually strong. China has developed formidable capabilities in solar and heliospheric science, planetary exploration, and space weather monitoring. ESA brings world-class instrumentation, launcher independence, and an institutional culture of multinational collaboration forged across 22 member states. Together, they have demonstrated — through SMILE — that the logistics of joint mission development are solvable, even across supply chain disruptions and a pandemic.
The geopolitical case is harder. As US pressure on European technology transfer policies intensifies, as China’s own space ambitions grow more assertive, and as the Artemis Accords effectively create a US-aligned coalition in cislunar space, Europe faces a binary pressure: join Washington’s bloc or preserve its own lane.
SMILE suggests a third option — cautious, science-first, mission-specific cooperation, carefully ring-fenced from military and surveillance applications, conducted through multilateral institutions with independent governance. It is not a grand geopolitical declaration. It is a pragmatic transaction between research agencies who share a genuine scientific puzzle.
That may, in the end, be its most important lesson. The most durable forms of international cooperation are rarely born from summit communiqués or diplomatic ambition. They are built from specific problems, shared curiosity, and the grinding, unglamorous work of building something together over a decade. SMILE’s cargo ship sailed from Amsterdam. Its fuel was loaded in Shanghai. Its instruments were calibrated in Leicester. Its launcher was assembled in Colleferro.
On the morning of April 9, all of that will rise together over the Atlantic, riding a column of fire into a highly elliptical orbit 121,000 kilometres above the Earth, where it will spend three years watching our planet’s invisible magnetic shield absorb the fury of the Sun.
Whatever one thinks of the geopolitics, that image is worth holding onto.
The View From the Launchpad
In a world increasingly defined by decoupling — technological, financial, diplomatic — SMILE is a small, luminous exception. It will not resolve the fundamental tensions between Beijing and Brussels. It will not answer the question of whether Europe can maintain scientific ties with China while deepening security cooperation with Washington. It will not make the next CME less dangerous or the next trade war less likely.
But it will, if all goes to plan, give us something genuinely new: a complete, real-time picture of how Earth’s magnetic shield breathes, bends, and holds against the solar wind. And it will have done so because two sets of scientists — from Milan and Beijing, from Leicester and Shanghai — decided that the problem was important enough to work on together, regardless of the weather in Washington.
What strikes me most, in the end, is not the geopolitics. It is the image of Professor Branduardi-Raymont at Mullard Space Science Laboratory, frustrated for years that no observatory could image X-ray emission from the magnetosphere, proposing mission concepts until one finally stuck. The Colibri will not carry her name. But the instrument riding inside the fairing of that Vega-C, the lobster-eye X-ray telescope that will for the first time map the shape of Earth’s magnetic boundary, is her life’s work.
The rocket lifts off at 08:29 CEST. The world should be watching.
Discover more from The Economy
Subscribe to get the latest posts sent to your email.
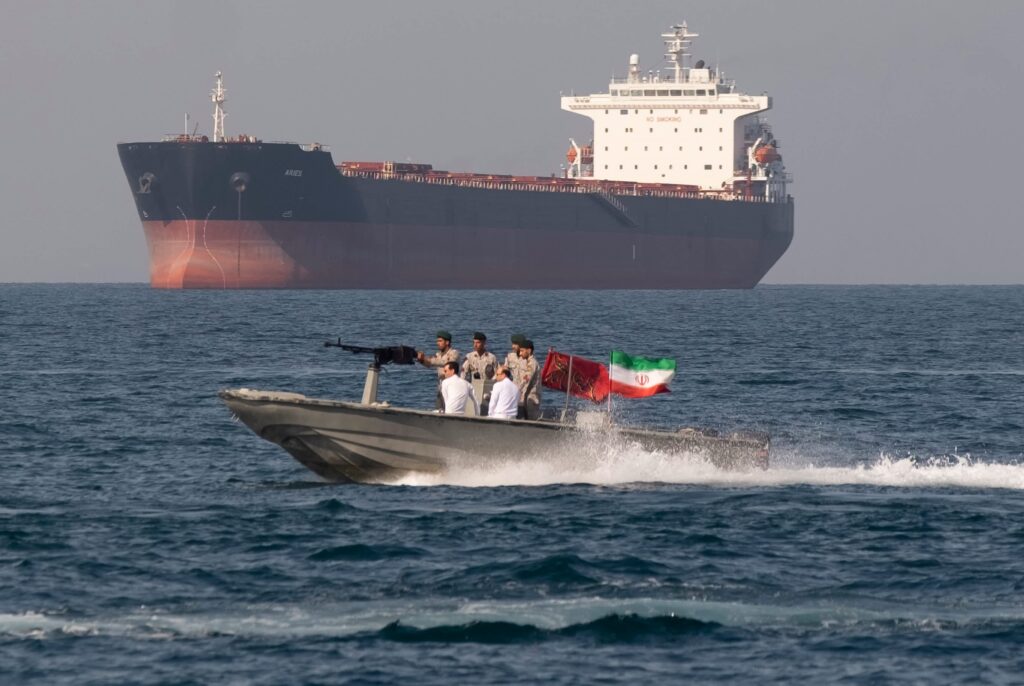
There is a strip of seawater — twenty-one miles wide at its narrowest, wedged between the Iranian coastline and the Omani shore — that has long been described by energy analysts as the single most consequential geographic feature in the global economy. For decades, that description felt like an abstraction. A risk. A theoretical vulnerability that strategists pencilled into worst-case scenarios and then quietly filed away.
The events of late February 2026 have made that abstraction brutally, expensively concrete.
On 28 February, the United States and Israel initiated coordinated airstrikes on Iran under Operation Epic Fury, targeting military facilities, nuclear sites, and leadership. Within hours, at least three oil tankers had been struck near the strait, shipping companies began suspending transits, and oil prices were moving with a velocity not seen in modern market history. Brent crude crossed $100 per barrel on 8 March — for the first time in four years — before surging to a peak of $126 per barrel. Wikipedia
The Strait of Hormuz crisis of 2026 has since been characterized by the head of the International Energy Agency, Fatih Birol, as “the largest supply disruption in the history of the global oil market.” World Economic Forum That is not hyperbole. That is the understated language of a man watching the architecture of global energy security collapse in real time.
This essay is not another news dispatch. It is an argument — an urgent, evidence-based argument — that the Hormuz crisis has exposed structural failures so profound, and dependencies so reckless, that incremental policy responses are no longer sufficient. The world needs radical rethinking. And it needed it twenty years ago.
The Anatomy of a Chokepoint: Why Hormuz Was Always the Most Dangerous Fault Line
The Strait of Hormuz is the world’s pre-eminent energy chokepoint not because of its width but because of its irreplaceability. Its two unidirectional sea lanes facilitate the transit of around 20 million barrels of oil per day, representing roughly 20% of global seaborne oil trade, primarily from producers like Saudi Arabia, the United Arab Emirates, Iraq, and Qatar. Wikipedia
But the implications of Strait of Hormuz closure on the world energy economy extend far beyond crude oil — and this is precisely what the shallow reporting of prior crises failed to capture. While focus rightly falls on the 11 million barrels of oil and 140 billion cubic metres of gas in daily global circulation, the impact extends far beyond energy. World Economic Forum The strait is simultaneously an artery for liquefied natural gas, fertilizers, aluminium, methanol, sulfur, helium, and petrochemical feedstocks — a supply chain polymath that quietly underpins everything from the plastic packaging on your groceries to the nitrogen fertilizer that grew the corn in your food.
The U.S. Energy Information Administration has long designated Hormuz as a “world oil transit chokepoint,” noting in successive annual reports that no viable substitute exists at comparable volume. The EIA’s warnings were consistent, authoritative, and largely ignored by policymakers who preferred optimism to contingency planning.
The Strait’s geopolitical risks are equally structural. It is, uniquely among major chokepoints, bordered on one side by a state — Iran — with both the capability and the demonstrated willingness to weaponize the waterway in pursuit of strategic objectives. The Strait of Suez has Egypt. The Strait of Malacca has Malaysia and Indonesia. Hormuz has Iran. That asymmetry has always made it the most dangerous fault line in global energy logistics.
February–April 2026: How the Crisis Unfolded
The immediate trigger was Operation Epic Fury, but the conditions for catastrophe had been accumulating for years. Tensions between Iran, the United States, and Israel had escalated in the lead-up to 2026, stemming from failed nuclear negotiations in Geneva and a prior 12-day air conflict in 2025. Wikipedia In the weeks before the strikes, war-risk ship insurance premiums for the strait increased from 0.125% to between 0.2% and 0.4% of the ship insurance value per transit — for very large oil tankers, an increase of a quarter of a million dollars per crossing. Wikipedia
What followed February 28 was a cascade of compounding failures that no strategic reserve or pipeline bypass could adequately address.
The warnings and subsequent attacks on vessels caused tanker traffic to drop first by approximately 70%, with over 150 ships anchoring outside the strait. Traffic subsequently dropped to near zero. Wikipedia Major container shipping companies — Maersk, Hapag-Lloyd, and CMA CGM — suspended operations, rerouting vessels around Africa’s southern tip. CNBC War-risk insurers followed, cancelling protection and indemnity insurance for Gulf transits from 5 March. Carra Globe The result, as commodity intelligence firm Kpler diagnosed with clinical precision, was a de facto closure for most of the global shipping community — insurance withdrawal doing the work that a physical blockade had not. Kpler
Vessel tracking data indicate that 16 million barrels per day of crude oil and oil products have stopped flowing through the Strait — a staggering decline of 80 percent compared to the 2025 average, with only 10 vessel crossings recorded over a four-day period, against a typical daily average of 70 to 80. Gulf International Forum
On 27 March, the IRGC formally declared the strait closed to vessels bound to or from the ports of the United States, Israel, and their allies. By early April, Brent crude had climbed to $127.61 per barrel — nearly double the $71.32 price recorded the day before Operation Epic Fury. USNI News
The Economic and Geopolitical Implications: A Multi-Layered Shock
Hormuz Blockade Impact on Oil Prices and the Spectre of Stagflation
The oil price shock alone would constitute a significant macroeconomic event. But the Federal Reserve Bank of Dallas has modelled the full GDP consequences with sobering precision. A complete cessation of oil exports from the Gulf amounts to removing close to 20 percent of global oil supplies from the market. The Dallas Fed model implies this raises the average WTI price to $98 per barrel and lowers global real GDP growth by an annualized 2.9 percentage points in Q2 2026. Dallas Fed If the disruption extends to three quarters, oil prices could reach $132 per barrel and global real GDP growth could fall 1.3 percentage points for the year. Dallas Fed
The even grimmer scenario circulating among Wall Street analysts cited by Bloomberg is $200 per barrel — a number that, if realized, would constitute not merely a recession trigger but a structural shattering of the post-pandemic global recovery.
European gas markets have been hit through a separate but reinforcing channel: historically low gas storage levels — estimated at just 30% capacity following a harsh 2025–2026 winter — meant that QatarEnergy’s force majeure declaration sent Dutch TTF gas benchmarks nearly doubling to over €60/MWh by mid-March. Wikipedia The echoes of 2022, when Russia’s invasion of Ukraine upended European energy, were unmistakable and humiliating: the continent had, once again, failed to structurally wean itself from a single fragile supply corridor.
Hormuz Blockade Impact on Asian Oil Imports: The Existential Exposure
If Europe’s predicament is severe, Asia’s is existential. The Strait of Hormuz as a chokepoint creates geopolitical risks that are disproportionately concentrated in the Asia-Pacific region — and the 2026 crisis has exposed that vulnerability with a candour that decades of diplomatic optimism obscured.
In 2024, 84% of the crude oil and condensate and 83% of the LNG that moved through the Strait went to Asian markets, with China, India, Japan, and South Korea accounting for a combined 69% of all Hormuz crude flows. Seatrade Maritime
The individual country exposure is jaw-dropping. Japan relies on the strait for close to three-quarters of its oil imports; South Korea sources roughly 60% of its crude via the same route; almost half of India’s crude oil imports and about 60% of its natural gas supplies move through Hormuz. Seatrade Maritime Around 84% of the crude oil and 83% of the LNG passing through the Strait went to Asia in 2024. Wikipedia
For the LNG market — where there are genuinely no alternative routes for stranded Gulf production — the situation is even more extreme. Unlike oil, there are no alternative routes to get the gas to market and very few strategic stockpiles to cushion the shortfall. Bloomberg LNG spot prices in Asia increased by over 140% as QatarEnergy declared force majeure on its contracts and shut down gas liquefaction at Ras Laffan, with analysts warning that restarting would take weeks. Wikipedia
South Korean petrochemical producers cut run rates by up to 50 percent. Japan, sourcing roughly 4 in every 10 barrels of its crude from the Gulf, faced comparable pressure. Atlantic Council Meanwhile, China — the largest crude importer on earth — discovered that its buffers, while more substantial than its neighbours’, were not inexhaustible. China’s LNG inventories as of end-February stood at 7.6 million tonnes, providing short-term cover, but Beijing would need to compete for Atlantic cargoes if the outage persisted. CNBC
Chart suggestion: Pre- and Post-Crisis Daily Flows Through the Strait of Hormuz (barrels/day, LNG volumes, Q4 2025 vs. March 2026)
The Fertilizer and Food Security Cascade: The Crisis Nobody Saw Coming
The most underappreciated dimension of the 2026 Hormuz crisis is not its energy dimensions — it is its agricultural ones.
The Arabian Gulf is the central hub for global agriculture, accounting for at least 20% of all seaborne fertilizer exports. The dependency is even more acute for urea, the world’s most widely used nitrogen fertilizer, with 46% of global trade originating from the region. World Economic Forum This supply is critical for India (which accounts for 18% of global urea imports), Brazil (10%), and China (8%).
About one-third of global seaborne trade in fertilizers typically passes through the Strait of Hormuz. The disruption affects not only export markets such as Sudan, Brazil, or Sri Lanka, but also fertilizer producers elsewhere that lack key ingredients. Carnegie Endowment for International Peace The Gulf produces roughly a quarter of global sulfur — a byproduct of oil refining that phosphate producers worldwide need to convert rock phosphate into a plant-absorbable nutrient. With Gulf refineries offline, that input supply has simply ceased.
The price shock and shortage of fertilizer during spring planting season could reduce the planting and yields of corn in the US — the main feedstock for US beef, poultry, and dairy — and potentially increase global food prices into 2027. Wikipedia The urea benchmark is up about 30 percent in the last month. Carnegie Endowment for International Peace Fertilizer plants have paused operations in Bangladesh, schools have closed in Pakistan, and India and Japan are turning to coal wherever possible. Time
The deeper structural problem, as the Carnegie Endowment for International Peace has noted, is that G7 countries do not maintain strategic fertilizer reserves to match their oil stockpiles. Carnegie Endowment for International Peace The geopolitical architecture of critical commodity security was designed for petroleum. It was not designed for the agricultural inputs that petroleum-adjacent economies also happen to produce in abundance. That is a failure of imagination that is now measurable in calories.
Why Bypass Pipelines and Alternative Routes Are Not the Answer
The default technocratic response to any Hormuz crisis has always involved pointing to bypass infrastructure — and the bypass infrastructure has always fallen grotesquely short of requirements.
Saudi Arabia increasingly diverted oil to the Red Sea port of Yanbu via the East–West Crude Oil Pipeline, while the UAE diverted oil via the Abu Dhabi Crude Oil Pipeline to Fujairah on the Arabian Sea. Iraq has an alternative route via the Kirkuk–Ceyhan Pipeline to the Mediterranean through Turkey. The combined capacity of these pipelines is 9 million barrels per day — compared to the 20 million that ordinarily transits the strait. Wikipedia
That arithmetic is damning enough. But the picture is worse. The Red Sea route is vulnerable to potential attacks by the Houthis Wikipedia, who announced a resumption of attacks on commercial shipping contemporaneously with the Hormuz closure, forcing Suez Canal traffic to reroute around Africa’s Cape of Good Hope, adding weeks to transit times and increasing shipping costs. Wikipedia
For LNG, there is no bypass solution whatsoever. Pipeline infrastructure does not exist to redirect Qatari or Emirati gas exports to Asia in the event of Hormuz closure. The rerouting of LNG tankers around the Cape adds weeks — weeks during which Asian countries run through reserves and industrial facilities shut down. By March 22, Dun & Bradstreet’s analysis had identified 7,716 businesses that had experienced at least one shipment cancellation since February 28, with more than 44,000 businesses across 174 economies having at least one shipment exposed. Dun & Bradstreet
The seductive promise of alternatives to Strait of Hormuz oil transit has always obscured one fundamental reality: the strait was never just an oil route. It is the central node of a complex energy and commodities system that evolved, over fifty years, to run through that single chokepoint. You cannot reroute a system. You can only redesign it.
An Honest Reckoning: Why This Was Always Coming
Let me say something that the diplomatic language of think-tank reports tends to avoid: the Hormuz crisis of 2026 is a failure of political will, not a failure of intelligence.
Every credible scenario exercise run by the Brookings Institution, the Centre for Strategic and International Studies, or the Council on Foreign Relations in the past twenty years identified Hormuz as the single largest structural vulnerability in global energy security. Every IEA annual report since the early 2000s flagged the concentration of oil transit through a single choke point controlled by a potentially hostile state. Every geopolitical stress test modelled this exact scenario — an Iran-US confrontation triggering a de facto closure — and generated results that looked very much like the data we are reading today.
The world was warned. Repeatedly. In precise technical language by credentialed institutions with significant policy access. And the world — its energy ministries, its central banks, its insurance markets, its shipping consortia — collectively decided that the costs of reducing Hormuz dependency were higher than the probability-weighted costs of a crisis.
That calculation was wrong. And it was wrong not because the probability was misjudged, but because the magnitude of the crisis was systematically underestimated. The assumption was that Hormuz disruptions would be brief, partial, and primarily confined to oil prices. No model adequately captured the simultaneous fertilizer shock, the LNG supply collapse, the insurance market withdrawal, the compounding Red Sea disruption, or the cascading food security crisis across three continents. The system turned out to be dramatically more interconnected than the models assumed.
In conversations with more than three dozen oil and gas traders, executives, brokers, shippers, and advisers, one message was repeated over and over: the world still hasn’t grasped the severity of the situation. Bloomberg That, perhaps, is the most chilling line to emerge from this crisis. If the energy professionals closest to the system believe its severity is still underestimated, then every policy response calibrated to “managing” rather than “redesigning” the global energy architecture is starting from the wrong premise.
The Way Forward After the Hormuz Crisis: Energy Security That Doesn’t Rely on a Single Lane
1. A Hormuz Transit Initiative: Multilateral Legal Architecture for Chokepoints
The most immediate need is political, not technical. The Black Sea Grain Initiative offers a lesson: even in the midst of war, diplomacy can still make room for necessity. Time What is needed is a standing international legal regime — call it a Hormuz Transit Initiative — that establishes permanent protocols for the safe passage of food, fertilizers, and energy commodities through internationally critical straits, backed by multilateral guarantees and enforceable under UNCLOS.
Iran’s closure of the strait constitutes a violation of the UN Convention on the Law of the Sea by denying transit passage through a strait used for international navigation. Wikipedia The international community’s failure to enforce that principle in real time reflects the absence of a pre-negotiated institutional mechanism. A Hormuz Transit Initiative would not require the resolution of the US-Iran conflict. It would require only the recognition of a shared global interest in preventing cascading humanitarian crises — an interest that, as the International Crisis Group has argued, is real even for adversarial states.
2. Diversified Strategic Reserve Coordination: Extending SPR Logic to LNG and Fertilizers
The strategic petroleum reserve system, coordinated through the IEA, is the only institutional mechanism that has provided any meaningful buffer to this crisis — and its limitations have been nakedly exposed. G7 countries maintain no strategic fertilizer reserves to match their oil stockpiles. Carnegie Endowment for International Peace There are no internationally coordinated LNG strategic reserves.
This must change. The IEA framework should be extended, urgently, to encompass minimum mandatory LNG storage commitments for net-importing nations, and a G20 fertilizer reserve coordination mechanism should be established before the next Northern Hemisphere planting season. These are not radical proposals; they are the application of fifty-year-old strategic reserve logic to commodities that the 21st-century economy has made equally critical.
3. Accelerated Energy Transition as Strategic Security Policy
The long-term answer to Hormuz dependency is not more pipelines. It is fewer hydrocarbons. The structural reduction of global dependence on Persian Gulf oil and gas is simultaneously the most effective climate policy and the most effective energy security policy available.
The current crisis has, ironically, made the economic case for the energy transition more compelling than any carbon price or regulatory mandate. Analysts warn that if disruptions persist, the world will have to significantly reduce its oil and gas consumption — with some in the industry warning that the energy transition will be “forced on us in a very painful way.” CNBC
Japan and South Korea — among the most Hormuz-exposed economies on earth — should treat accelerated offshore wind, advanced nuclear, and hydrogen infrastructure not as energy policy but as national security investments. The World Economic Forum’s Global Risks Report 2026 notes that geoeconomic confrontation is now a key driver of economic and industrial policy. World Economic Forum Energy transition investment is the most effective hedge against that confrontation.
4. Gulf-Asia Energy Diplomacy: New Long-Term Architecture
For Asian economies that will remain hydrocarbon-dependent for the next decade, the strategic response to 2026 must include a fundamental restructuring of their energy supply relationships. The Gulf International Forum has noted that Gulf national oil companies can leverage the current crisis to accelerate long-term supply agreements with Asian buyers now acutely aware of their vulnerability to spot market volatility. Gulf International Forum
Long-term offtake agreements, co-investment in bypass infrastructure, and the strategic diversification of supply sources — toward US LNG, Australian LNG, East African oil, and Atlantic basin producers — should now be treated as non-negotiable elements of Asian energy security planning. The era of comfortable spot market dependence on a single chokepoint region is over.
5. Petrochemical and Fertilizer Supply Chain Resilience
The crisis could enable Beijing to establish new chokepoints over near-term or more enduring petrochemical supply chains Atlantic Council — a geopolitical consequence that democracies in Asia and Europe have been slow to recognize. Western industrial policy, already pivoting toward critical mineral supply chain resilience, must now explicitly encompass petrochemical feedstocks, fertilizer inputs, and LNG.
The US Inflation Reduction Act and the EU’s Critical Raw Materials Act were steps in the right direction. A Hormuz-aware industrial policy would extend this logic to the full spectrum of commodities that transit this chokepoint — and invest accordingly in domestic production capacity, allied-nation supply agreements, and stockpiling.
What This Crisis Has Already Changed — Permanently
It would be a mistake to treat the 2026 Hormuz crisis as an event from which the world simply recovers and returns to a previous equilibrium. That equilibrium is gone.
Insurance markets have permanently repriced Gulf transit risk. Shipping companies have begun investing in Cape of Good Hope routing infrastructure. Asian governments have initiated emergency reviews of their Hormuz exposure, and some — Japan and South Korea most urgently — are accelerating alternative energy investments that would previously have faced years of political resistance.
As of April 2026, there are ongoing concerns about energy security as well as food security related to fertiliser shortages and costs. Wikipedia These concerns will not resolve when the Strait reopens. They will persist — and they should persist — as the animating force behind an overdue restructuring of global energy architecture.
The crisis has also, finally, forced a honest public accounting of the degree to which the global food system runs on Gulf hydrocarbons. The fertilizer supply chain, the nitrogen cycle, the spring planting season in the Northern Hemisphere — all of these depend, in ways most consumers have never been asked to understand, on smooth passage through a twenty-one-mile bottleneck controlled by a nation currently at war.
That is not a sustainable arrangement. It was never a sustainable arrangement. The difference between 2006 and 2026 is that the consequences of sustaining it are no longer hypothetical.
Conclusion: The Strait Has Spoken — Now Policymakers Must Act
The Strait of Hormuz has always been more than a shipping lane. It is a test — a recurring, high-stakes examination of whether the international community has the strategic foresight and political will to manage its own dependencies.
For fifty years, the world has failed that test by passing it narrowly enough to avoid catastrophe. The disruptions of 2011, 2012, 2019, and 2020 were warnings. Each time, the system held — barely — and the warnings were filed under “risk management” rather than “structural reform.”
The 2026 crisis may be different. Not because the immediate shock is unique — it was always predictable — but because the second and third-order consequences are now visible in ways that are genuinely unprecedented. Fertilizer shortages during planting season. LNG rationing in Pakistan and Bangladesh. South Korean factories cutting production by half. European gas prices doubling into spring. A possible $200 barrel of oil that would constitute the largest single economic disruption since the 2008 financial crisis.
The main message from the energy industry insiders closest to the crisis is that the world will get the energy transition forced on it in a very painful way that will happen very quickly. Bloomberg That is not, ultimately, an oil trader’s message. It is a policymaker’s instruction.
The way forward is not to reopen the Strait and return to the comfortable dependency that created this crisis. The way forward is to use this rupture — this painful, expensive, globally disruptive moment — to build a global energy architecture that no longer has a single point of failure.
Twenty-one miles of water should not hold the world to ransom. The fact that it does, in 2026, is a policy choice. And policy choices can be unmade.
Discover more from The Economy
Subscribe to get the latest posts sent to your email.
-

 Markets & Finance3 months ago
Top 15 Stocks for Investment in 2026 in PSX: Your Complete Guide to Pakistan’s Best Investment Opportunities
-

 Analysis2 months ago
Brazil’s Rare Earth Race: US, EU, and China Compete for Critical Minerals as Tensions Rise
-

 Banks3 months ago
Best Investments in Pakistan 2026: Top 10 Low-Price Shares and Long-Term Picks for the PSX
-

 Investment3 months ago
Top 10 Mutual Fund Managers in Pakistan for Investment in 2026: A Comprehensive Guide for Optimal Returns
-

 Analysis2 months ago
Top 10 Stocks for Investment in PSX for Quick Returns in 2026
-

 Asia3 months ago
China’s 50% Domestic Equipment Rule: The Semiconductor Mandate Reshaping Global Tech
-

 Global Economy3 months ago
Pakistan’s Export Goldmine: 10 Game-Changing Markets Where Pakistani Businesses Are Winning Big in 2025
-

 Global Economy3 months ago
15 Most Lucrative Sectors for Investment in Pakistan: A 2025 Data-Driven Analysis