
Geopolitics
Global Cooperation Barometer 2026: Why International Collaboration Isn’t Dead—It’s Just Evolving [WEF Report Analysis]
While 123 million people were forcibly displaced in 2024—the highest number on record—global cooperation metrics held remarkably steady. This paradox lies at the heart of the World Economic Forum’s Global Cooperation Barometer 2026, a comprehensive analysis that challenges our assumptions about international collaboration in an age of rising tensions.
The third edition of this landmark report, developed in partnership with McKinsey & Company, reveals a nuanced truth: global cooperation isn’t collapsing—it’s transforming. Traditional multilateral frameworks may be straining under geopolitical pressures, but smaller, more agile coalitions are emerging to fill critical gaps in trade, technology transfer, climate action, and even security.
This evolution represents what UN Secretary-General António Guterres calls “hard-headed pragmatism”—the recognition that cooperation makes sense when it delivers tangible mutual benefits, even in a fragmented world.
What is the Global Cooperation Barometer 2026?
The Global Cooperation Barometer is an annual assessment by the World Economic Forum and McKinsey & Company that measures international collaboration across five key areas: trade and capital, innovation and technology, climate and natural capital, health and wellness, and peace and security. Using 41 metrics indexed to 2020, the 2026 edition finds overall cooperation held steady despite geopolitical tensions, but its composition shifted dramatically—from large multilateral frameworks toward smaller, flexible coalitions based on aligned interests and pragmatic problem-solving.
After analyzing 41 distinct metrics across five essential pillars—trade and capital, innovation and technology, climate and natural capital, health and wellness, and peace and security—the report’s central finding is clear: cooperation is adapting to new realities rather than disappearing entirely.
The Surprising Resilience of Global Cooperation
The 2026 Global Cooperation Barometer tracks international collaboration from 2012 through 2024, with all data indexed to 2020 as a baseline. This methodology, endorsed by OECD economists, allows researchers to isolate trends that emerged before the COVID-19 pandemic and those accelerated by it.
The topline finding? Overall cooperation levels in 2024 remained virtually unchanged from 2023, despite an environment characterized by:
- Escalating trade barriers and protectionist policies
- Multiple active military conflicts across three continents
- Heightened mistrust between major economic powers
- Record levels of forced displacement
- Increasing restrictions on technology transfers
According to Børge Brende, President and CEO of the World Economic Forum, “The paradox is that, at a time of such rapid change, developing new and innovative approaches to cooperation requires refocusing on some of the basics—notably, doubling down on dialogue.”
Understanding the Methodology
The barometer’s rigor lies in its comprehensive approach. Each of the five pillars comprises two indices:
- Action Index: Measures concrete cooperative behaviors (trade flows, knowledge exchange, financial transfers)
- Outcome Index: Tracks results of cooperation (life expectancy, emissions levels, conflict casualties)
Data is normalized to account for economic growth and population changes, ensuring that trendlines reflect genuine cooperation shifts rather than simple expansion. For example, trade metrics are measured as a percentage of global GDP, while migration data is normalized to global population levels.
This methodology, reviewed by International Monetary Fund economists, provides an apples-to-apples comparison across vastly different domains—from pharmaceutical R&D cooperation to peacekeeping deployments.
The Composition Shift That Matters
While aggregate cooperation held steady, the composition of that cooperation shifted dramatically. Metrics tied to global multilateral institutions—those large-scale frameworks involving most of the world’s nations—declined sharply:
- UN Security Council resolutions fell from 50 in 2023 to 46 in 2024
- Multilateral peacekeeping operations dropped by 11% year-over-year
- Official Development Assistance plummeted 10.8% in 2024
- International Health Regulations compliance weakened
Simultaneously, cooperation flourished in areas where flexible, interest-based partnerships could operate:
- Cross-border data flows surged, with international bandwidth now 4x larger than pre-pandemic levels
- Services trade continued its five-year growth trajectory
- Climate finance reached record levels, approaching $1 trillion annually
- Foreign direct investment in strategic sectors (semiconductors, data centers, EV batteries) accelerated
This divergence reveals a fundamental shift: from universal frameworks to tailored coalitions. As McKinsey’s research demonstrates, cooperation increasingly follows geopolitical alignment, with partners choosing collaborators based on shared interests and values rather than institutional membership alone.
Trade and Capital: Reconfiguration Over Retreat
The trade and capital pillar reveals perhaps the most complex story in the entire report. On the surface, cooperation appears flat—neither advancing nor retreating significantly. But beneath this stability, tectonic plates are shifting.
The Great Trade Rearrangement
According to World Trade Organization data analyzed in the report, global goods trade grew slightly slower than overall GDP in 2024, leading to a marginal decline in trade intensity. More revealing than the volume, however, is the geographic redistribution underway.
McKinsey Global Institute research finds that the average “geopolitical distance” of global goods trade fell by approximately 7% between 2017 and 2024. Countries are trading more with geopolitically aligned partners and less with distant ones—particularly between the United States and China.
The numbers tell a stark story:
- US imports from China fell 20% in the first seven months of 2025 compared to the same period in 2024
- Developing countries’ share of manufacturing exports rose by 5 percentage points in 2024
- China represented over half of this growth, adding $276 billion in exports
- Trade concentration (measured by the Herfindahl-Hirschman Index) declined by about 1%, indicating slight diversification
“We’re witnessing not deglobalization but reglobalization,” explains Dr. Richard Baldwin, Professor of International Economics at the Graduate Institute Geneva. “Trade relationships are being rewired along lines of trust and strategic alignment.”
The Silent Surge in Services and Capital
While goods trade reconfigured, less visible but equally important flows accelerated. Services trade—encompassing IT services, professional services, travel, and digitally delivered offerings—continued climbing throughout 2024.
According to UNCTAD data, services trade growth was driven primarily by:
- Digitally delivered services: IT consulting, cloud services, software development
- Business services: R&D, engineering, professional services
- Travel services: Rebounding from pandemic lows, though not yet at 2019 levels
Foreign direct investment told a similar story. While overall FDI flows remained complex (influenced by “phantom FDI” in tax havens), greenfield investment announcements—representing real productive capacity—surged in future-shaping industries.
FDI Markets data reveals a striking trend: newly announced greenfield projects concentrated heavily in:
- Semiconductors: $89 billion in announced projects globally
- Data centers and AI infrastructure: $370 billion (up from $190 billion in 2024)
- EV battery manufacturing: $67 billion
- Critical minerals processing: $34 billion
These investments flowed predominantly between geopolitically aligned partners. Advanced economies, particularly the United States, attracted the lion’s share, while China’s portion of announced FDI inflows dropped from 9% (2015-19 average) to just 3% (2022-25).
The Multilateral Casualty: Foreign Aid
The sharpest decline in the trade and capital pillar came in Official Development Assistance. According to OECD tracking, ODA fell 10.8% in 2024, with only four donor countries exceeding the UN target of 0.7% of gross national income.
The 2025 outlook appears even bleaker. The OECD projects an additional 9-17% decline in ODA, driven by:
- Reduced humanitarian aid budgets
- Decreased refugee spending in donor countries
- Lower aid to Ukraine as military assistance shifts
- Domestic political pressures in major donor nations
This trend has profound implications for low and middle-income countries that depend on international assistance for health systems, education, and infrastructure development.
New Coalition Models Emerge
Despite these challenges, innovative cooperation frameworks are sprouting. The Future of Investment and Trade (FIT) Partnership, launched in September 2025, brings together 14 economies—including Singapore, New Zealand, Switzerland, and the UAE—to pilot practical trade cooperation mechanisms.
According to Brookings Institution analysis, such “minilateral” arrangements offer several advantages over traditional multilateral treaties:
- Speed: Smaller groups reach consensus faster
- Flexibility: Tailored agreements address specific needs
- Resilience: Less vulnerable to any single member’s withdrawal
- Pragmatism: Focus on mutual gains rather than universal principles
Other examples include the EU-Mercosur trade agreement (after a decade of negotiations), the ASEAN Digital Economy Framework Agreement, and bilateral critical minerals deals between the US and allies like Australia and Canada.
Innovation and Technology: The AI Race Drives Selective Cooperation
The innovation and technology pillar registered a 3% year-over-year increase—one of the strongest performances across all five domains. Yet this growth masks growing tensions over technology transfer, particularly in areas deemed strategically sensitive.
The Data Flow Explosion
International bandwidth capacity quadrupled between 2019 and 2024, according to International Telecommunication Union statistics. Cross-border data flows—measured as a percentage of total internet traffic—continued their upward trajectory, fueled by:
- Cloud computing adoption accelerating globally
- Remote work normalizing post-pandemic
- Streaming services expanding internationally
- AI model training requiring distributed datasets
Cisco’s annual internet report projects that global IP traffic will reach 4.8 zettabytes per year by 2027, with a growing share crossing international borders.
This digital connectivity enabled a corresponding rise in IT services trade. Software development, cloud services, and AI consultation increasingly operate as global markets, with talent and expertise flowing across borders despite physical restrictions.
The Strategic Technology Paradox
Even as general technology cooperation flourished, restrictions tightened on specific advanced technologies. The United States expanded export controls on:
- Advanced semiconductors and chipmaking equipment
- AI training systems above certain computational thresholds
- Quantum computing components
- Certain biotechnology applications
According to McKinsey research on export controls, these restrictions primarily target China but ripple across global supply chains, affecting companies and research institutions worldwide.
The paradox? Cooperation in cutting-edge technologies continues—but increasingly within aligned blocs. Examples include:
US-Aligned Technology Partnerships:
- US-India Initiative on Critical and Emerging Technology (iCET)
- US-EU Trade and Technology Council advancing AI safety standards
- US-Japan semiconductor research collaboration
- US-UAE framework on advanced technology cooperation
China-Led Technology Initiatives:
- 5G infrastructure partnerships across Southeast Asia and Africa
- AI research centers in Gulf states
- Data center investments in emerging markets
- Technology transfer agreements with Belt and Road countries
Foreign Affairs magazine describes this as “technological bifurcation”—not complete decoupling, but the emergence of parallel ecosystems with limited interconnection.
The Student Visa Squeeze
One concerning trend threatens long-term technology cooperation: declining international student mobility. After reaching record highs in 2024 (up 8% from 2023), international student flows appear to be contracting in 2025.
Data from major destination countries shows:
- United States: F-1 and M-1 student visas down 11% in Q1 2025
- United Kingdom: Student visa grants fell 2% year-over-year
- Australia: International student approvals dropped 64% (driven by new policy restrictions)
- Canada: Study permits declined amid new caps on international students
According to the Institute of International Education, this reversal could have long-term consequences for innovation. Historically, international students have contributed disproportionately to research breakthroughs, entrepreneurship, and cross-border knowledge networks.
Dr. Mary Sue Coleman, President of the Association of American Universities, warns: “When we restrict the flow of talent, we don’t just hurt international students—we diminish our own innovative capacity.”
The Productivity Question
Despite increases in most innovation metrics, one crucial outcome measure remained stubbornly flat: total factor productivity growth. The Conference Board’s data shows global productivity growth has stagnated for over a decade, raising questions about whether current cooperation patterns effectively translate into tangible economic benefits.
However, McKinsey Global Institute research suggests this may change. Generative AI could increase global productivity growth by 0.1 to 0.6 percentage points annually through 2040, but only if cooperation enables:
- Cross-border data access for model training
- International talent mobility for AI development
- Shared safety standards and governance frameworks
- Collaborative research on frontier applications
The question isn’t whether technology cooperation will matter—it’s whether current cooperation patterns will be sufficient to realize these gains.
Climate and Natural Capital: Deployment Rises, Outcomes Lag
The climate and natural capital pillar demonstrates both the promise and limitations of current cooperation patterns. Investment and deployment reached record levels, yet environmental outcomes continue deteriorating.
The Clean Energy Deployment Surge
Solar and wind capacity additions doubled between 2022 and 2024—from 300 to 600 gigawatts—according to the International Renewable Energy Agency. In the first half of 2025 alone, installations were 60% higher than the same period in 2024.
Remarkably, in the last 18 months, the world installed more solar capacity than in the previous three years combined.
International Energy Agency analysis attributes this acceleration to:
- Dramatic cost reductions: Solar module prices fell 90% over the past decade
- Global supply chains: Chinese manufacturing scale drove affordability
- Policy alignment: Domestic energy security goals converged with climate objectives
- Climate finance flows: Both public and private investment reached near $1 trillion annually
China accounted for two-thirds of solar, wind, and electric vehicle additions, but developing economies showed strong momentum. India became the world’s second-largest solar installer, while Brazil accelerated wind and solar deployment significantly.
The Natural Capital Challenge
While energy transition metrics improved, natural capital indicators stagnated or worsened:
- Marine protected areas: Growth stalled during 2023-24
- Terrestrial protected areas: Expansion slowed after steady progress
- Ocean Health Index: Continued gradual decline
- Biodiversity loss: Accelerated despite international commitments
The UN’s High Seas Treaty, reaching the required 60 ratifications in late 2025, offers hope. Entering force in January 2026, it creates the first legally binding framework for protecting two-thirds of the ocean beyond national jurisdiction.
Yet implementation remains uncertain, and the treaty faces the same multilateral pressures affecting other global agreements.
The Emissions Reality Check
Despite record clean energy deployment, global greenhouse gas emissions continued rising in 2024. Global Carbon Project data shows fossil fuel emissions reached approximately 37.8 billion tonnes of CO2 in 2024, up from 37.3 billion tonnes in 2023.
According to McKinsey Global Institute research, the energy transition is progressing at roughly half the speed needed to meet Paris Agreement goals of limiting warming to 1.5°C.
There is one encouraging trend: emissions intensity (emissions per unit of GDP) continues declining, demonstrating that economic growth can occur alongside emissions management—even if absolute reductions remain elusive.
Regional Climate Coalitions Take the Lead
As comprehensive global agreements prove challenging, regional cooperation is filling gaps:
European Union Initiatives:
- The Clean Industrial Deal (February 2025) aims to make decarbonization a competitive advantage
- The Net-Zero Industry Act accelerates manufacturing of clean technologies in Europe
- The Critical Raw Materials Act secures strategic inputs for the energy transition
- The EU-Central Asia Hydrogen Partnership (September 2025) creates new clean energy corridors
ASEAN Cooperation:
- The LTMS-PIP (Laos-Thailand-Malaysia-Singapore Power Integration Project) enables cross-border clean power trading
- Progress toward an integrated ASEAN Power Grid enhances energy security while enabling renewable deployment
- The ASEAN Community Vision 2025 and Master Plan on ASEAN Connectivity both reached target dates with mixed implementation
COP30 Outcomes: The UN climate conference in Brazil produced several commitments:
- Tripling of adaptation finance by 2035
- Launch of the Tropical Forests Forever Facility to boost investment in protected areas
- New mechanisms for loss and damage funding
Climate Policy Initiative analysis notes that while these commitments are significant, the critical challenge remains implementation—translating pledges into deployed capital and measurable emissions reductions.
The Just Energy Transition Shortfall
One area of cooperation that significantly underperformed expectations: the Just Energy Transition Partnerships (JETPs). These international financing mechanisms aim to assist emerging economies in transitioning to low-emission energy systems.
Despite commitments totaling $50 billion, only $7 billion had been delivered by June 2025—a 86% shortfall. According to World Resources Institute analysis, delays stemmed from:
- Bureaucratic complexity in mobilizing multilateral funds
- Competing domestic priorities among donor nations
- Difficulty coordinating between multiple financial institutions
- Recipients’ concerns about sovereignty and conditionality
This underperformance illustrates a broader challenge: while climate cooperation shows resilience in some areas (financing, trade, technology deployment), translating commitments into action remains difficult in the current geopolitical environment.
Health and Wellness: Resilient Outcomes, Eroding Support
The health and wellness pillar presents perhaps the most deceptive picture in the entire barometer. Overall cooperation appears stable—but this masks a dangerous erosion of the foundational support systems that enable positive health outcomes.
The Outcome Resilience
All major health outcome metrics improved in 2024, according to the Institute for Health Metrics and Evaluation:
- Life expectancy continued its post-pandemic recovery
- Child mortality (under-five) declined further
- Maternal mortality decreased in most regions
- Disability-adjusted life years (DALYs) improved globally
These improvements reflect long-term developmental trends, post-pandemic normalization, and the cumulative effect of previous investments in global health systems.
However, health experts warn these improvements may prove temporary if current trends in health cooperation continue.
The Development Assistance Crisis
Development Assistance for Health fell 6% to $50 billion in 2024—continuing a three-year downward trend. IHME projections suggest an additional $11 billion decline in 2025, largely due to expected cuts from US funding agencies (approximately $9 billion).
Major donor reductions include:
- United States: PEPFAR (President’s Emergency Plan for AIDS Relief) facing budget pressures; USAID tightening cost-sharing requirements
- United Kingdom: Continued retrenchment in global health spending amid domestic fiscal pressures
- Germany: ODA cuts affecting health assistance
According to World Health Organization officials, this creates a dangerous dynamic: bilateral health assistance increasingly focuses on direct service delivery (medicines, diagnostics, frontline care) while reducing support for health system infrastructure, training, and governance.
Dr. Tedros Adhanom Ghebreyesus, WHO Director-General, describes this as “robbing Peter to pay Paul—we’re treating today’s patients while dismantling the systems needed to care for tomorrow’s.”
The Multilateral-Bilateral Shift
A significant trend emerged in 2024: funding through multilateral channels (WHO, Global Fund, multilateral development banks) fell by approximately 20%, while bilateral country-to-country funding declined only 3%.
This shift toward bilateral assistance has several implications:
Potential Benefits:
- More direct accountability between donor and recipient
- Faster deployment to specific needs
- Reduced bureaucratic overhead
- Clearer metrics for impact assessment
Significant Risks:
- System-level costs (training, governance, infrastructure) go unfunded
- Recipients face increased burden on domestic budgets
- Coordination between different bilateral programs weakens
- Political considerations may override health priorities
- Smaller countries with less strategic importance receive less support
Pandemic Preparedness in Limbo
The WHO Pandemic Agreement, adopted in May 2025 after three years of challenging negotiations, represents both an achievement and a disappointment in health cooperation.
On one hand, the agreement marks the first binding global framework for pandemic response, addressing lessons from COVID-19 around:
- Equitable access to vaccines and therapeutics
- Information sharing during outbreaks
- Research collaboration and pathogen surveillance
- Capacity building in low-resource settings
On the other hand, the United States—the world’s largest economy and historically the leading contributor to global health—did not participate in the agreement. This absence raises questions about the framework’s practical effectiveness.
Dr. Jennifer Nuzzo, Director of the Pandemic Center at Brown University School of Public Health, notes: “Treaties create obligations on paper, but pandemic preparedness requires sustained investment, trust, and coordination—all of which are in short supply in the current environment.”
Regional Health Cooperation Gains Ground
As global multilateral frameworks face pressure, regional cooperation showed promising developments:
Africa:
- The African Medicines Agency held its second session in Kigali (June 2025), advancing pharmaceutical regulatory harmonization
- The Accra Compact aligned African governments on health sovereignty priorities
- South Africa’s Aspen Pharmacare expanded COVID-19 vaccine manufacturing for the continent
Caribbean:
- The Organisation of Eastern Caribbean States scaled a model to reduce insulin prices region-wide
- Negotiations advanced on a Caribbean pharmaceutical procurement alliance
Latin America:
- Brazil’s Butantan Institute partnered with other regional manufacturers on vaccine development
- The Pan American Health Organization (PAHO) strengthened regional disease surveillance
The Lancet, in a November 2025 editorial, described these developments as “pragmatic regionalism”—a recognition that health security increasingly depends on strong regional capacity rather than solely on global institutions.
The Healthspan-Lifespan Gap
One troubling trend that demands attention: while life expectancy continues rising, “health-adjusted life expectancy” (years lived in good health) lags behind. According to research published in JAMA Network Open, this means people are living more years with illness and disability.
This “healthspan-lifespan gap” varies significantly by geography and socioeconomic status, but it’s widening in most regions—suggesting that current health cooperation patterns, while extending life, may be less effective at ensuring those additional years are healthy and productive.
Peace and Security: The Pillar Under Greatest Strain
No pillar declined as sharply as peace and security. Every single metric tracked in this domain fell below pre-pandemic levels, reflecting an intensification of conflict and a weakening of multilateral conflict resolution mechanisms.
The Conflict Surge
The number of active conflicts increased in 2024, according to Uppsala Conflict Data Program. Major conflicts include:
- The ongoing Russia-Ukraine war (continuing into its third year)
- Israel-Hamas conflict in Gaza (beginning October 2023)
- Israel-Hezbollah hostilities (escalating in 2024)
- Civil war in Sudan (displacing 11.5 million people)
- Civil war in Myanmar (intensifying since 2021 coup)
- Intensified fighting in eastern Democratic Republic of Congo
Battle-related deaths remained near 2023 levels, with the Russia-Ukraine conflict accounting for over 40% of total fatalities.
The Displacement Crisis
Forcibly displaced people reached a record 123 million globally by the end of 2024, according to UNHCR. This represents an increase from 117 million in 2023 and 108 million in 2022.
The Sudan conflict alone displaced approximately 11.5 million people—the largest single-year displacement since Syria’s civil war peaked in 2013-2015.
Refugee flows strained hosting countries, particularly:
- Turkey (hosting 3.6 million Syrian refugees plus new arrivals)
- Pakistan (hosting Afghan refugees amid economic crisis)
- Uganda (hosting over 1.5 million refugees from multiple neighboring conflicts)
- Poland and other Eastern European nations (supporting Ukrainian refugees)
According to Internal Displacement Monitoring Centre, the costs of supporting displaced populations fall disproportionately on middle-income countries neighboring conflict zones—countries that often lack the resources for adequate support.
Multilateral Mechanisms Under Pressure
The decline in multilateral peace and security cooperation manifested in several metrics:
UN Security Council:
- Resolutions decreased from 50 (2023) to 46 (2024)
- Vetoes by permanent members blocked action on several major conflicts
- The ratio of resolutions to active conflicts declined significantly
- Until November 2025, no new peacekeeping operation had been mandated since 2014
Peacekeeping Operations:
- The ratio of multilateral peacekeeping operations to conflicts fell by approximately 11% year-over-year
- Personnel deployed to multilateral peace operations declined by more than 40% between 2015 and 2024
- Budget constraints disrupted operations, with the approved UN peacekeeping budget falling from $9.7 billion (2014) to $4.7 billion (2025)
Stockholm International Peace Research Institute attributes these declines to:
- Geopolitical tensions among major powers limiting consensus
- Donor fatigue and budget pressures in contributing countries
- Questions about peacekeeping effectiveness in complex civil wars
- Host country sovereignty concerns limiting mandate flexibility
The Cyber and Grey-Zone Threat
Beyond traditional kinetic conflict, 2024 saw intensification of cyberattacks and “grey-zone” activities—actions that fall below the threshold of open warfare but still inflict significant damage.
Verizon’s 2025 Data Breach Investigations Report documents surging cyber incidents across Asia, the Middle East, and Europe. High-profile attacks in 2024-25 included:
- Tata Motors’ Jaguar Land Rover halted production due to cyberattack (September 2025)
- Marks & Spencer faced up to £300 million losses from cyber breach (May 2025)
- Multiple critical infrastructure attacks across Europe
Physical infrastructure also came under attack through grey-zone operations:
- Sabotage of gas pipelines in Europe
- Damage to undersea internet cables in the Red Sea and West Africa (three major multi-cable outages)
- GPS jamming affecting civilian aviation
- Disinformation campaigns targeting elections in multiple democracies
Center for Strategic and International Studies analysis suggests these grey-zone activities are becoming the preferred tool for state and non-state actors seeking to achieve strategic objectives while avoiding direct military confrontation.
The Defense Spending Response
Countries responded to deteriorating security with increased defense budgets:
NATO:
- All 32 member states met the 2% of GDP defense spending target in 2025 (compared to fewer than 20 in 2024)
- The alliance raised its spending target to 5% of GDP for 2035 at The Hague Summit (June 2025)
Asia-Pacific:
- China continued double-digit defense budget increases
- Japan increased defense spending significantly, moving toward the 2% NATO target
- India expanded military modernization programs
- Australia boosted defense spending in response to regional tensions
European Union:
- The European Defence Agency reported increased spending across member states
- New EU defense industrial strategy launched to build autonomous capabilities
According to International Institute for Strategic Studies, global military expenditure reached approximately $2.4 trillion in 2024, representing roughly 2.2% of global GDP—the highest level since the early post-Cold War period.
Regional Peacekeeping Fills the Gap
Despite the decline in UN-led multilateral operations, regional bodies stepped up:
African Union:
- Led security transition in Somalia (ATMIS – African Union Transition Mission in Somalia)
- Deployed forces to eastern Democratic Republic of Congo
- Supported peacekeeping efforts in South Sudan
ECOWAS (Economic Community of West African States):
- Maintained presence in several West African nations
- Coordinated responses to coups and instability in the Sahel
Arab League and GCC (Gulf Cooperation Council):
- Mediation efforts in Yemen
- Coordination on security challenges in the Red Sea corridor
United States Institute of Peace research suggests regional organizations often have advantages in peacekeeping:
- Better understanding of local contexts and dynamics
- Greater perceived legitimacy among parties to conflicts
- Ability to act when great power politics block global action
- More flexible mandates and lighter bureaucracy
However, these operations also face significant challenges, including limited resources, potential conflicts of interest among regional powers, and questions about impartiality.
Emerging Bright Spots in Conflict Resolution
Despite the overall decline, some successful examples of cooperation emerged in 2024-25:
Türkiye’s Mediation:
- The Ankara Declaration (February 2025) led to de-escalation of tensions between Ethiopia and Somalia
- Turkish diplomacy facilitated technical talks and confidence-building measures
Armenia-Azerbaijan Progress:
- The two nations agreed on the text of a peace treaty with EU and US facilitation
- Steps taken to keep third-country forces off borders reduced immediate escalation risks
Israel-Hamas Ceasefire:
- After 15 months of conflict, Qatar and Egypt mediated a ceasefire agreement in January 2025
- While fragile, the agreement created space for humanitarian access and reconstruction discussions
These examples underscore a theme throughout the barometer: while large-scale multilateral frameworks struggle, tailored diplomatic efforts by committed mediators can still yield results.
The Rise of Minilateralism: From Global to Agile
The single most important trend across all five pillars is the shift from universal, rules-based multilateralism toward smaller, flexible, interest-based coalitions.
Defining the New Cooperation Landscape
Multilateralism traditionally involved:
- Near-universal membership (180+ countries)
- Comprehensive frameworks (covering many issues)
- Consensus-based decision-making
- Institutional permanence (UN, WTO, WHO, etc.)
- Rules-based order with dispute resolution mechanisms
Minilateralism (sometimes called “plurilateralism”) instead features:
- Small groups of like-minded countries (3-20 members)
- Focused agendas (addressing specific challenges)
- Streamlined decision-making (easier consensus)
- Purpose-built arrangements (dissolving when objectives met)
- Pragmatic cooperation based on mutual interests
According to Council on Foreign Relations analysis, minilateralism offers several advantages in the current environment:
- Speed: Smaller groups negotiate and implement faster
- Flexibility: Tailored solutions address specific needs without compromising for universal buy-in
- Resilience: Less vulnerable to any single member’s withdrawal or obstruction
- Effectiveness: Clear objectives and accountable membership improve outcomes
- Complementarity: Can coexist with and supplement multilateral frameworks
Examples Across the Five Pillars
Trade and Capital:
- Future of Investment and Trade (FIT) Partnership (14 economies)
- EU-Mercosur trade agreement (after decade of negotiations)
- ASEAN Digital Economy Framework Agreement
- US-Australia-Japan-India Quad economic cooperation
- Bilateral critical minerals partnerships (US-Australia, US-Canada, US-Japan)
Innovation and Technology:
- US-India Initiative on Critical and Emerging Technology
- US-EU Trade and Technology Council
- US-Japan semiconductor research collaboration
- US-UAE advanced technology cooperation framework
- Various AI safety research partnerships
Climate and Natural Capital:
- EU Clean Industrial Deal and regional decarbonization efforts
- LTMS-PIP Southeast Asian power grid integration
- EU-Central Asia Hydrogen Partnership
- Just Energy Transition Partnerships (despite underperformance, represent minilateral model)
Health and Wellness:
- African Medicines Agency regional pharmaceutical cooperation
- OECS insulin procurement collaboration (Caribbean)
- Accra Compact on African health sovereignty
- Various regional vaccine manufacturing partnerships
Peace and Security:
- African Union-led peacekeeping missions
- ECOWAS regional security coordination
- Türkiye-mediated bilateral negotiations (Ethiopia-Somalia, others)
- Quad security dialogue (US-Japan-Australia-India)
The Geopolitical Clustering Dynamic
McKinsey Global Institute research identifies a clear pattern: cooperation increasingly occurs within geopolitical blocs defined by shared values, security concerns, and economic interests.
Three broad clusters are emerging:
Western-Aligned Bloc:
- North America, Europe, developed Asia-Pacific (Japan, South Korea, Australia)
- Characterized by: democratic governance, market economies, security alliances (NATO, bilateral treaties)
- Deepening integration in technology, defense, critical supply chains
China-Aligned Bloc:
- China, Russia, some Central Asian nations, selective African and Latin American partnerships
- Characterized by: state-directed economics,alternative governance models, Belt and Road participation
- Growing integration in infrastructure, commodities, some technologies
Non-Aligned/Swing States:
- India, Brazil, Indonesia, Turkey, Gulf states, much of Africa and Latin America
- Characterized by: strategic autonomy, economic pragmatism, multiple partnerships
- Maintain relationships across blocs, optimize for national interests
Critically, these clusters are not rigid or exclusive. Many countries maintain relationships across boundaries, and cooperation patterns vary by issue area. India, for example, partners with the US on technology and security (Quad) while maintaining trade relationships with Russia and China.
The Dialogue Imperative
For this new cooperation landscape to function effectively, dialogue becomes more—not less—important.
As UN Secretary-General António Guterres emphasized in his September 2025 address to the General Assembly: “Taking steps forward to address global priorities can only happen if parties first talk with one another to find commonality.”
Yet dialogue quality has deteriorated. Too often, international engagements feature:
- Positioning statements rather than genuine exchange
- One-way communication designed to hold ground rather than find common ground
- Performative diplomacy focused on domestic audiences
- Tactical maneuvering instead of problem-solving
Effective dialogue in the minilateral era requires:
- Confidential channels: Away from public pressure and domestic political constraints
- Specific agendas: Focused on concrete problems with potential solutions
- Good-faith participation: Genuine willingness to find mutually beneficial outcomes
- Technical expertise: Subject matter experts alongside diplomats
- Follow-through mechanisms: Implementation plans with clear accountability
Harvard Negotiation Project research emphasizes that successful minilateral cooperation depends on participants separating people from problems, focusing on interests rather than positions, and generating options for mutual gain before deciding on specific approaches.
What the Shifting Cooperation Landscape Means for Global Business
The transformation in global cooperation patterns has profound implications for multinational corporations, investors, and business leaders navigating an increasingly complex environment.
The Corporate Sentiment Split
The Global Cooperation Barometer survey of approximately 800 executives across 81 economies revealed a striking divergence in perceptions:
- 40% reported that growing barriers in trade, talent, and capital flows hampered their ability to do business
- 60% said the effects were neutral or not substantially negative
This split suggests that business impacts depend heavily on:
- Industry: Technology and pharmaceuticals face more restrictions than services
- Geography: Companies operating between aligned partners less affected than those spanning geopolitical divides
- Business model: Digital platforms more adaptable than asset-heavy manufacturers
- Strategic positioning: Proactive adaptation mitigates negative effects
According to Harvard Business Review analysis, companies successfully navigating this environment share several characteristics:
- Geopolitical intelligence capabilities: Dedicated teams tracking regulatory changes, alliance shifts, and emerging restrictions
- Flexible supply chains: Multiple sourcing options and rapid reconfiguration ability
- Regional strategies: Tailored approaches for different geopolitical clusters
- Government relations excellence: Deep understanding of policy priorities and effective engagement
- Scenario planning: Regular war-gaming of geopolitical shocks and strategic responses
The Opportunity in Reconfiguration
While some business leaders focus on cooperation’s decline, others see opportunity in its transformation. McKinsey research identifies several emerging opportunities:
New Trade Corridors:
- Intra-ASEAN trade growing rapidly as regional integration deepens
- Africa-India trade expanding as both seek diversification
- Middle East-Europe connections strengthening (renewable energy, logistics)
- Latin American regional trade agreements creating larger effective markets
Strategic Industry Positioning:
- Semiconductor manufacturing expanding beyond East Asia (US, Europe, India investments)
- EV battery supply chains developing regional hubs (Europe, North America, Southeast Asia)
- Critical minerals processing diversifying away from China dominance
- Pharmaceutical manufacturing regionalizing for supply security
Services and Digital Growth:
- IT services demand surging as businesses digitize and adopt AI
- Professional services expanding as companies navigate complex regulatory environments
- Digital platforms less constrained by physical trade barriers
- Knowledge-intensive services benefiting from continued (if selective) talent mobility
Climate Transition Opportunities:
- $1 trillion+ annual climate finance creating massive market
- Clean technology manufacturing and deployment accelerating globally
- Energy transition requiring infrastructure investment across developing economies
- Carbon markets and climate services expanding
Building a Geopolitical Nerve Center
McKinsey research on geopolitical risk management recommends companies establish a dedicated “geopolitical nerve center”—a cross-functional team responsible for:
Monitoring and Intelligence:
- Track regulatory changes across jurisdictions
- Monitor geopolitical developments affecting operations
- Assess competitor positioning and strategic moves
- Maintain relationships with policy experts and government officials
Scenario Planning and War-Gaming:
- Develop detailed scenarios for potential geopolitical shocks (new sanctions, conflict escalation, alliance shifts)
- War-game company responses with senior leadership quarterly
- Identify trigger points for pre-authorized decisions
- Maintain updated playbooks for rapid response
Strategic Coordination:
- Align business unit strategies with geopolitical realities
- Coordinate government relations across regions
- Manage trade-offs between efficiency and resilience
- Balance short-term costs of adaptation with long-term risk reduction
Capability Building:
- Develop internal expertise on key geographies and issues
- Build relationships with external experts and advisors
- Train leadership on geopolitical risk assessment
- Foster cultural awareness and sensitivity
Companies that invested in these capabilities earlier are now outperforming. According to Boston Consulting Group analysis, firms in the top quartile of geopolitical preparedness showed 3-5 percentage points higher return on invested capital during 2022-24 compared to bottom-quartile peers.
Three Strategies for Navigating the New Cooperation Paradigm
As global cooperation evolves, leaders in both public and private sectors must adapt their approaches. Three strategies emerge from the barometer’s findings:
1. Match Cooperation Format to Specific Issues
Not all challenges require universal, multilateral solutions. Leaders should strategically choose cooperation formats based on:
Issue Characteristics:
- Technical problems with clear solutions: Small expert groups (e.g., technology standards)
- Economic opportunities with aligned incentives: Bilateral or regional trade agreements
- Security challenges with geographic concentration: Regional organizations
- Global challenges requiring universal participation: Reformed multilateral institutions (climate, pandemics)
Partner Alignment:
- High alignment: Deep integration possible (single markets, currency unions, defense alliances)
- Moderate alignment: Issue-specific cooperation (trade agreements, technology partnerships)
- Low alignment: Transactional engagement (commodity trade, specific projects)
Time Sensitivity:
- Immediate crises: Ad hoc coalitions of capable and willing actors
- Medium-term challenges: Purpose-built minilateral partnerships
- Long-term systemic issues: Institutional frameworks with staying power
The key is strategic flexibility—maintaining participation in multiple cooperation formats simultaneously, activating different partnerships for different challenges.
2. Strengthen Resilience Through New Organizational Capabilities
Both governments and businesses must build capabilities to thrive in a more fragmented cooperation landscape:
For Governments:
Intelligence and Foresight:
- Establish forward-looking analytical units tracking cooperation trends
- Maintain comprehensive mapping of existing partnerships and potential new ones
- Develop scenario planning for different cooperation futures
Diplomatic Agility:
- Train diplomats in minilateral negotiation techniques
- Empower smaller negotiating teams with flexible mandates
- Build rapid response capacity for emerging cooperation opportunities
Policy Coordination:
- Break down silos between trade, security, climate, and health policy
- Recognize interconnections across cooperation domains
- Develop whole-of-government strategies for key relationships
For Businesses:
Geopolitical Intelligence:
- Build dedicated teams monitoring regulatory and political developments
- Develop early warning systems for cooperation disruptions
- Maintain networks of advisors across key geographies
Operational Flexibility:
- Design supply chains with multiple sourcing options
- Maintain manufacturing and service delivery capacity in multiple regions
- Develop rapid reconfiguration capabilities
Strategic Relationships:
- Cultivate relationships with policymakers in key markets
- Participate actively in industry associations and multi-stakeholder forums
- Build trust through consistent engagement, not just during crises
According to McKinsey & Company research, companies that systematically built these capabilities showed higher revenue growth (2-4 percentage points annually) and lower volatility (15-25% lower earnings variance) compared to peers during 2020-24.
3. Pursue Public-Private and Private-Private Coalitions
Cooperation need not flow only through governmental channels. Innovative partnership models can accelerate progress:
Public-Private Coalitions:
These partnerships leverage complementary strengths:
- Government: Convening power, regulatory authority, patient capital, long-term perspective
- Business: Technical expertise, operational efficiency, innovation capacity, private capital
Successful examples include:
Minerals Security Partnership:
- Governments and leading mining/manufacturing companies
- Objective: Accelerate critical mineral projects
- Approach: Coordinated investment and market-making
- Result: Pipeline of projects moving toward financial close
Coalition for Epidemic Preparedness Innovations (CEPI):
- Governments, foundations, pharmaceutical companies
- Objective: Accelerate vaccine development for emerging threats
- Approach: Coordinated R&D funding and manufacturing capacity
- Result: Rapid COVID-19 vaccine development and future preparedness
Private-Private Coalitions:
When public policy moves slowly, businesses can self-organize:
The Resilience Consortium (World Economic Forum/McKinsey):
- Brings together businesses’ agility, MDBs’ capital mobilization capacity
- Focus on building resilience in critical supply chains
- Enables rapid coordination without waiting for government action
Industry-Specific Standards Bodies:
- Technology companies collaborating on AI safety standards
- Pharmaceutical companies coordinating on pandemic preparedness
- Logistics companies optimizing supply chain resilience
According to World Economic Forum research, effective public-private partnerships share common characteristics:
- Clear governance: Defined roles, decision-making processes, accountability
- Aligned incentives: Structure ensuring all parties benefit from success
- Measurable objectives: Concrete targets and transparent progress tracking
- Risk sharing: Appropriate distribution of risks and rewards
- Long-term commitment: Patience through inevitable implementation challenges
Looking Ahead: Cooperation’s Future in 2026 and Beyond
As we move deeper into 2026, several trends deserve close attention:
Pressure Points to Watch
US Policy Direction:
- Tariff policies and their implementation affecting global trade flows
- Foreign aid levels impacting health and development cooperation
- Technology export controls shaping innovation ecosystems
- Immigration policies affecting talent mobility
China’s Strategic Choices:
- Economic opening or further self-reliance emphasis
- Technology cooperation with developing economies
- Belt and Road Initiative evolution
- Role in multilateral institutions
European Union Cohesion:
- Internal political dynamics affecting unity
- Defense spending and security cooperation expansion
- Industrial policy and subsidy competition
- Enlargement and neighborhood relations
Emerging Economy Agency:
- India’s positioning between major powers
- Gulf states’ technology and economic partnerships
- African regional integration progress
- Latin American trade and political alignments
Multilateral Institution Reform:
- UN Security Council reform discussions
- WTO dispute resolution restoration
- World Bank/IMF governance changes
- WHO funding and authority
Reasons for Measured Optimism
Despite significant challenges, several factors suggest cooperation’s resilience:
Economic Incentives Remain Strong:
- Global supply chains still deliver efficiency gains
- Cross-border investment creates wealth
- International students and workers enhance innovation
- Trade benefits consumers through lower prices and greater choice
Technology Enables New Forms:
- Digital platforms reduce coordination costs
- Data flows enable distributed collaboration
- Remote communication makes distance less relevant
- AI could enhance translation and cross-cultural understanding
Shared Challenges Demand Collective Action:
- Climate change affects all countries
- Pandemics ignore borders
- Cybersecurity threats require coordination
- Economic instability ripples globally
Pragmatic Leaders Understand Value:
- Surveys show majority recognize cooperation benefits
- Business leaders adapt strategies rather than retreat
- Diplomats seek creative solutions within constraints
- Civil society maintains cross-border networks
The Adaptation Imperative
The central message of the Global Cooperation Barometer 2026 is neither pessimistic nor naively optimistic. Instead, it offers a realistic assessment: cooperation is under pressure but adapting.
The question isn’t whether countries and organizations will cooperate—they will, because they must. The question is whether they’ll adapt quickly and effectively enough to address urgent challenges while managing tensions.
As Børge Brende of the World Economic Forum notes: “Cooperative approaches are vital for advancing corporate, national and global interests. The barometer finds that, in the face of strong headwinds, cooperation is still taking place, albeit in different forms than in the past.”
The path forward requires:
- Dialogue: Open, constructive engagement to identify common interests
- Flexibility: Willingness to try new cooperation formats and partnerships
- Pragmatism: Focus on tangible outcomes rather than ideological purity
- Patience: Recognition that building trust and achieving results takes time
- Innovation: Creative approaches to long-standing challenges
Conclusion: Cooperation Evolving, Not Collapsing
The 2026 Global Cooperation Barometer paints a nuanced picture of international collaboration in an era of geopolitical fragmentation. While traditional multilateral frameworks face unprecedented strain, cooperation persists and evolves through smaller, more flexible coalitions.
Across trade, technology, climate, health, and security—the five pillars of global cooperation—we see common patterns:
- Multilateral mechanisms declining but not disappearing entirely
- Regional and minilateral partnerships filling gaps with agile, interest-based cooperation
- Economic incentives continuing to drive collaboration where mutual benefits are clear
- Outcomes holding steady or improving in some areas, deteriorating in others
- Adaptability emerging as the key to navigating uncertainty
For business leaders, this environment demands new capabilities: geopolitical intelligence, supply chain flexibility, strategic relationship management, and scenario planning. Companies that proactively adapt can find opportunity in reconfiguration rather than merely managing decline.
For government officials and diplomats, success requires matching cooperation formats to specific challenges, building diverse partnership portfolios, and maintaining dialogue even—especially—with those with whom disagreement runs deep.
For all stakeholders, the fundamental truth remains: many of today’s most pressing challenges cannot be solved by any country or organization alone. Climate change, pandemic preparedness, economic prosperity, technological innovation, and peace all require cooperative effort.
The shape of that cooperation may look different from the post-World War II multilateral order. It may be more fragmented, more pragmatic, more selective about participants and more focused on concrete outcomes. But cooperation itself—the human capacity to work together toward shared goals—endures.
As we navigate 2026 and beyond, the barometer’s message is clear: cooperation isn’t dying. It’s evolving. And our collective ability to adapt will determine whether that evolution leads to a more resilient, prosperous, and peaceful world—or to continued fragmentation and missed opportunities.
The choice isn’t between cooperation and isolation. It’s between rigid adherence to fading frameworks and creative adaptation to new realities. The data suggests pragmatic optimism: cooperation is down but not out, strained but not shattered, adapting even as it’s tested.
In this era of transformation, the question each leader must answer is not “should we cooperate?” but “how shall we cooperate most effectively?” The Global Cooperation Barometer 2026 provides essential data for answering that question wisely.
Methodology Note: This article draws primarily from the World Economic Forum’s Global Cooperation Barometer 2026 Third Edition, produced in partnership with McKinsey & Company. All statistics are sourced from the report’s 41 tracked metrics unless otherwise noted. Additional reporting includes interviews with policy experts, analysis of supplementary data sources, and review of academic literature on international cooperation.
Discover more from The Economy
Subscribe to get the latest posts sent to your email.


Most headlines on Russia’s economy in July 2026 focus on the latest sanctions package or oil price cap negotiation. The more important story is structural: the model Russia has used to fund its war for four years is showing real signs of running out of road.
The core finding
A research brief from the Center for Strategic and International Studies (CSIS) argues Putin is pushing Russia toward an “economic, political, and military abyss,” according to Fortune. While Russia’s economy remains large — roughly $2.6 trillion — growth is slowing and shrinking on a quarterly basis, with 2026 growth projected at just 0.4%, worse than 2025’s 1% growth, which itself narrowly avoided recession.
Analysts describe Russia’s approach as a form of “military Keynesianism” — the state investing heavily in militarizing the economy while extending financial support to households affected by the war. But per Fortune’s reporting, “after more than four years of war, that well is running dry.” Russia’s fiscal reserves are dwindling, and 71% of the country’s gold reserves have been liquidated to sustain spending.
The number that matters most: oil and gas budget share
The most underreported data point here: the share of oil and gas receipts in Russia’s federal budget revenue fell to just 23% in 2025 — the lowest share in two decades — according to the Oxford Institute for Energy Studies, cited by Fortune. To compensate, Russia has turned to expansive taxation, including raising VAT from 20% to 22% — a move that has proven unpopular domestically.
This matters because Russia’s economy has historically been described, correctly, as fossil-fuel dependent — with oil and gas taxation making up 44% of federal revenues in the decade before the Ukraine invasion, and still around 24.5% over the first three quarters of 2025, according to a Brookings Institution analysis. A further slide to 23% signals the sanctions and diversification pressure are compounding, even as Russia continues finding workarounds through its “shadow fleet.”
The Iran-war reprieve was temporary — and it’s over
The Iran war offered Russia a brief lifeline: Brent crude surged more than 55% at its peak, nearing $120 a barrel, after President Trump eased some sanctions on Russian oil, per Fortune. But that chaos also undermined Russia’s own long-term energy and infrastructure projects in the Middle East — two Russian-linked power plants in Iran were put on hold, along with oil and gas exploration and plans to link Russia to India via Iran through new transit routes. Since then, oil prices have normalized as demand softened and the Strait of Hormuz reopened, removing that temporary cushion.
The sanctions escalation now in motion
The pressure is intensifying on multiple fronts simultaneously. US senators unveiled a sweeping bipartisan Russia sanctions bill in mid-July, which would impose mandatory sanctions on Russian political and military leaders including President Putin, and up to a 100% tariff on the top five countries — including China and India — that purchase Russian crude oil and natural gas, according to CNN. Separately, the EU has been racing to avoid an automatic upward revision of its Russian oil price cap, which would otherwise jump from $44.10 to roughly $58 per barrel if a new sanctions package wasn’t agreed by July 15, per Euronews.
Analysis from the Center for European Policy Analysis notes the outcome depends heavily on whether India and China accept the risk of secondary sanctions: “If China stands firm, Moscow’s dependence on Beijing deepens,” per CEPA. If Russian seaborne oil exports were to fall to near-zero, the budget would lose roughly a quarter of its revenue — an extreme but non-trivial scenario given the pace of legislative and diplomatic pressure building in July 2026.
Why this matters beyond Russia
For countries positioned between Western sanctions regimes and continued Russian energy purchases — including India, and by extension trade partners like Pakistan whose remittance and trade flows intersect with Gulf and South Asian energy markets — the trajectory of Russia’s budget dependency and the secondary-sanctions risk attached to its buyers is a live variable, not a settled one. A further deterioration in Russia’s oil-and-gas revenue share would likely accelerate Moscow’s reliance on China specifically, reshaping regional energy-trade alignments well beyond the Russia-Ukraine conflict itself.
FAQ
What percentage of Russia’s federal budget comes from oil and gas? 23% in 2025 — the lowest share in two decades, according to the Oxford Institute for Energy Studies.
What is Russia’s projected GDP growth for 2026? 0.4%, according to CSIS research cited by Fortune — down from 1% growth in 2025.
What is “military Keynesianism” in the context of Russia’s economy? A term analysts use to describe Russia’s strategy of heavy state investment in militarizing the economy alongside financial support for war-affected households, functioning as a form of stimulus that is now showing signs of fiscal strain.
Discover more from The Economy
Subscribe to get the latest posts sent to your email.

Russia‘s two largest, US-sanctioned oil producers have clawed back control of the majority of the country’s crude export trade, restoring their combined share to 57% in the first half of May 2026 after a sharp decline earlier in the year — a recovery that underscores the limits of Western sanctions enforcement even as the Middle East conflict reshapes global energy flows in Moscow’s favor.
According to the Kyiv School of Economics Institute‘s Russian Oil Tracker, sanctioned producers Rosneft, Lukoil, Gazpromneft, and Surgutneftegaz had seen their combined export share collapse to just 4-8% in the January-to-March period, only to rebound sharply as sanctioned “shadow fleet” tankers and previously idle vessels returned to commercial service, according to KSE Institute’s May 2026 tracker. The reversal illustrates a pattern that has recurred throughout the sanctions era: enforcement gaps open, capital and logistics networks adapt, and market share flows back toward sanctioned entities within a matter of months.
The Shadow Fleet’s Growing Dominance
The scale of Russia’s reliance on unconventional shipping infrastructure has reached a new high. KSE Institute estimates that 192 shadow fleet tankers carrying crude and refined products left Russian ports or engaged in ship-to-ship transfers in April 2026 alone, with 92% of those vessels older than 15 years — aging tonnage increasingly steered toward sanctions-evasion routes as newer, compliant vessels avoid the reputational and insurance risk of handling Russian crude.
The share of Russian seaborne oil transported by explicitly sanctioned tankers rose from 15% in July 2025 to 31% by April 2026, according to KSE data, while the corresponding share carried specifically by US-designated vessels reached 26% over the same window — driven, according to the tracker, by previously idle tankers returning to active commercial rotation. As of May 21, six major sanctioning jurisdictions — the US, UK, EU, Australia, Canada, and New Zealand — had jointly designated 651 unique oil tankers, yet the fleet supporting Russian exports has continued to expand around those designations rather than shrink beneath them.
Separately, monthly analysis from the Centre for Research on Energy and Clean Air (CREA) found that in April 2026, over half — 54% — of Russia’s seaborne oil moved via sanctioned shadow tankers, up sharply from 48% in March, with sanctioned vessels responsible for the highest share of Russian fossil fuel exports on record, according to CREA’s April 2026 monthly tracker.
Revenue Keeps Climbing Despite the Sanctions Architecture
The financial consequence of this logistics resilience is a fossil fuel export revenue stream that has continued growing even as enforcement pressure has, on paper, intensified. Russia’s fossil fuel export revenues rose 2% month-on-month to €726 million per day in May 2026, according to CREA’s most recent analysis, despite export volumes remaining broadly flat. Crude oil export revenues specifically grew 1% to €362 million per day, with volumes up 8% — evidence that Russia is finding new efficiencies in its export logistics even as the headline sanctions regime tightens.
KSE Institute’s revenue modeling, updated in light of the Middle East conflict, now projects that Russia’s total oil revenue could climb from $158 billion in 2025 to $208 billion in 2026 under a base-case scenario assuming current price caps and a conflict lasting up to three months. Under an adverse scenario involving weak sanctions enforcement, that figure could reach $214 billion — meaning even the coalition’s most pessimistic enforcement scenario still implies rising, not falling, Russian oil revenue for the year.
Pricing dynamics tell a related story. Russia’s benchmark Urals crude rose 19% month-on-month in April 2026 to $112.30 per barrel — more than double the $44.10 EU and UK price cap that took effect on February 1, 2026 — before easing 12% in May to $82.02 per barrel, still nearly double the cap, according to CREA’s tracking data. The price cap, designed explicitly to constrain Russian per-barrel revenue while keeping global oil supply flowing, has functioned as a floor for insurance and freight compliance rather than an effective revenue ceiling during periods of tight global supply.
Third-Country Refineries Remain a Persistent Loophole
Refineries in India, Türkiye, Brunei, and Georgia running on Russian crude exported €641 million worth of oil products to sanctioning countries in May 2026 alone, according to CREA, including shipments to the EU, Australia, the US, and New Zealand — jurisdictions that have formally banned direct imports of Russian crude but continue receiving refined products derived from that same crude once it has passed through a third-country refinery. Georgia’s Kulevi refinery has run entirely on Russian crude for months without receiving a single shipment of non-Russian oil, despite its operating company publicly stating an intent to diversify — and despite narrowly avoiding inclusion on the EU’s sanctions list in March.
The EU closed one version of this loophole through its 18th sanctions package in January 2026, banning oil products refined from Russian crude in third countries from entering the bloc, according to analysis from the Center for European Policy Analysis (CEPA). Yet the persistence of flows through Kulevi and similar facilities illustrates how quickly new evasion routes emerge once established ones are formally closed — a pattern sanctions researchers describe as a continuous cat-and-mouse dynamic rather than a one-time enforcement fix.
What the Data Means for the Broader Sanctions Debate
Since Russia’s full-scale invasion of Ukraine, sanctions imposed by the UK, US, and EU are estimated to have denied Russia access to more than $450 billion, according to CEPA’s analysis — a substantial figure that nonetheless coexists with the reality that Russia’s oil exports since February 2022 have generated more than $800 billion in revenue through April 2026, according to CREA data cited in the same CEPA report. Those two figures, both accurate, capture the fundamental tension at the heart of Western sanctions policy: meaningful financial damage has been inflicted, but Russia’s core oil revenue engine has continued operating at a scale sufficient to sustain its war economy.
For markets and policymakers tracking global oil supply through the remainder of 2026, the practical implication is that Russian barrels — whether transported via shadow fleet, laundered through third-country refineries, or shipped directly by re-empowered sanctioned majors — remain a structurally embedded part of global crude supply, with enforcement gaps proving durable enough that even renewed sanctions packages have thus far failed to meaningfully compress Russia’s oil-derived war financing.
Discover more from The Economy
Subscribe to get the latest posts sent to your email.
Analysis
Turkey’s Bid for Middle East Leadership: How Ankara Is Filling the Vacuum Left by Iran’s Weakening
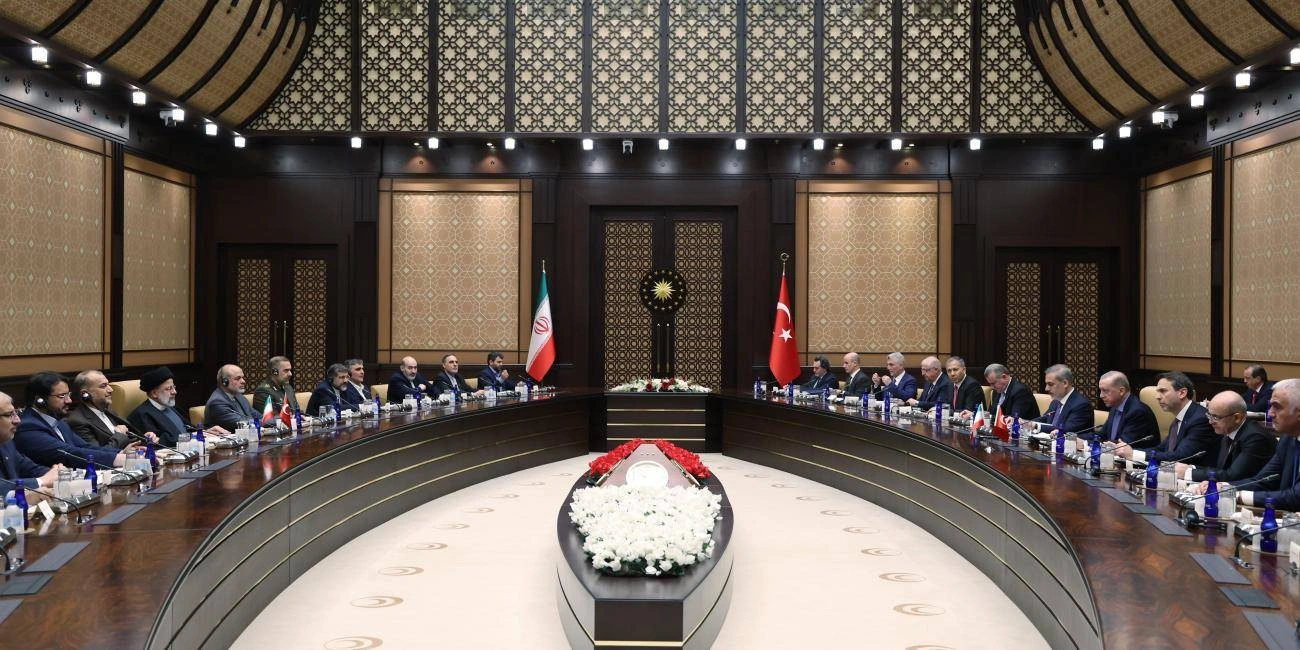
When the United States and Israel struck Iran in February 2026, they did not merely launch a war. They created a strategic vacuum. Iran — the dominant non-Arab power in the Middle East and the linchpin of the “Axis of Resistance” — was degraded, isolated, and forced into ceasefire negotiations. The question immediately arising for regional analysts: who fills the space?
The answer, increasingly, is Turkey.
Erdoğan’s Strategic Moment
Brookings scholar Aslı Aydıntaşbaş examines Turkey’s evolving role as it searches for influence in a Middle East undergoing fundamental transformation, prompted in equal parts by the Iran war and shifting U.S. commitments.
Turkey enters this moment with unusual strategic assets: it is a NATO member with deep ties to both the West and the Islamic world; it has the second-largest military in the alliance; it has cultivated relationships with Hamas, the Muslim Brotherhood, Qatar, and various Gulf states; and it is the host of the July 2026 NATO summit — placing President Erdoğan at the center of the most consequential alliance gathering in years.
The Islamabad Memorandum and Ankara’s Role
Turkey played a quiet but important role in the Iran ceasefire diplomacy. Pakistan served as the primary mediator — hence “Islamabad Memorandum” — but Turkish diplomatic channels contributed to the broader regional framework. This positioning as a constructive regional broker, distinct from both the U.S.-Israel axis and the Iran-led resistance bloc, is central to Erdoğan’s strategic calculus.
As Hezbollah is weakened and Hamas isolated, as Iran negotiates from a position of damage rather than strength, and as the Gulf states recalibrate toward Washington — Turkey is positioning itself as the indispensable interlocutor between competing regional forces.
The NATO Summit Leverage
Hosting the Ankara summit gives Turkey unusual leverage. The July 7–8 summit in Ankara will focus heavily on allies spending on European and Arctic security, as well as the need to vastly increase defense production.
But the summit’s subtext is about Turkey’s own strategic agenda: sustaining arms purchases outside of U.S. conditionality, maintaining relations with both Ukraine and Russia, and extracting concessions from NATO partners on matters ranging from Kurdish groups to EU accession.
Erdoğan has proven adept at using NATO summits as negotiating platforms. Ankara 2026 will be no different.
The Iran War’s Regional Reordering
The 2026 Iran war has fundamentally altered the regional power balance in ways that benefit Ankara. Hezbollah — Iran’s most powerful proxy — has been severely degraded by Israeli operations. The Houthis have been weakened. Hamas is isolated. Iran itself is in ceasefire negotiations.
The “Axis of Resistance,” as a coherent strategic instrument of Iranian foreign policy, has been severely damaged. The architecture of Iranian regional influence, built over four decades, is being reconstructed — and Turkey intends to ensure its influence grows in the reconstruction phase.
The Limits of Turkish Ambition
Turkey’s regional ambitions face real constraints. Its economy has been strained by years of inflation and currency volatility. Its relationship with the EU remains frozen. Its ties with Egypt, Saudi Arabia, and the UAE — which have normalized in recent years — could fray if Ankara overplays its hand.
Moreover, Turkey must navigate a NATO summit at which Trump is furious with European allies for their Iran stance — yet Turkey itself declined to actively support U.S. operations. Managing that contradiction requires considerable diplomatic dexterity.
The Middle East is undergoing a fundamental transformation, one prompted in equal parts by the Iran war and shifting U.S. commitments — and Turkey is positioning itself to shape that transformation rather than merely react to it.
Conclusion: The Ankara Moment
The 2026 Iran war may ultimately be remembered not only for what it did to Iran, but for what it enabled in Turkey. If Erdoğan manages the NATO summit effectively, deepens Turkey’s regional broker role, and maintains its strategic ambiguity between East and West — Ankara could emerge from 2026 as the most consequential player in the new Middle East order.
That prospect will be welcomed by some, feared by others, and watched closely by all.
Discover more from The Economy
Subscribe to get the latest posts sent to your email.

Canada Trade Diversification 2026: China, Indonesia, UAE Deals Explained

US Forced-Labour Tariffs on 60 Countries: The Hidden Trade Shock of 2026

Global Central Banks 2026: Fed, BoE and BoJ Decisions Could Reshape Markets

Gulf Capital Retreat From Pakistan 2026: UAE Loan Freeze & What It Means

Pakistan’s Most Reliable Export Is Its People: Remittances Hit $41.6 Billion, Overtaking Total Exports

Indonesia’s Confidence Problem: Record Investment, a Sinking Rupiah, and a Widening Credibility Gap

Down But Not Out: Inside the Slow Sinking of Russia’s War Economy

China’s Growth Slips to a Four-Year Low: Why Beijing Still Won’t Pull the Stimulus Trigger

The Johor-Singapore Corridor: How Malaysia Became Southeast Asia’s AI Infrastructure Powerhouse

Canada’s Economy ‘On Pause’: Inside the CUSMA Deadline That Passed Without a Deal

Dubai’s Millionaire Magnet: How the UAE Turned Middle East Turmoil Into a Capital Safe-Haven Boom

Britain’s Sixth Prime Minister in a Decade: What Starmer’s Exit Means for Gilts, Sterling and Your Portfolio

Anthropic Offers Up to $600,000 Salary for Critical IPO Role as AI Giant Prepares for Wall Street Debut

EU Readies Crisis Team for Potential China Rare Earths Stand-Off as Supply Chain Risks Mount

Carry Trade Unwind 2026: How the Yen’s Snapback Triggered a Global Margin Call

AI Bubble Warning 2026: Why BIS, IMF and Bank of England Fear a Market Crash

BRICS De‑Dollarization Strategy Takes Shape with $15 Billion Local‑Currency Push

The AI Super Bubble Is Ready to Burst

Russia Bans Diesel Exports 2026: Global Fuel Market Impact Explained

Strait of Hormuz Blockade 2026: Oil Prices Surge 9% as US-Iran Conflict Reignites

Private Credit Warning: Most BDCs Turn Unprofitable in 2026, Reuters Finds

IMF Cuts Pakistan Growth Forecast, Raises Inflation to 8.4%

Bitcoin $150k Milestone Achieved as US Sovereign Crypto Pivot Looms
Gulf Capital Retreat From Pakistan 2026: UAE Loan Freeze & What It Means

India Economic Rise 2026: How the Subcontinent Toppled Japan

Strait of Hormuz 2026: Why Markets Still Don’t Trust It’s Open

Argentina Economy 2026: Milei’s Fiscal Surplus, Inflation Drop to 29%, and What Comes Next

China Housing Market Turnaround: White‑List Model Stabilises Prices
-

 Markets & Finance7 months ago
Top 15 Stocks for Investment in 2026 in PSX: Your Complete Guide to Pakistan’s Best Investment Opportunities
-

 Analysis5 months ago
Johor’s Investment Boom: The Hidden Costs Behind Malaysia’s Most Ambitious Economic Surge
-

 Analysis5 months ago
Top 10 Stocks for Investment in PSX for Quick Returns in 2026
-

 Analysis6 months ago
Brazil’s Rare Earth Race: US, EU, and China Compete for Critical Minerals as Tensions Rise
-

 Banks6 months ago
Best Investments in Pakistan 2026: Top 10 Low-Price Shares and Long-Term Picks for the PSX
-

 Investment7 months ago
Top 10 Mutual Fund Managers in Pakistan for Investment in 2026: A Comprehensive Guide for Optimal Returns
-

 Global Economy7 months ago
15 Most Lucrative Sectors for Investment in Pakistan: A 2025 Data-Driven Analysis
-

 Global Economy7 months ago
Pakistan’s Export Goldmine: 10 Game-Changing Markets Where Pakistani Businesses Are Winning Big in 2025