
Analysis
Why Distressed-Debt Funds See a Once-in-a-Generation Bet in Private Credit’s Unraveling

Distressed-debt funds are targeting the $2 trillion private credit downturn as the greatest opportunity since 2008. Here’s what’s fueling the frenzy — and the risks ahead.
The Smell of Distress in the Morning
Picture a room in midtown Manhattan in early March 2026. A portfolio manager at one of the world’s largest credit funds is on the phone, not to his prime broker or his LPs, but to a lawyer specialising in debt restructuring. On his screen: a blinking alert from Bloomberg showing that Blue Owl Capital’s flagship retail lending vehicle has permanently shuttered its redemption window after withdrawal requests surged past 15% of net asset value — three times the quarterly cap it once guaranteed investors. Around him, colleagues are tracking similar red flags at Blackstone, Ares, BlackRock, and Morgan Stanley. The room is tense. But beneath that tension, for a certain class of investor, there is something else: barely suppressed excitement.
The $2 trillion private credit market is in distress. And the funds that specialise in buying broken debt at broken prices — the so-called vulture investors who made fortunes in the wreckage of 2008 — are sharpening their talons.
A Golden Era That Became a Gilded Cage
To understand why distressed specialists are salivating today, you need to trace the improbable arc of private credit since the global financial crisis. Burned by the carnage of 2008, regulators tightened capital requirements on banks through Basel III, effectively driving them out of mid-market corporate lending. Into that vacuum stepped a new class of non-bank lenders: direct lending funds operated by firms like Apollo, Ares, Blackstone, Blue Owl, and KKR. Private credit entered 2026 as a near-$3 trillion asset class, having grown fivefold since the post-GFC era, with institutional investors — pensions, sovereign wealth funds, insurers, and family offices — piling in for the promise of floating-rate income and low volatility. Withintelligence
The pitch was elegant: private loans, unlike publicly traded bonds, were not marked to market daily. Defaults, when they occurred, were resolved quietly in bilateral negotiations between lender and sponsor, without the messy spectacle of public-market repricing. For a decade of near-zero rates and robust corporate earnings, this model was close to frictionless. Money poured in. Funds raced to deploy it. Covenants became “covenant-lite.” Leverage multiples crept upward. And in the most competitive corners of the market — particularly software and technology — loan structures that once would have drawn a raised eyebrow became standard.
Then came higher-for-longer rates, agentic AI threatening SaaS business models, and a cohort of retail investors who, lured by quarterly liquidity promises, discovered that private credit’s “semi-liquid” label was doing an awful lot of work.
The Anatomy of a Squeeze
By late 2025, Fitch Ratings reported private credit defaults surging toward historic highs, with risks concentrated in highly leveraged, rate-sensitive debt — particularly among software names and smaller borrowers — as “shadow defaults” and “amend-and-pretend” arrangements masked the true depth of corporate stress. CNBC Payment-in-kind toggle usage — whereby borrowers pay interest in additional debt rather than cash — accelerated alarmingly. Research from S&P Global Intelligence found that “selective defaults,” covering covenant waivers, distressed debt exchanges, and out-of-court restructurings tantamount to default, outpaced conventional defaults five to one in 2024, pointing to elevated stress levels that headline figures failed to reveal. Debt Explorer
The fault lines cracked fully open in Q1 2026. Blue Owl’s technology-focused fund saw redemption requests jump to approximately 15% of net asset value — triple its quarterly cap — forcing the firm into a capital-return plan. At Blackstone, investors sought to pull $3.8 billion from its flagship BCRED fund, representing 7.9% of assets, prompting the firm to take the extraordinary step of deploying $400 million of its own capital to satisfy requests. BlackRock restricted withdrawals on its $26 billion HPS Lending Fund after requests reached 9.3%, nearly double its cap. Morgan Stanley returned $169 million to investors after repurchase requests topped 10.9% in its North Haven Private Income fund. Wealth Management
Redemption requests from investors in retail-focused private credit funds reached an all-time high, as fund managers faced an acute dilemma: relax liquidity caps to satisfy investors and risk compromising portfolio value, or hold the line and gate redemptions, alienating capital and sending a distress signal to the wider market. Morningstar
The mechanism underlying the panic is a classic liquidity mismatch — structurally identical to what economists call a “bank run,” even if private credit funds lack deposit insurance. Loans originated over five-year terms were packaged into vehicles promising quarterly exits. When sentiment soured, the gap between asset duration and liability terms became a chasm.
Enter the Opportunists
This is precisely the moment distressed-debt specialists have been waiting for. The strategy is as old as capitalism itself: buy assets that someone else must sell at prices that do not reflect long-term value. What is different today is the scale, the complexity, and the particular texture of the opportunity.
Opportunistic, special-situations, and distressed-debt funds have collectively raised over $100 billion in the past two years, while the ten largest funds currently in the market are targeting almost $50 billion — suggesting that fund managers and allocators are deliberately building war chests in anticipation of a credit cycle turning point. Withintelligence
The opportunity manifests in several forms. First and most immediately, there are forced-seller dynamics among semi-liquid retail funds. As firms like Blue Owl sold high-quality loan portfolios to meet redemption demands, buyers were able to acquire par-value assets at discounts from forced sellers — exactly the asymmetric entry point that distressed specialists seek. FinancialContent Boaz Weinstein’s Saba Capital, the New York-based credit hedge fund, reportedly launched a dedicated vehicle to acquire Blue Owl fund stakes at discounts of up to 35% to stated NAV — an act that serves simultaneously as arbitrage trade and implicit verdict on the credibility of private credit valuations.
Second, there is a growing pipeline of genuinely impaired corporate debt. Attention has focused on software exposure in direct lending — estimated at around 26% by Morgan Stanley — following fears that agentic AI could disrupt traditional software-as-a-service business models. Funds concentrated in volatile sectors or holding covenant-lite loans are also vulnerable, as are highly leveraged healthcare roll-ups. CNBC As these businesses deteriorate, their loans will trade into distressed territory — not at fire-sale prices, but at discounts that reward patient, analytical capital.
Third, and perhaps most structurally interesting, there is the opportunity in mezzanine and subordinated debt. Analysis from MSCI shows that from 2020 to 2025, loan losses in the riskier portions of the capital stack were substantial, with these losses by debt funds indicating precisely where distress opportunities can be found in this cycle. Mezzanine lenders, through their interests in the LLCs that control underlying assets, gain meaningful control rights upon default — allowing them to influence outcomes more directly than in prior cycles. MSCI
Is This Really 2008 Redux?
The comparison to 2008 is both instructive and misleading, and the honest analyst must hold both truths simultaneously.
The similarities are structural. A decade-long credit expansion, enabled by regulatory arbitrage, compressed risk premia, and institutional herding, is unwinding in an environment where the exit doors are narrower than many investors assumed. The leverage is real. The opacity is real. The mispricing was real.
But the differences are material. Private credit funds are generally less leveraged today than the investment banks caught up in the 2008 crash, and the fundamental distinction is that 2008 involved significant leverage on similar assets with full recourse to whoever owned them. CNBC The damage, in other words, is likely to be more contained — painful for those who hold impaired loans or mispriced semi-liquid structures, but unlikely to produce the systemic contagion that froze interbank lending and triggered a global recession.
Historical comparison bears this out. Distressed assets reached 20% of total sales by late 2010, three years after the GFC began. Through mid-2025, distressed transactions had reached only 3% of market share, and while prices fell sharply during the GFC — dropping 23% year-over-year by Q3 2009 — the maximum decline in this cycle was approximately 10%, following the 2022 rate shock. MSCI The distressed opportunity in 2026, while significant, is more surgical than it was systemic seventeen years ago. It rewards specialists over generalists.
There is also the question of geography. As European countries ramp up infrastructure and defense spending, fund managers such as Apollo Global Management and Ares Management have cited a substantial origination opportunity on the continent, and as Europe implements Basel IV, a major shift is expected away from bank lending — currently around 70% of total European lending — toward private debt funds. Withintelligence For distressed specialists with European capabilities, the continent offers a second, distinct wave of opportunity driven by the refinancing stress on COVID-era leveraged borrowers.
The Risk the Bulls Ignore
No analysis of this moment is honest without confronting what could go wrong for the distressed buyers themselves.
The core risk is one of timing and depth. Distressed debt generates its finest returns when dislocation is sharp and recovery is swift. But if the private credit correction is slow and grinding — a multi-year unwinding of mismarked loans through a succession of quiet restructurings — then the entry points for opportunistic capital may remain frustratingly inaccessible. The “amend-and-pretend” culture that has characterised private credit through this cycle, whereby sponsors and lenders quietly extend and modify rather than formally default, is a feature, not a bug, of a relationship-driven market. It delays the forced selling that distressed funds need to deploy capital at their target returns.
There is also the risk of contamination: that distressed funds buying impaired loans discover that the marks from which they calculated their discounts were themselves inflated. Saba Capital’s willingness to purchase Blue Owl fund stakes at discounts of up to 35% to stated NAV signalled deep scepticism toward the valuations provided by private lenders FinancialContent — and if those doubts prove warranted at scale, the “discount” entry could still prove expensive.
Finally, there is regulatory risk. Policymakers on both sides of the Atlantic are watching the private credit dislocation closely. The Financial Stability Board, the IMF, and national regulators have long flagged concerns about liquidity mismatch in semi-liquid private fund structures. A forced structural reform — mandating longer lock-up periods, higher liquidity buffers, or independent third-party valuations — could alter the playing field in ways that compress both distressed opportunities and the broader market’s return profile.
What Comes Next
The credit cycle, like all economic cycles, does not unfold on a schedule. But the directional logic is clear: the great private credit expansion of the post-2008 era is entering a period of reckoning, and the reckoning will produce both casualties and fortunes.
For institutional allocators, the question is not whether to engage with the distressed opportunity, but how. Distressed strategies can deliver IRRs in the low teens or better, but returns come with greater complexity — including legal, restructuring, and timing risk — and outcomes are highly manager-skill dependent. Globalbankingmarkets A satellite allocation to a handful of deeply experienced distressed specialists, positioned alongside a diversified core private credit book, is likely the appropriate response for most large institutional portfolios. Concentration in any single vintage or geography would be imprudent.
For the broader economy, the unwinding has a silver lining. A spike in loan defaults, while painful for existing holders, will ultimately clear misallocated capital, restore pricing discipline to new loan issuance, and bring private credit valuations back into line with reality. One senior credit officer described it as a “healthy reset” — a stress test the market needed to take but had been deferring for years.
The vultures circling private credit in 2026 are not predators in the pejorative sense. They are a mechanism of price discovery, a corrective force, and, for those with the capital and patience to engage them, a potential source of the vintage returns that are minted only at moments of genuine dislocation. The greatest private credit opportunity since 2008, it turns out, may not be in lending. It may be in the ruins of what lending became.
Discover more from The Economy
Subscribe to get the latest posts sent to your email.


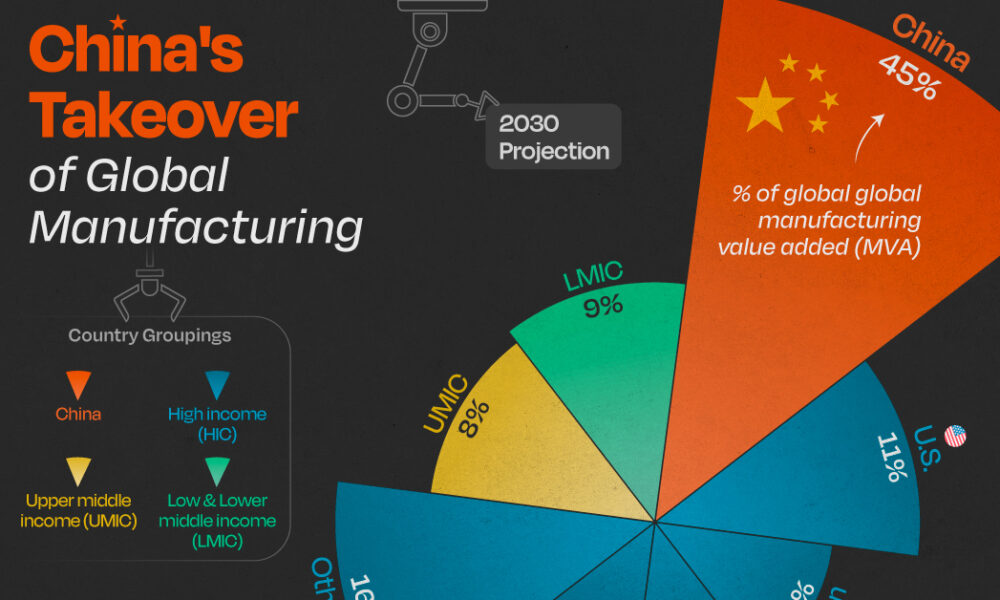
China’s exports have been the good-news story in an otherwise mixed economic picture. They’re not just holding up; through the first four months of 2026 they were running about 14% to 15% above the same period a year earlier, according to figures cited by the US-China Economic and Security Review Commission and Vanguard’s economic outlook. That’s the kind of number that would normally signal a healthy economy. The complication is what’s happening underneath it.
A growth model showing its age
Manufacturing capacity utilization fell to 73.9% in early 2026 — near a decade low outside of the pandemic shutdowns, per the Commission’s bulletin. That’s the tell. China is producing and shipping more, but a growing share of its industrial base is running under capacity, which points to a structural mismatch: the country’s manufacturing engine has outgrown both its domestic consumption and, increasingly, what the rest of the world is willing to absorb without pushback.
Goldman Sachs Research, in a report cited by Goldman Sachs’ own analysis, forecasts 4.8% real GDP growth for 2026 — above consensus expectations of 4.5% — driven substantially by continued export strength and a softening drag from the property downturn. But that same report flags the labor market as a genuine weak spot: hiring, measured across a weighted average of PMI employment sub-indexes, is at its most depressed level in a decade outside Covid, and urban nominal wage growth slowed to just 3.8% year-on-year in Q3 2025.
Why Beijing isn’t reaching for stimulus
Given the export strength, one might expect policymakers to feel less urgency about consumption-side stimulus. That’s roughly what’s happening — and it’s a deliberate choice, not an oversight. Xi Jinping’s government remains committed to dominating high-value manufacturing, which means comprehensive fiscal stimulus aimed at consumers remains unlikely even as domestic demand stays soft, according to the Commission’s bulletin.
The People’s Bank of China is expected to hold its policy rate steady through the rest of the year, preferring targeted structural tools over a broad-based rate cut, per Vanguard’s forecast. That’s a notably cautious stance given how weak the property sector remains — property investment indicators are down 50% to 80% from their 2020–21 peaks, and a “meaningful domestic-demand turnaround remains elusive,” in Vanguard’s own words.
The regulatory push to keep capital at home
Two moves by Chinese regulators in mid-2026 point to where Beijing’s real priority sits: keeping household savings and private capital funneled toward domestic industrial policy rather than flowing overseas. New rules taking effect July 1 restrict outbound investment that could be used to export restricted technology or expertise under the guise of ordinary capital flows, with violations carrying fines, visa restrictions and industry blacklisting, according to the Commission’s bulletin. The regulations follow Beijing’s move to block the founders of AI firm Manus from completing a sale to Meta, even after the company had relocated its headquarters from China to Singapore — a signal that Beijing is willing to reach across borders to keep promising tech assets tethered to domestic or Hong Kong listings.
The currency and trade angle
Goldman’s team makes an out-of-consensus call worth flagging: it expects China’s current account surplus to rise to 4.2% of GDP in 2026, up from 3.6% in 2025, while the broader analyst consensus surveyed by Bloomberg expects a decline to 2.5%. The divergence comes down to export resilience — falling export prices are making Chinese goods more competitive even as the yuan is expected to appreciate slightly, with export-price inflation in dollar terms forecast to turn positive, rising to 0.7% from -2.7% the prior year.
The bottom line
China’s economy in 2026 is a study in contrasts: robust headline export growth sitting on top of underutilized factories, a weak labor market, and a property sector still in its fifth year of decline. The World Bank’s own baseline, published in its country program materials, projects growth moderating toward 4.0% by 2026 — a more conservative read than Goldman’s. Either way, the consensus across forecasters is the same: exports are carrying more of China’s growth than is healthy for the long run, and Beijing’s policy choices this year suggest it’s betting on technological dominance to eventually solve the demand problem, rather than opening the stimulus taps to solve it directly.
Discover more from The Economy
Subscribe to get the latest posts sent to your email.
There’s a number that keeps showing up in every conversation about Pakistan’s economy, and it keeps getting bigger: circular debt. As of early July 2026, the gas sector’s share of that debt alone has topped Rs 3.44 trillion, and Islamabad has missed a deadline the IMF set for tariff reforms meant to arrest the slide, according to Dawn.
What circular debt actually is, and why it won’t go away
Circular debt is the chain of unpaid obligations that builds up when the price consumers pay for electricity or gas doesn’t cover what it actually costs to produce and deliver it. Someone in the chain — a power producer, a gas utility, a state-owned enterprise — ends up carrying an IOU, and that IOU gets passed down the line. Earlier this year, IMF officials pressed Pakistan on exactly this dynamic, questioning the government’s plan to zero out gas-sector circular debt, according to Aaj English. At the time, officials said around Rs 150 billion remained payable to companies including Oil and Gas Development Company Limited and Pakistan Petroleum Limited.
Islamabad’s proposed fix included a Rs 5-per-unit levy on gas, dividends from state-owned companies redirected toward debt reduction, and the sale of 35 LNG cargoes annually on the international market. The IMF, per that same reporting, raised pointed questions about whether the plan was actually viable.
The commitments Pakistan has already made
Under its Extended Fund Facility, Pakistan has committed to capping circular debt growth at Rs 300 billion for FY2027 and cutting power-sector subsidies from 0.7% of GDP to 0.6%, according to details reported by ProPakistani. The government has also shifted Nepra’s annual tariff-rebasing cycle from July to January, and Ogra now revises gas tariffs twice a year instead of once.
Structurally, some of this is working. The IMF’s own review in May 2026 credited Pakistan with a primary fiscal surplus of 1.6% of GDP for FY26, broadly in line with program targets, and noted gross reserves had climbed to $16 billion by end-December, up from $14.5 billion six months earlier, according to the IMF’s own press release. That progress unlocked roughly $1.1 billion under the EFF and $220 million under a parallel climate-resilience facility, bringing total disbursements under the two arrangements to about $4.8 billion.
Where the fault lines actually are
The uncomfortable part of this story, laid out by commentary reported in The Hans India, is that revenue targets get IMF scrutiny with great precision, while structural reform of loss-making public enterprises — Pakistan International Airlines and Pakistan Steel Mills chief among them — moves far more slowly. Those enterprises’ losses are absorbed by the national exchequer through subsidies, guarantees, and debt restructuring year after year, and privatization plans keep slipping because the political cost of confronting them is high.
Distribution company inefficiency compounds the problem. In FY25, Discos posted Rs 265 billion in losses, an improvement on FY24’s Rs 276 billion but still a substantial drag, according to Geo News, with Quetta, Peshawar and Hyderabad among the worst-performing utilities.
What happens if the pattern holds
Pakistan’s debt-to-GDP ratio sits between 70% and 80% as of 2026, according to Wikipedia’s economic summary, with debt servicing occasionally consuming two-thirds of government spending. That’s the backdrop against which every circular-debt conversation happens: there is very little fiscal room left to absorb another missed deadline.
The missed gas tariff deadline doesn’t automatically trigger a program breakdown — Pakistan has weathered similar friction points before during its current EFF arrangement. But with the IMF’s own documentation showing persistent concern about the credibility of debt-reduction plans, and with global energy prices still elevated in the aftermath of the Iran war, the margin for further slippage is thin. The next review will likely hinge less on the rhetoric around reform and more on whether the Rs 5 levy and LNG cargo sales actually show up in the numbers.
Discover more from The Economy
Subscribe to get the latest posts sent to your email.
Analysis
Malaysia Bets Its 2026 on “Execution” — And the Semiconductor Upcycle Is Doing the Heavy Lifting

Malaysia’s government has declared 2026 a year of “execution” and “discipline” as the Anwar Ibrahim administration races to deliver on the 13th Malaysia Plan (RMK13) ahead of elections that could come as early as February 2028, according to Fortune’s interview with economy minister Akmal Nasrullah Mohd Nasir.
A Strong Base to Build From
Malaysia’s economy grew 4.9% in 2025 following 5.1% growth the year before, with unemployment falling to 2.9% — the lowest in a decade — and the ringgit trading at its strongest level in five years. HSBC’s ASEAN economist Yun Liu forecasts 4.6% growth for 2026, citing strength in electrical equipment manufacturing, tourism, and sound government policy, while Nomura economists have projected an even more bullish 5.2%, pointing to infrastructure spending under RMK13.
The ASEAN+3 Macroeconomic Research Office (AMRO) projects growth moderating slightly to 4.6% from an estimated 4.9% in 2025, describing Malaysia’s performance as reflecting its “entrenched position in global semiconductor and electronics value chains” and the broader global tech upcycle, according to AMRO’s assessment of Malaysia’s investment upcycle.
Navigating Washington Without Picking Sides
Malaysia’s trade relationship with the US has been turbulent. Washington imposed 25% tariffs on Malaysian goods in April 2025, rattling the country’s export-led economy, before a deal reduced US duties to 19% in exchange for Malaysia lowering tariffs on select American products, with exemptions carved out for aviation components and electrical equipment. Malaysia’s trade hit a record high of more than 3 trillion ringgit (roughly $780 billion) last year despite the friction.
Deputy finance minister Liew Chin Tong has framed Malaysia’s positioning explicitly around neutrality: the country is “not China, not the US,” a stance he argues gives Malaysia a strategic advantage in both geopolitical and supply-chain terms, according to Fortune’s reporting from the Forum Ekonomi Malaysia summit.
Capital Is Flowing In — From Everywhere
Malaysia recorded 22.8 billion ringgit (about $5.8 billion) in foreign direct investment in the first quarter of 2026, a 6.0% year-on-year increase, moderating from the prior quarter’s 48.7% surge. Inflows into information and communication technology services remained particularly strong, with China, Hong Kong, and Singapore serving as the primary capital sources, according to McKinsey’s Southeast Asia quarterly economic review. Bank Negara Malaysia has held its policy rate steady following a pre-emptive 25 basis-point cut in July 2025, with headline inflation projected to average just 2.0% in 2026.
The Long Game: Semiconductors, Rare Earths, and Nuclear Power
Beyond RMK13’s near-term targets, Malaysian officials are positioning the country’s industrial strategy around decades, not years. Minister Akmal has reiterated commitments to eliminate coal use by 2044 and reach net zero by 2050, while confirming Malaysia is actively “exploring the potential” of nuclear power to meet the energy demands of its expanding data-center and semiconductor sectors. AMRO’s structural policy guidance urges Malaysia to develop domestic semiconductor and rare-earth capabilities as a hedge against ongoing US-China “geoeconomic fracturing,” positioning the country as a trusted neutral hub for global manufacturers diversifying away from concentrated exposure to either superpower.
Discover more from The Economy
Subscribe to get the latest posts sent to your email.

China Economy 2026: Export Growth Masks Manufacturing Overcapacity

Pakistan Iran-US Ceasefire Mediation 2026: Diplomatic Gains, Economic Risks

Pakistan Circular Debt Crisis 2026: IMF Deadline Missed, Rs 3.44 Trillion

Indonesia Russian Oil Imports 2026: Why Jakarta Is Diversifying Crude Supply

Russia Bans Diesel Exports 2026: Global Fuel Market Impact Explained

Gulf Sovereign Wealth Funds Hit Record $53.9B in H1 2026 Despite Iran War

America’s Workers Are Vanishing From the Labor Force — And It’s Not the Usual Reasons

ASEAN+3 Enters 2026 From a Position of Strength — But Two Storms Are Building Offshore

US Tariff Investigation 2026: 60 Countries, Forced Labor Claims and the EU Trade Fight

UK Digital Identity Framework 2026: The £5bn Plan to Reshape Financial Verification

The Money Is Drying Up: How US Pressure Is Choking Off Russia-China Payment Channels

Indonesia GDP Growth 2026: 5.61% Expansion Marks Fastest Pace in Three Years

Singapore Makes Its Move to Become Asia’s Precious-Metals Capital

Malaysia Bets Its 2026 on “Execution” — And the Semiconductor Upcycle Is Doing the Heavy Lifting

Top 20 PSX Stocks for Investment in 2027: Your Complete Guide to Pakistan’s Best Investment Opportunities

Investors Pile Into Bullish Dollar Bets as ‘US Exceptionalism’ Trade Returns

Carry Trade Unwind 2026: How the Yen’s Snapback Triggered a Global Margin Call

Pakistan Textile Body Welcomes FY27 Budget, Seeks FTR

Japan’s Nikkei Scales Record Peak as AI Shares Track US Chip Rally

Why China’s Demand Stimulus Still Isn’t Working

Grinding the Already Ground: Pakistan’s Inflation Crisis

JPMorgan Cuts Anthropic AI Access in Hong Kong

Weak Demand at Treasury Auctions Is Quietly Rattling Bond Investors

China Tungsten Export Curbs: Is Japan’s AI Chip Supply at Risk?

Xponential Fitness Franchise Lawsuit: The $3.97M Judgment

SpaceX IPO opens door for retail savers via X Money

SpaceX IPO: Musk Raises $75bn in History’s Largest Listing

Bank Indonesia Rate Hike 2026: New Mandate’s First Market Test
-

 Markets & Finance6 months ago
Top 15 Stocks for Investment in 2026 in PSX: Your Complete Guide to Pakistan’s Best Investment Opportunities
-

 Analysis5 months ago
Top 10 Stocks for Investment in PSX for Quick Returns in 2026
-

 Analysis5 months ago
Brazil’s Rare Earth Race: US, EU, and China Compete for Critical Minerals as Tensions Rise
-

 Analysis5 months ago
Johor’s Investment Boom: The Hidden Costs Behind Malaysia’s Most Ambitious Economic Surge
-

 Banks6 months ago
Best Investments in Pakistan 2026: Top 10 Low-Price Shares and Long-Term Picks for the PSX
-

 Investment6 months ago
Top 10 Mutual Fund Managers in Pakistan for Investment in 2026: A Comprehensive Guide for Optimal Returns
-

 Global Economy6 months ago
15 Most Lucrative Sectors for Investment in Pakistan: A 2025 Data-Driven Analysis
-

 Global Economy6 months ago
Pakistan’s Export Goldmine: 10 Game-Changing Markets Where Pakistani Businesses Are Winning Big in 2025