
China Economy
China’s Property Woes Could Last Until 2030—Despite Beijing’s Best Censorship Efforts
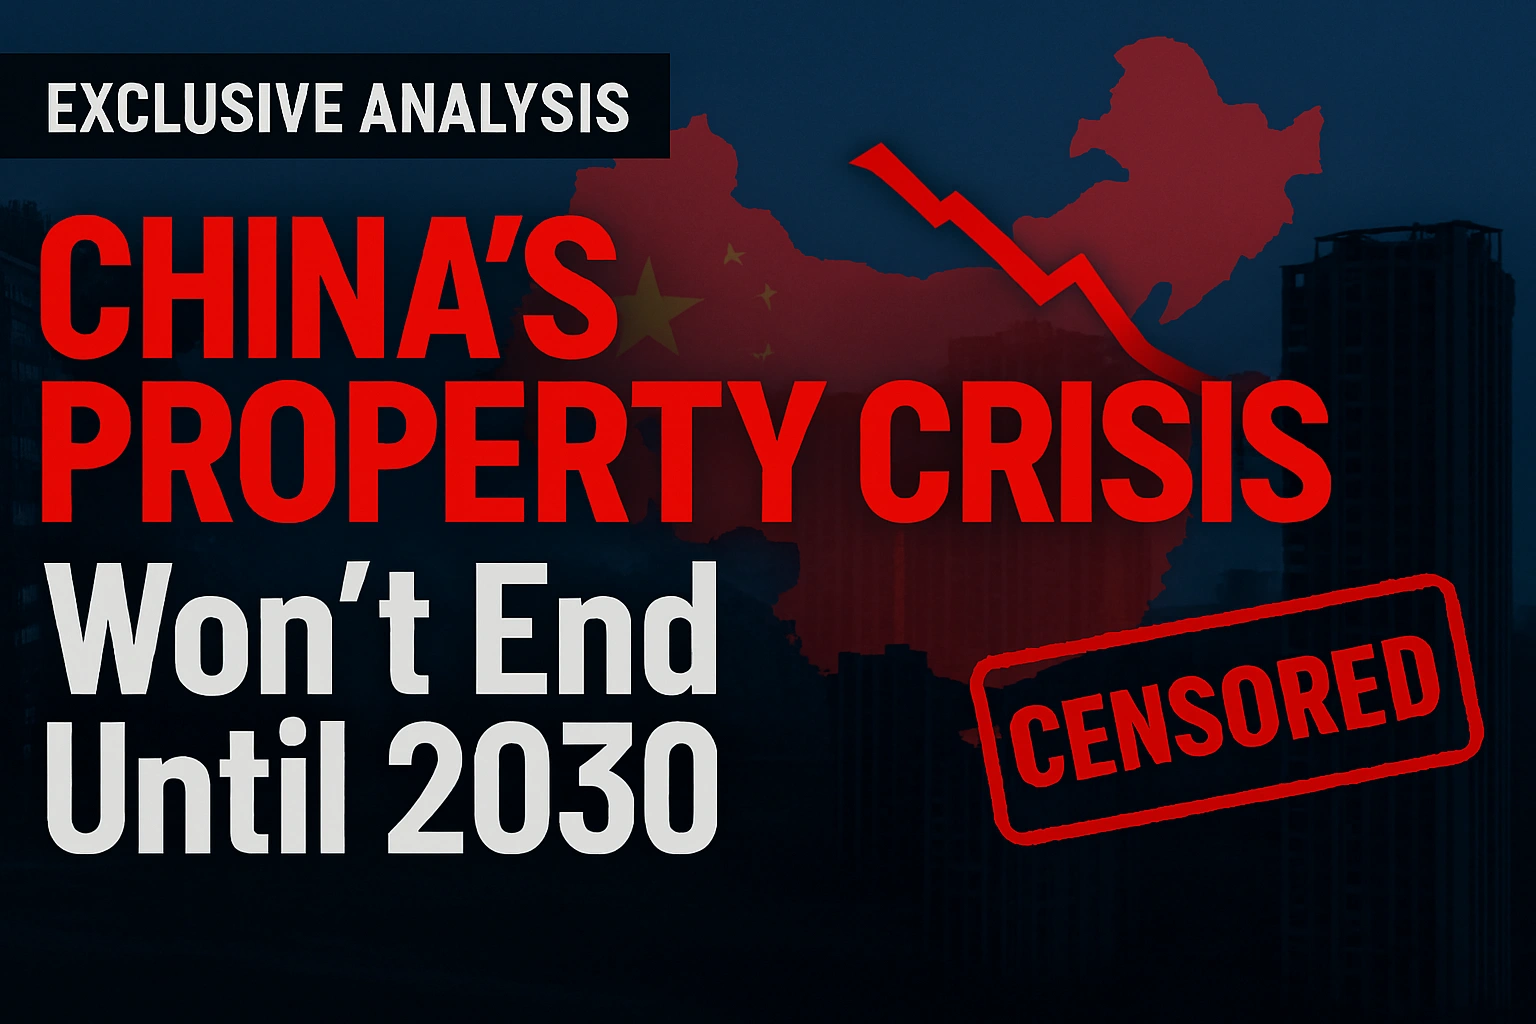
The world’s second-largest economy faces a reckoning that no amount of information control can erase
The construction cranes stand frozen against Shanghai’s skyline like monuments to excess. In Guangzhou, half-finished apartment towers cast long shadows over streets where homebuyers once lined up with cash deposits. Across China’s tier-two and tier-three cities, the evidence is impossible to ignore: new home prices dropped 2.4% year-on-year in November 2025, marking the 29th consecutive month of price declines.
This isn’t just another market correction. It’s the unraveling of a $60 trillion real estate ecosystem that powered four decades of unprecedented growth—and here’s what keeps global economists awake at night: despite aggressive government intervention and increasingly sophisticated censorship machinery, this crisis won’t bottom out until 2030.
The Staggering Scale of China’s Property Collapse
Numbers tell stories that social media censors can’t delete. The Index of Selected Residential Property Prices registered a 6.40% year-on-year contraction in Q2 2025, but the human cost cuts deeper. Zhang Wei, 34, has dutifully paid mortgage installments for two years on an apartment in Chongqing that remains a concrete skeleton, unfinished and uninhabitable. His story echoes across hundreds of cities.
The developer collapses read like a who’s who of China’s corporate giants. China Evergrande Group, with over $300 billion in debt, received a liquidation order in January 2024 and was delisted from the Hong Kong Stock Exchange in August 2025. But Evergrande wasn’t alone. China Vanke Co. reported a record 49.5 billion yuan ($6.8 billion) annual loss for 2024, sending shockwaves through a sector that believed state-backed developers were immune to failure.
Country Garden, once China’s largest private developer with 3,000 projects nationwide, defaulted on international bonds in October 2023 after missing payments within a 30-day grace period. Investment in real estate development declined by 14.7% in the first ten months of 2025, with sales of new homes projecting an 8% decrease for the full year, marking the fifth consecutive year of negative growth.
The construction sector tells an equally grim story. The total area of residential projects started declined by 22.55% year-on-year to 536.6 million square meters, while completed residential units fell by 25.81% to 537 million square meters. Construction workers remain unpaid, suppliers face bankruptcy, and the entire supply chain—from cement manufacturers to elevator installers—struggles to survive.
Why This Isn’t Just Another Downturn: The Structural Trap
Understanding why recovery will take until 2030 requires examining the unique architecture of China’s economy. Unlike typical real estate downturns, this crisis strikes at the foundational model that has powered Chinese growth since the 1990s.
The Property-Dependency Problem
Real estate and related industries accounted for approximately 25% of China’s GDP in 2024, despite the ongoing decline. This isn’t simply about construction—it’s about land sales, furniture manufacturing, home appliances, property management, legal services, and financial products all built around housing.
Housing prices have fallen 20% or more since they peaked in 2021, and with 70% of household wealth tied to property, falling home prices directly erode family balance sheets. This creates a vicious cycle: declining wealth leads to reduced consumption, which slows economic growth, which further pressures property values.
The Local Government Fiscal Catastrophe
Here’s where the crisis becomes truly intractable. Revenue from land sales by China’s local governments dropped 16% in 2024 compared with the previous year, after a 13.2% decline in 2023. But land sales aren’t just one revenue stream among many—they’ve been the primary funding mechanism for local governments since the 1990s.
Local Government Financing Vehicles (LGFVs), the shadow banking entities that local officials created to circumvent borrowing restrictions, are now drowning. Total debt raised directly by local governments and via their financing vehicles now stands at around 134 trillion yuan, equal to roughly $19 trillion.
These LGFVs were designed with a simple assumption: land values would continue rising, providing both collateral for new loans and revenue from sales to service existing debt. That assumption has catastrophically failed. The call for LGFVs to buy land to create revenue for local governments made matters worse, turning land from a key source of revenue into a source of new debt.
The Inventory Overhang
The inventory turnover ratio in China shortened by five months from its peak of 25.9 months in April 2025, but at the current pace, it may take another year and a half for the clearance cycle to reach 12-18 months—a relatively healthy range. That’s optimistic. In many tier-three and tier-four cities, years’ worth of unsold inventory sits vacant, with no clear demand in sight.
The math is unforgiving. Even if sales stabilize tomorrow, clearing existing inventory while developers and local governments simultaneously restructure trillions in debt requires time measured in years, not quarters.
Censorship vs. Economic Reality: When Propaganda Meets Balance Sheets
Beijing has deployed its formidable censorship apparatus with surgical precision. In less than three weeks, social media platforms Xiaohongshu and Bilibili removed more than 40,000 posts under a “special campaign” to regulate online real estate content. The Shanghai branch of the Cyberspace Administration led efforts to scrub negative sentiment about housing markets from social media.
The censorship strategy extends beyond simple post deletion. After authorities urged platforms to clean up material containing problems such as “provoking extreme opposition, fabricating false information, promoting vulgarity, and advocating bad culture,” the Cyberspace Administration of China announced in early 2025 that platforms had removed more than a million pieces of content.
This represents a coordinated campaign to control the narrative around the property crisis. Posts discussing falling home values, developer defaults, or economic pessimism are systematically removed. Even discussions of the Zhuhai vehicular attack in November 2024 were censored, part of a broader effort to suppress anything that might undermine social stability.
But here’s the fundamental problem with censoring an economic crisis: you can delete social media posts, but you can’t delete non-performing loans. You can remove hashtags about Evergrande’s default, but you can’t remove the actual debt from bank balance sheets. You can silence influencers discussing property values, but you can’t force buyers into a market where confidence has evaporated.
The contrast between official statements and ground-level reality grows starker by the month. State media emphasizes “stability” and “gradual recovery,” while sales of the top 100 developers plunged 36% in terms of value in November 2025 from a year earlier. Beijing announces stimulus packages, yet investment in fixed assets, which includes property, contracted 2.6% over the January through November period compared with a year earlier.
The 2030 Timeline: Breaking Down the Recovery Math
Why 2030? The projection isn’t arbitrary—it’s based on the time required to work through structural imbalances that took decades to build.
Inventory Clearance: 3-4 Years Minimum
Even optimistic scenarios require 2027-2028 to clear excess housing inventory in major cities, and potentially 2029-2030 for tier-three and tier-four cities. This assumes sales don’t deteriorate further—an assumption that grows shakier as demographic headwinds intensify.
Developer Balance Sheet Repair: 4-6 Years
Dozens of Chinese developers have been approved for debt restructuring plans since the start of 2025, clearing more than 1.2 trillion yuan ($167 billion) in liabilities. But this represents a fraction of total developer debt. The restructuring process—negotiating with creditors, selling assets, and gradually rebuilding financial viability—typically requires multiple years even in the best circumstances.
Local Government Fiscal Restructuring: 5-7 Years
This is the longest and most complex component. Beijing authorized 10 trillion yuan in local debt issuance—to be disbursed over five years—to address hidden obligations in 2024. But this merely refinances existing debt at lower interest rates; it doesn’t create new revenue sources.
The fundamental problem remains: local governments structured their finances around continuously rising land values. Rebuilding fiscal sustainability requires either dramatically cutting expenditures (politically painful and economically damaging) or finding alternative revenue sources (difficult and slow to implement).
Demographic Drag: Permanent Headwind
China’s working-age population is shrinking, and urbanization—the force that drove housing demand for three decades—has plateaued. These aren’t cyclical issues that resolve with stimulus; they’re structural realities that reduce baseline housing demand permanently.
Historical Parallels: Lessons from Japan’s Lost Decades
The comparison to Japan’s 1990s property bubble isn’t perfect, but it’s instructive. By 2004, prime “A” properties in Tokyo’s financial districts had slumped to less than 1 percent of their peak, and Tokyo’s residential homes were less than a tenth of their peak. It took until 2007—16 years after the bubble burst—for property prices to begin rising again.
From 1991 to 2003, the Japanese economy grew only 1.14% annually, while the average real growth rate between 2000 and 2010 was about 1%. What was initially called the “Lost Decade” became the “Lost Two Decades,” and many economists now reference “Lost Three Decades.”
Japan’s experience demonstrates several sobering realities:
Balance sheet recessions take years to resolve. Even with aggressive monetary easing (Japan pioneered zero-interest-rate policy in the late 1990s) and massive fiscal stimulus, deleveraging proceeds slowly. Households and corporations prioritize debt repayment over spending and investment.
Zombie companies drain economic vitality. Banks kept injecting funds into unprofitable firms that were too big to fail, preventing capital reallocation to productive uses. China faces a similar risk with its state-owned enterprises and developers.
Property-driven wealth effects create powerful negative feedback loops. As Japanese real estate values declined, household wealth evaporated, consumption stagnated, and deflation became entrenched. China’s even greater concentration of household wealth in property suggests potentially worse wealth effects.
The key difference: China’s crisis is arguably more structurally complex. Japan’s property bubble was primarily driven by speculative excess and loose monetary policy. China’s bubble involved speculation plus local government fiscal dependency plus shadow banking plus a fundamental economic model built around property development. Unwinding this requires more than monetary and fiscal tools—it requires redesigning the growth model itself.
Global Ripple Effects: No Crisis Is an Island
China’s property troubles send shockwaves far beyond its borders. Australia and Brazil, major commodity exporters, already face reduced demand for iron ore, copper, and other construction materials. European luxury brands that catered to China’s affluent property developers and homebuyers report softening sales.
The exposure runs deeper than trade flows. Foreign investors hold portions of Chinese developer bonds, though many have already taken massive losses. More concerning are the indirect linkages: Chinese state-owned companies with overseas investments potentially scaling back as domestic pressures mount, Chinese tourists and students spending less abroad as household wealth declines, and geopolitical implications of a economically stressed superpower.
Financial contagion risks remain contained for now—China’s capital controls and state banking sector provide insulation. But the growth drag is unavoidable. China’s housing market correction continues as an ongoing headwind, with KKR’s chief economist for Greater China estimating a 1.5 percentage point dent on China’s gross domestic product in 2025, compared with 2.5 percentage points in 2022.
What Tier-1 Companies Should Do Now
For multinational corporations and investors, the 2030 timeline requires strategic adjustments:
Diversify China exposure. Companies heavily dependent on Chinese property-related demand should accelerate diversification into other Asian markets or sectors. The “China-only” growth strategy needs fundamental reevaluation.
Watch local government creditworthiness. Companies with receivables from Chinese local governments or infrastructure projects face rising payment risks. Credit insurance and careful monitoring of local fiscal conditions are essential.
Reconsider real estate collateral. Lenders and investors using Chinese property as collateral should reassess valuations aggressively. The assumption that property values provide a floor has proven catastrophically wrong.
Monitor consumer wealth effects. Consumer-facing businesses should prepare for years of constrained spending as household wealth remains depressed. The Chinese consumer, long expected to drive global growth, faces significant headwinds.
Prepare for policy volatility. Beijing will likely cycle through various stimulus measures, creating temporary market movements. Distinguishing genuine structural improvements from short-term liquidity injections is critical.
The Painful Path Forward
Beijing recognizes that the core issue lies in reducing local governments’ dependence on LGFVs, with Premier Li Qiang underscoring the need to “remove government financing functions from local financing platforms and press ahead with market-oriented transformation”. This is the right diagnosis, but the treatment will be painful and prolonged.
“China’s property crisis represents more than a cyclical downturn—it’s the unwinding of a growth model that took 30 years to build. Recovery to sustainable equilibrium requires 5-7 years minimum, with 2030 representing the earliest realistic bottom under optimistic scenarios. Censorship can control information but cannot alter the underlying economics.“
China needs to rebuild its entire fiscal architecture. This means new tax structures, revised central-local government responsibilities, transparent budget constraints, and allowing insolvent entities to actually fail rather than propping them up indefinitely. Each of these reforms faces powerful resistance from vested interests.
The alternative—continuing to refinance bad debts, prop up zombie developers, and hope for a return to property-driven growth—merely extends the crisis. It’s Japan’s playbook from the 1990s, and the results speak for themselves.
Conclusion: When Censorship Meets Economic Gravity
Beijing’s censors can scrub social media clean of negative sentiment. They can delete posts, suspend accounts, and create the digital appearance of stability. What they cannot do is delete the structural imbalances in China’s economy, rewrite the math of debt-to-GDP ratios, or manufacture demand in a demographically declining society with excess housing supply.
The 2030 timeline isn’t pessimism—it’s arithmetic. Clearing inventory, restructuring debt, rebuilding local government finances, and allowing new economic models to emerge requires time measured in years, not quarters. Japan’s experience, with similar structural challenges but arguably simpler economics, took more than a decade even with aggressive policy responses.
For global businesses, investors, and policymakers, the implications are profound. The Chinese growth engine that powered the global economy for three decades is fundamentally transforming. The property-driven model is over, and what replaces it remains uncertain.
The censors can control the narrative on Weibo. They cannot control economic reality. And economic reality suggests that 2030 marks not the beginning of recovery, but merely the year when China might finally hit bottom—if, and only if, Beijing pursues genuine structural reforms rather than continued extend-and-pretend tactics.
For hundreds of millions of Chinese families like Zhang Wei’s, still paying mortgages on unfinished apartments, that timeline offers cold comfort. But it offers something perhaps more valuable: honesty about the scale of the challenge ahead. No amount of censorship can change what the numbers tell us—this is a crisis that will define China’s next decade.
Data Sources :
This analysis draws from National Bureau of Statistics of China, International Monetary Fund reports, Bloomberg Intelligence, Goldman Sachs research, and major property developer financial statements through December 2025. Statistical projections are based on historical recovery timelines from comparable property crises, adjusted for China-specific structural factors.
Discover more from The Economy
Subscribe to get the latest posts sent to your email.


Analysis
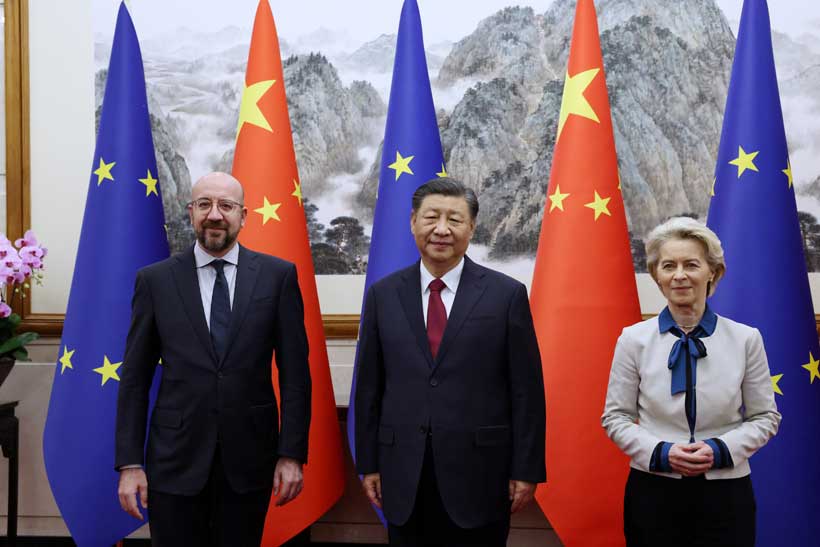
When Rivals Share a Rocket: The China-Europe SMILE Mission and the Fragile Promise of Space Science Diplomacy
On April 9, a European rocket will lift a Chinese-European spacecraft into orbit from the jungle coast of French Guiana. In a world tearing itself apart over chips, trade routes, and strategic chokepoints, this is not nothing.
The Countdown the World Isn’t Watching — But Should Be
At 08:29 CEST on April 9, 2026, an Avio-built Vega-C rocket — designated mission VV29, the first Vega-C flight operated by Avio Avio — will ignite its first-stage engines at Europe’s Spaceport in Kourou, French Guiana. Riding atop it will be SMILE: the Solar wind Magnetosphere Ionosphere Link Explorer, a 2,250-kilogram spacecraft nearly a decade in the making. The mission is a joint undertaking between the European Space Agency (ESA) and the Chinese Academy of Sciences (CAS) — and it is, by any reasonable measure, the most symbolically weighted space launch of 2026.
Not because of its destination. Not because of the science alone, though the science is genuinely groundbreaking. But because of what it represents at this particular moment in history: two of the world’s major technology powers, locked in an increasingly fraught geopolitical relationship, sharing data, sharing hardware, and sharing a launchpad.
SMILE is China’s first mission-level, fully comprehensive in-depth cooperation space science exploration mission with ESA GitHub — a statement that, when you sit with it, reveals how exceptional this collaboration actually is. After years of US-led pressure to isolate Chinese space activities, after the Wolf Amendment that has effectively banned NASA from bilateral cooperation with China since 2011, after wave after wave of technology export restrictions, here is a European rocket carrying instruments built simultaneously in Leicester and Beijing, tested jointly in the Netherlands, fuelled in Kourou, and aimed at a shared scientific horizon.
This is worth examining closely — not with naïve optimism, but with clear eyes.
What SMILE Actually Does, and Why It Matters
Before the geopolitics, the science — because the science is the point, and it deserves more serious attention than it typically receives in the English-language press.
Earth is constantly bombarded by gentle streams — and occasionally stormy bursts — of charged particles from the Sun. Luckily, a massive magnetic shield called the magnetosphere stops most of these particles from reaching us. If it weren’t for the magnetosphere, life could not survive on planet Earth. ESA
SMILE’s purpose is to give humanity its first comprehensive, simultaneous, global view of how that shield actually works — how it bends, buckles, and recovers under the assault of solar wind and coronal mass ejections (CMEs). Although several spacecraft have observed the effects of the solar wind and coronal mass ejections on Earth’s magnetic shield, they have mostly done so piecemeal ESA, through point measurements that are a bit like trying to understand a hurricane by sticking your hand out a single window.
SMILE changes that. The mission is a novel self-standing effort to observe the coupling of the solar wind and Earth’s magnetosphere via X-ray imaging of the solar wind-magnetosphere interaction zones, UV imaging of global auroral distributions, and simultaneous in-situ solar wind, magnetosheath plasma and magnetic field measurements. SPIE Digital Library
The four instruments it carries — the Soft X-ray Imager (SXI) built at the University of Leicester, a UV Aurora Imager, a Light Ion Analyser, and a Magnetometer — will work in concert from a highly inclined, highly elliptical orbit, with an apogee of 121,000 km and a perigee of 5,000 km. Avio From that sweeping vantage, SMILE will watch in real time as solar storms slam into Earth’s magnetic bubble, deform its boundaries, and trigger the geomagnetic disturbances we call space weather.
The Economic Stakes of Space Weather
Here is where the science becomes urgently, uncomfortably practical.
A severe geomagnetic storm — the kind triggered by a powerful CME — can induce electrical currents in long-distance transmission lines powerful enough to melt transformer cores. It can cripple GPS satellites, knock out shortwave radio communications, accelerate the degradation of satellite hardware, and expose astronauts to dangerous radiation doses. The Carrington Event of 1859 — the largest geomagnetic storm in recorded history — set telegraph offices on fire and produced auroras visible from the Caribbean.
Were a Carrington-scale event to strike the modern infrastructure-dependent world, the consequences would be catastrophic. Lloyd’s of London has estimated that a severe geomagnetic storm striking North America could leave between 20 and 40 million people without power for periods ranging from weeks to years, at a cost that would run into the trillions. The May 2024 geomagnetic storm — the most powerful in two decades — disrupted GPS signals and degraded satellite operations across the globe, offering a modest preview of what a truly extreme event might look like.
Better forecasting requires better physics. And better physics requires exactly what SMILE is designed to provide: a complete, global picture of how the magnetosphere actually responds to solar assault. By improving our understanding of the solar wind, solar storms and space weather, SMILE will fill a stark gap in our understanding of the Solar System and help keep our technology and astronauts safe in the future. ESA
A Mission Born in a Different World
The story of how SMILE came to be is, in itself, a small geopolitical parable.
The SMILE project was selected in 2015 out of 13 other proposals, and became the first deep mission-level cooperation between the European Space Agency and China. Orbital Today It was conceived when relations between China and the West, while not without tension, still operated under a broadly cooperative logic — when the prevailing assumption in Brussels and Beijing alike was that economic interdependence would gradually soften political friction and that scientific collaboration was a relatively safe space for engagement.
The Principal Investigators were Graziella Branduardi-Raymont from Mullard Space Science Laboratory, University College London, and Chi Wang from the State Key Laboratory of Space Weather at NSSC, CAS. ESA
What strikes me most about this pairing is its elegance and its tragedy. Professor Branduardi-Raymont — who, it should be noted, passed away in November 2023 after a lifetime of X-ray astronomy — had spent decades frustrated that no existing observatory could directly image X-ray emission from Earth’s magnetosphere. Her perseverance eventually produced this mission. She did not live to see its launch. But her instrument, built at the University of Leicester and calibrated with painstaking care across multiple European institutions, will fly on April 9 in the spacecraft she helped conceive. There is something moving in that continuity.
Professor Chi Wang, her Chinese counterpart, continued the work — a collaboration that survived COVID-era isolation, supply chain disruptions, and the gathering chill of US-China technology competition.
The SMILE mission entered full launch implementation phase after passing the joint China-Europe factory acceptance review on October 28, 2025. At the end of November 2025, the propellant required for the satellite departed from Shanghai, arriving at Kourou port in early February 2026. CGTN
On February 11, 2026, the flight model and ground support equipment departed from ESTEC in the Netherlands, sailing across the Atlantic from Amsterdam port aboard the cargo vessel Colibri, arriving at Kourou port on February 26, 2026, and being successfully transferred to the launch site. CGTN
That detail — a cargo ship named Colibri, sailing from Amsterdam to French Guiana carrying a satellite built in two countries on opposite ends of the Eurasian continent — is, to me, the most vivid emblem of what scientific cooperation can accomplish when given enough time, enough stubbornness, and enough shared wonder.
Europe’s Delicate Balancing Act
The launch of SMILE does not occur in a geopolitical vacuum. It occurs at a moment when Europe’s relationship with both China and the United States has become extraordinarily complex.
Washington has grown increasingly vocal about the risks of European technological cooperation with Beijing. The US-China Economic and Security Review Commission has flagged joint space missions as a potential vector for technology transfer. The US Space Force has publicly warned allies about sharing sensitive sensor data with Chinese partners. And while SMILE is a pure science mission — studying solar-terrestrial physics, not military reconnaissance — the distinction between civilian and dual-use space technology is one that Washington now views with considerable scepticism.
ESA, for its part, has walked this line with notable care. ESA Director General Josef Aschbacher confirmed SMILE’s launch timeline in January 2025, framing the mission squarely within the agency’s Cosmic Vision scientific programme — an agenda governed by scientific merit, not geopolitical alignment. “Building on the 24-year legacy of our Cluster mission,” said ESA Director of Science Prof. Carole Mundell, “SMILE is the next big step in revealing how our planet’s magnetic shield protects us from the solar wind.” ESA
That framing matters. ESA is positioning SMILE not as a concession to Beijing, but as the natural scientific successor to decades of European magnetospheric research — a mission that happens to have a Chinese partner because the Chinese partner brought the best science proposal to the table in 2015.
Strategic Autonomy in Orbit
Europe’s Strategic Autonomy agenda — the drive to reduce dependency on both American and Chinese platforms — finds an interesting expression in SMILE. The mission uses a European launcher (Vega-C), European testing facilities (ESTEC in the Netherlands), and a European payload module built by Airbus in Spain. China contributes three scientific instruments and the spacecraft platform and operations. The division of labour is not equal, but it is genuine.
This is different from the model China has pursued in, say, its International Lunar Research Station programme — a Beijing-led effort to build a Moon base with selective partner participation on China’s terms. SMILE was born from a joint call for proposals, adjudicated by both ESA and CAS, on scientific merit alone. The symmetry of its origins is a meaningful safeguard.
What the mission also illustrates, however, is the limits of that safeguard. Despite ongoing delays of the launch and geopolitical tensions between Europe and China, this mission marks an important collaboration between the two parties. Orbital Today Delays stretched from an original 2021 target across five years. COVID disrupted joint testing. Geopolitics hovered over every logistics decision. That the satellite is sitting on a Vega-C in Kourou today is a testament to institutional resilience on both sides — and a reminder of how fragile such resilience can be when the political weather changes.
What Comes Next: Blueprint or One-Off?
The successful implementation of the SMILE mission will set a benchmark for China-EU space science cooperation and lay the technological foundation for deeper future collaboration. GitHub
That Chinese Academy of Sciences statement is aspirational in tone. Whether it reflects reality will depend on choices that neither ESA nor CAS alone can make.
The scientific case for continued China-Europe cooperation in space is actually strong. China has developed formidable capabilities in solar and heliospheric science, planetary exploration, and space weather monitoring. ESA brings world-class instrumentation, launcher independence, and an institutional culture of multinational collaboration forged across 22 member states. Together, they have demonstrated — through SMILE — that the logistics of joint mission development are solvable, even across supply chain disruptions and a pandemic.
The geopolitical case is harder. As US pressure on European technology transfer policies intensifies, as China’s own space ambitions grow more assertive, and as the Artemis Accords effectively create a US-aligned coalition in cislunar space, Europe faces a binary pressure: join Washington’s bloc or preserve its own lane.
SMILE suggests a third option — cautious, science-first, mission-specific cooperation, carefully ring-fenced from military and surveillance applications, conducted through multilateral institutions with independent governance. It is not a grand geopolitical declaration. It is a pragmatic transaction between research agencies who share a genuine scientific puzzle.
That may, in the end, be its most important lesson. The most durable forms of international cooperation are rarely born from summit communiqués or diplomatic ambition. They are built from specific problems, shared curiosity, and the grinding, unglamorous work of building something together over a decade. SMILE’s cargo ship sailed from Amsterdam. Its fuel was loaded in Shanghai. Its instruments were calibrated in Leicester. Its launcher was assembled in Colleferro.
On the morning of April 9, all of that will rise together over the Atlantic, riding a column of fire into a highly elliptical orbit 121,000 kilometres above the Earth, where it will spend three years watching our planet’s invisible magnetic shield absorb the fury of the Sun.
Whatever one thinks of the geopolitics, that image is worth holding onto.
The View From the Launchpad
In a world increasingly defined by decoupling — technological, financial, diplomatic — SMILE is a small, luminous exception. It will not resolve the fundamental tensions between Beijing and Brussels. It will not answer the question of whether Europe can maintain scientific ties with China while deepening security cooperation with Washington. It will not make the next CME less dangerous or the next trade war less likely.
But it will, if all goes to plan, give us something genuinely new: a complete, real-time picture of how Earth’s magnetic shield breathes, bends, and holds against the solar wind. And it will have done so because two sets of scientists — from Milan and Beijing, from Leicester and Shanghai — decided that the problem was important enough to work on together, regardless of the weather in Washington.
What strikes me most, in the end, is not the geopolitics. It is the image of Professor Branduardi-Raymont at Mullard Space Science Laboratory, frustrated for years that no observatory could image X-ray emission from the magnetosphere, proposing mission concepts until one finally stuck. The Colibri will not carry her name. But the instrument riding inside the fairing of that Vega-C, the lobster-eye X-ray telescope that will for the first time map the shape of Earth’s magnetic boundary, is her life’s work.
The rocket lifts off at 08:29 CEST. The world should be watching.
Discover more from The Economy
Subscribe to get the latest posts sent to your email.
Analysis
How China Reinvented the BRI: Western Tariffs Accelerated Its Transformation Into a Sophisticated Extension of China’s Industrial Policy
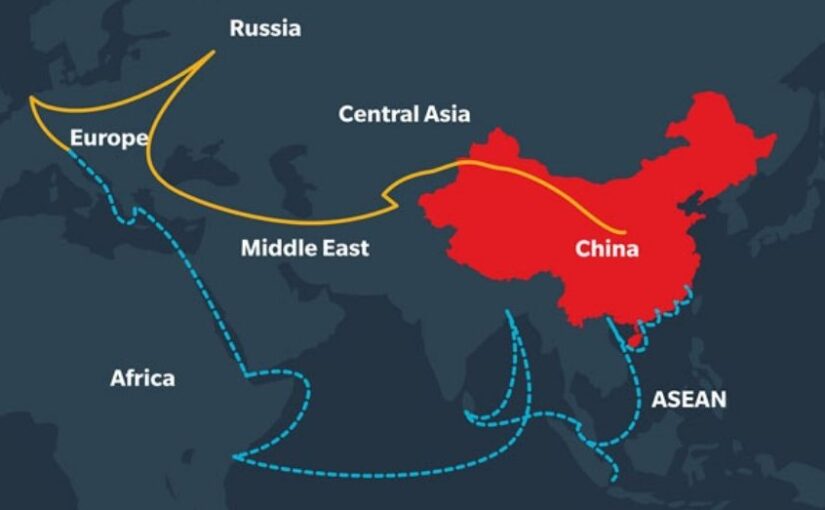
There is a particular kind of policy failure that announces itself quietly—not with a crisis, but with a statistic that arrives too late to matter. For Western capitals still congratulating themselves on having exposed the “debt-trap diplomacy” of China’s Belt and Road Initiative, that statistic arrived in early 2025: $213.5 billion. That is the total value of BRI engagement last year, the highest figure ever recorded, driven by $128.4 billion in construction contracts and $85.2 billion in investments, according to the definitive annual tracking report by the Green Finance & Development Center at Fudan University and the Griffith Asia Institute.
The West had been writing the BRI’s obituary for years. It turns out the patient wasn’t dying—it was in surgery, emerging leaner, smarter, and considerably more dangerous to ignore.
This is the story of how China reinvented the BRI, and why the transformation is Beijing’s most consequential geopolitical pivot since Deng Xiaoping told his country to hide its strength and bide its time. Except now, China isn’t hiding anything.
From Debt-Trap Fears to Industrial Powerhouse: The Narrative That Aged Poorly
Cast your mind back to 2018. Western think-tanks were publishing breathless reports about “debt-trap diplomacy.” The IMF was warning about unsustainable Chinese loans. Hambantota port in Sri Lanka had become shorthand for everything allegedly predatory about the BRI. American officials quietly believed the initiative would collapse under its own contradictions—bad loans, political backlash, COVID disruptions, and the rising chorus of recipient-country grievances would do what sanctions could not.
Some of that critique was legitimate. Early BRI lending was frequently opaque, environmentally careless, and calibrated more toward Chinese state-owned construction firms than the development needs of host countries. AidData’s landmark 2021 research documented “hidden debt” problems in dozens of countries and found that a significant share of projects generated local frustration.
But here is where the Western analysis went badly wrong: it assumed Beijing would respond to criticism the way a Western institution might—with retrenchment, reform panels, and lengthy consultations. Instead, China did something far more strategically coherent. It quietly dismantled the version of the BRI that was failing and replaced it with one calibrated for a new era of great-power competition.
The result? While the West debated whether the BRI was dead, China’s total foreign trade hit approximately $6.4 trillion in 2024, with a historic trade surplus of roughly $1.19–1.2 trillion—figures reported by Reuters that would have seemed fantastical just a decade ago. The BRI isn’t a side project anymore. It is the arterial system through which that surplus finds its geopolitical purpose.
Tariffs as Catalyst: The 2025 Rebound Numbers Tell a Specific Story
The conventional wisdom holds that Western tariffs—Biden’s chips restrictions, the EU’s EV duties, Trump’s sweeping trade barriers—put China on the defensive. The 2025 BRI data suggests exactly the opposite dynamic: tariffs functioned as an accelerant, forcing Beijing to accelerate the very industrial-policy upgrades the BRI now embodies.
Consider the logic. When Washington raised tariffs on Chinese goods and Brussels slapped duties on Chinese EVs, it created an immediate problem for China’s manufacturing export machine: where do the goods go? The answer, executed with characteristic patience, was to restructure the BRI not just as a market for Chinese exports, but as a platform for relocating Chinese production—or at least assembly—to tariff-exempt or tariff-advantaged third countries.
This is BRI supply chain rerouting tariffs in practice, not theory. Chinese firms, particularly in solar, EVs, and batteries, have been quietly establishing manufacturing footholds in BRI partner countries—Morocco, Indonesia, Hungary, Uzbekistan, Ethiopia—that enjoy preferential trade access to Western markets. The BRI’s infrastructure investments, once mocked as vanity ports and empty highways, now serve as the backbone for this industrial relocation strategy.
Key 2025 data points from the GFDC/Griffith report:
- $128.4 billion in construction contracts—the single largest component, reflecting continued hard-infrastructure buildout, now increasingly in energy and digital sectors
- $85.2 billion in direct investments—up sharply, and skewed toward manufacturing and green-tech rather than traditional ports and roads
- Africa and Central Asia led in project volume; Latin America showed the most dramatic investment value growth
- The private sector—companies like LONGi Green Energy, CATL, and East Hope Group—now drives a meaningful share of BRI deals, replacing the lumbering state-owned enterprises of the initiative’s first decade
That last point deserves emphasis. The shift from SOE-dominated lending to private-sector industrial investment is arguably the single most important structural change in the BRI’s reinvention. It is also the change that Western policymakers have been slowest to register.
The New BRI Playbook: Minerals, Green Tech, and Friends-with-Benefits Deals
If the old BRI was about concrete—ports, roads, pipelines, stadiums—the new BRI is about control of the materials and technologies that will define the next economic epoch. Three interlocking strategies define what might be called Beijing’s BRI 2.0 playbook.
First: Critical minerals security. China already refines the lion’s share of the world’s lithium, cobalt, nickel, and rare earths. The new BRI deepens this advantage by securing upstream supply through investment and long-term offtake agreements with mining countries across Africa (DRC, Zimbabwe, Zambia), Central Asia (Kazakhstan, Kyrgyzstan), and Latin America (Chile, Bolivia, Argentina’s lithium triangle). This isn’t charity—it’s vertical integration on a geopolitical scale. When Western nations talk about “friend-shoring” critical mineral supply chains, they are largely scrambling to catch up with arrangements China has been cementing through BRI frameworks for years.
Second: Green-tech export platforms. The EU’s Carbon Border Adjustment Mechanism and American clean-energy subsidies under the IRA were designed, partly, to create a market for Western green technology. Beijing read the same signals and moved faster. Chinese solar manufacturers, EV producers, and battery firms are using BRI partner countries as manufacturing hubs and as captive markets simultaneously. LONGi is building solar panel factories in the Middle East and Southeast Asia; CATL is establishing battery plants in Hungary and Morocco; East Hope is processing aluminium in Southeast Asia using cheaper regional energy. The BRI corridor isn’t just a trade route—it’s a China Belt and Road industrial policy shift writ in gigawatts and gigafactories.
Third: De-dollarization infrastructure. This is the most contested element, but it is real and accelerating. An increasing share of BRI transactions are settled in renminbi or via bilateral currency arrangements. The digital yuan—e-CNY—is being piloted in several BRI corridors. This is not imminent dollar displacement, but it is the patient construction of an alternative plumbing system for global finance, one that could matter enormously in a future sanctions scenario. The Council on Foreign Relations’ BRI backgrounder notes the financial architecture of the BRI as one of its most underappreciated dimensions.
What This Means for the Global South—and the West
The Global South’s relationship with the new BRI is more complicated than either its cheerleaders or its critics admit.
On one hand, recipient countries are more sophisticated than they were in 2013. Governments in Africa, Southeast Asia, and Latin America have watched the Hambantota cautionary tale; many now negotiate harder, demand local employment provisions, and push back on terms that seem tilted too heavily toward Chinese interests. The South China Morning Post has documented a genuine evolution in BRI deal structures—shorter loan tenors, more equity-participation arrangements, greater (if still imperfect) attention to environmental standards.
On the other hand, the fundamental power asymmetry remains. China offers something no other actor currently provides at scale: the combination of capital, construction capacity, and market access in a single package. The EU’s Global Gateway initiative—announced with considerable fanfare as the Western answer to the BRI—has pledged €300 billion through 2027, but disbursement has been slow, governance conditions can be onerous for developing-nation governments, and it cannot match China’s speed of project execution. Foreign Policy’s recent analysis captures the frustration among Global South policymakers who find Western alternatives rhetorically appealing but operationally disappointing.
This creates a dynamic that the West has not adequately grappled with: the BRI rebound 2025 is not primarily a story about Chinese aggression—it is a story about a vacuum the West has failed to fill. Countries that might prefer Western investment are accepting Chinese terms not because they love Beijing, but because the alternative is waiting indefinitely for funds that never quite materialize.
The geopolitical implications compound. Every BRI manufacturing hub established in a third country is a potential hedge against Western market access for that country. Every critical-mineral offtake agreement is a node in a supply chain that circumvents Western leverage. Every e-CNY transaction is a small withdrawal from the dollar’s gravitational pull. Individually, these are manageable. Aggregated over a decade, they constitute a structural shift in global economic architecture.
Why the BRI Is Now “Tariff-Proof”—And a Model for 21st-Century Industrial Statecraft
Here is the contrarian argument that Western analysts need to sit with: Western tariffs didn’t weaken China—they handed Beijing the perfect excuse to upgrade the BRI from concrete to competitive advantage.
The tariff pressure of 2018–2025 forced Chinese industrial policy to become more sophisticated. Firms that might have been content to export finished goods from home factories were pushed—by tariffs, by the risk of further escalation—to internationalize their production. The BRI provided the geographic framework, the infrastructure, and increasingly the regulatory and financial architecture to make that internationalization possible.
The result is a version of the BRI that is, paradoxically, more resilient to Western pressure than its predecessor. When the BRI was primarily about loans and construction contracts, Western pressure could target Chinese banks and state firms. Now that private Chinese industrial companies are the driving force, using locally incorporated entities, partnering with third-country firms, and settling deals in non-dollar currencies, the leverage points are harder to identify and harder to squeeze.
This is what makes the China BRI 2025 moment genuinely novel: it represents the emergence of a model for 21st-century industrial statecraft that Western nations don’t have a clear answer to. It blends state strategy with private-sector execution, hard infrastructure with technology transfer, financial architecture with trade facilitation—all in service of a coherent industrial-policy vision that links domestic manufacturing capacity to overseas market and resource access.
The Economist has noted that China’s approach to industrial policy has grown more sophisticated precisely under the pressure of Western countermeasures—a dynamic that mirrors historical cases where external pressure accelerated rather than retarded technological development.
What the West Should Do Differently: A Pragmatic Agenda
Diagnosis without prescription is just complaint. Here is what a more effective Western response might look like.
Stop celebrating the BRI’s supposed failures. Every time a Western think-tank declares the BRI dead and China proves otherwise, Western credibility takes a quiet hit in exactly the capitals that matter most. Accurate threat assessment is the prerequisite for effective strategy.
Accelerate Global Gateway and PGI disbursement—radically. The Partnership for Global Infrastructure and Investment (G7’s answer to BRI) and the EU’s Global Gateway need to move from pledges to projects at Chinese speeds. This requires cutting bureaucratic timelines, accepting more risk, and being willing to fund imperfect projects in imperfect countries. Development finance cannot be held to standards that make it functionally unavailable.
Compete on the private sector, not just the public sector. China’s most powerful new BRI instrument is private industry—CATL, LONGi, Huawei—backed by state industrial policy but operating with commercial agility. Western governments need to find ways to mobilize their own private sectors into developing-world markets at scale, through blended finance, risk guarantees, and trade facilitation that makes it commercially viable for Western firms to compete where Chinese firms currently dominate.
Engage on critical minerals with genuine urgency. The window to build alternative supply chains for lithium, cobalt, and rare earths is narrowing with each new BRI offtake agreement signed. The World Bank’s minerals framework provides useful architecture; what’s missing is the political will to fund it at the necessary scale.
Stop treating the Global South as a passive audience. The most effective counter-BRI strategy is not to badmouth the BRI—it is to offer recipient countries genuine choices. That means engaging with their actual development priorities, not just Western strategic preferences. Countries that feel they have real alternatives are countries that will negotiate harder with Beijing. Countries that feel they have no choice will sign whatever China puts in front of them.
The View from 2030
Project forward five years. If current trajectories hold, the BRI will have established a durable manufacturing and supply-chain ecosystem across Africa, Central Asia, the Middle East, and Latin America—one calibrated to Chinese industrial priorities, financed through diversified instruments, and partially insulated from Western financial pressure. The critical-minerals supply chains feeding China’s green-tech export machine will be deeper and harder to disrupt. The renminbi’s role in trade settlement will be meaningfully larger, if not yet dominant.
This is not inevitable. China faces real headwinds: domestic economic stress, growing recipient-country pushback on debt and local employment, competition from India and middle powers in specific corridors, and the possibility that some of its industrial bets—particularly in green tech—will be disrupted by technology shifts it doesn’t control.
But the West’s continued tendency to misread the BRI—to see it as a failing initiative rather than an evolving strategic instrument—makes the pessimistic scenario more likely. How China reinvented the BRI is not just an economic story. It is a masterclass in strategic adaptation under pressure, executed by a state that is patient, pragmatic, and playing a longer game than its rivals typically recognize.
The $213.5 billion that moved through BRI channels in 2025 is not a number. It is a signal. The question is whether Washington, Brussels, and London are finally ready to read it correctly.
Discover more from The Economy
Subscribe to get the latest posts sent to your email.
In the early 1980s, something extraordinary was happening in rural China. Incomes were surging. Families who had known only collective poverty under Mao Zedong’s commune system were suddenly trading at market prices, leasing land, and tasting prosperity for the first time in a generation. To most observers — Western economists, development agencies, awed foreign correspondents — this was an unambiguous miracle. But inside the halls of the Chinese Communist Party, one senior official was deeply unsettled by what he saw.
His name was Deng Liqun — no relation to Deng Xiaoping, China’s paramount leader who had initiated these reforms — and he was alarmed not by poverty, but by its opposite: the emergence of rural businesses hiring large numbers of workers. Citing Das Kapital directly, Deng Liqun invoked Marx’s analysis of surplus extraction and warned his colleagues that China was breeding a new exploiter class from within the revolutionary state itself. His warnings were dismissed, sidelined, or quietly buried. Forty years later, as Chinese factory workers report daily wages collapsing to less than 100 yuan amid a record export boom, the uncomfortable question is: was Deng Liqun right all along?
The Seven-Worker Loophole: When Marx Became a Management Consultant
To understand the ideological contortion at the heart of modern China, one must revisit a peculiar episode in the history of economic thought. As Deng Xiaoping’s reformers sought to legalize private enterprise in the early 1980s, they faced a Marxist problem: how could a Communist Party permit capitalist employers? Their solution was as creative as it was absurd.
Party theorists dug into Volume IV of Das Kapital and located a passage in which Marx cited the example of an employer with eight workers as the threshold at which genuine capitalist exploitation begins. The inference was swift and convenient: hire no more than seven workers, and you are not a capitalist. The “seven-worker rule” became, briefly, the ideological boundary between socialism and sin. As one analyst of the period put it, the Party had transformed Marx into a management consultant — and a lenient one at that.
The rule did not last. Entrepreneurs like Nian Guangjiu, the Shazi Guazi (“Fool’s Sunflower Seeds”) magnate, hired hundreds of workers and dared Beijing to intervene. Deng Xiaoping, pragmatist to the bone, let it pass. The seven-worker rule was quietly abandoned. China’s private sector began its long, relentless ascent.
But Deng Liqun continued to press his case. Throughout the 1980s, as China’s reformist faction consolidated power, he remained one of the party’s most vocal critics of market liberalization, warning that unchecked private capital would reproduce exactly the exploitative dynamics Marx had described. He was repeatedly outmaneuvered. He died in 2015, at age 99, largely forgotten — a curio of ideological defeat.
What he could not have known is that the data would eventually vindicate him.
The Numbers Behind the Narrative
China’s economic rise remains one of history’s most astonishing chapters. Hundreds of millions lifted from poverty. A GDP that expanded from a fraction of the United States’ to roughly 70 percent of it in nominal terms. The construction of entire cities from bare earth. No serious analyst dismisses this achievement.
But growth and fairness are different metrics. And on the metrics that matter most to a self-proclaimed workers’ state, the picture is quietly damning.
According to estimates by the International Labour Organization, China’s output per hour worked in 2025 stood at just $20 in constant international dollars — behind the global average of $23, and roughly on par with Brazil and Mexico. The United States, by comparison, registers $82 per hour. China does not achieve its manufacturing dominance through efficiency or technological leverage. It achieves it through sheer volume of hours — the kind of raw labor extraction that, as a recent analysis in Foreign Affairs argued, is precisely the dynamic Deng Liqun warned about four decades ago.
Income inequality tells an equally uncomfortable story. China’s official Gini coefficient stands at 0.47 — already above the internationally recognized warning threshold of 0.40, beyond which social instability becomes a material risk. But economists at Cornell University and Peking University, working with alternative datasets, place the true figure closer to 0.52, putting China in the company of some of the world’s most unequal societies. Meanwhile, data from Peking University’s China Development Report reveals that the top 1 percent of Chinese households own roughly one-third of the country’s property — a concentration of wealth that would have struck the founders of the People’s Republic as counterrevolutionary.
The public-private wage gap compounds the picture. According to data from China Briefing, the average annual urban wage in China’s public sector reached RMB 120,698 in 2023, while the average in the private sector — where the vast majority of Chinese workers are employed — was just RMB 68,340. Those who work for the state earn nearly twice those who do not. In a country that officially represents the proletariat, the proletariat is still on the outside looking in.
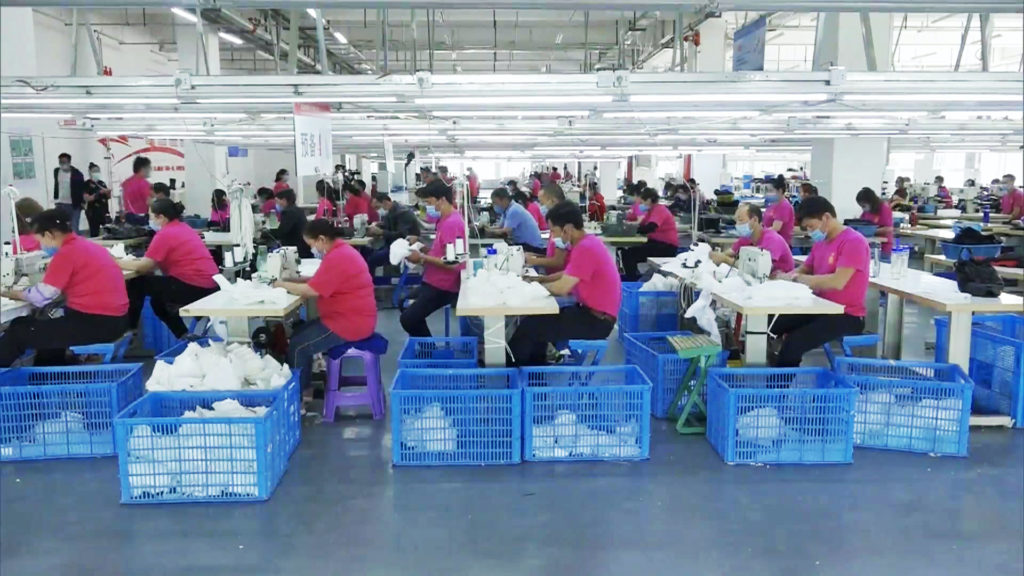
The Factory Floor in 2026
Abstract statistics find their most vivid expression on the ground. A Bloomberg investigation from March 2026 documented day laborers in Guangzhou waiting in winter cold for factory agents to offer work. One worker, Sheng, 55, described his income having more than halved to less than 100 yuan — roughly $14 — per day. Some workers cannot find employment for months at a time, he said. This is occurring while China posts record export numbers, defying the Trump administration’s escalating tariffs with a manufacturing juggernaut that continues to flood global markets.
The paradox is complete: the export machine hums, profits accumulate, trade surpluses swell — and the workers who power all of it are left behind. It is not incidental. It is structural. As China Labor Watch’s executive director Li Qiang argued in January 2026, China’s decisive competitive advantage lies in its weak labor protections, and it is now exporting this low-rights model globally — a race to the bottom dressed in the language of development.
Nowhere is this more starkly illustrated than in the platform economy. According to the All-China Federation of Trade Unions, the number of workers in “new forms of employment” — overwhelmingly gig-economy roles with minimal protections — surpassed 84 million in 2024, representing 21 percent of the total workforce. Among food-delivery riders on Meituan alone, nearly half worked fewer than 30 days per year, pointing to an army of precarious, intermittent laborers with no benefits, no unions, and no recourse. As of 2022, at least 70,000 of these riders held master’s degrees.
996, Involution, and the Vocabulary of Exhaustion
China’s young workers have developed their own lexicon for what Marxist theory would call surplus extraction. The “996” schedule — work from 9 a.m. to 9 p.m., six days a week — became the defining norm of China’s tech industry, a practice that a joint study by Chinese and Australian universities, published in October 2025, described as “modern labour slavery,” directly linking it to chronic burnout, mental health decline, and fertility postponement. Officially illegal under China’s Labor Law, 996 persists through what labor researchers describe as “informal-flexible despotism” — the unspoken threat of unemployment for those who refuse to comply.
The cultural response has been the phenomenon of neijuan, or “involution” — the sense of being trapped in relentless, self-defeating competition that produces no advancement. As youth unemployment reached 17.8% in July 2025 — six times the official urban headline rate — and this year’s graduating class of 12.22 million enters a trade-war-disrupted economy also disrupted by artificial intelligence, neijuan has metastasized from internet slang into political critique. Its counterpart, tangping — “lie flat” — is the passive resistance of those who have concluded that the system is designed not to reward their labor but to extract it.
These are not marginal, youth-culture curiosities. They are symptoms of a structural contradiction at the heart of the Chinese political economy: a party that claims to represent workers presiding over conditions that would have warranted a chapter in Volume I of Das Kapital.
Xi Jinping’s Marxist Revival: Signal or Noise?
Against this backdrop, Xi Jinping’s periodic invocations of Marxist rhetoric acquire a particular ambiguity. His “common prosperity” campaign, elevated in August 2021 as “an essential requirement of socialism,” set targets to reduce the Gini coefficient from 0.47 toward 0.40 by 2025 and 0.35 by 2035. The crackdown on tech giants — Alibaba, DiDi, Meituan — was framed in language recognizable to any student of Marx: reining in monopoly capital, redistributing to the people.
Yet the common prosperity campaign has conspicuously failed to deliver on its core promise. The Gini has not meaningfully declined. Minimum wages, while rising nominally, remain well below levels that would allow Chinese households to become the robust consumers the economy urgently needs. The crackdown on tech billionaires proved more politically convenient than structurally transformative: it punished visible wealth without redistributing it, and it chilled private investment without replacing it with workers’ power.
As CSIS’s Interpret: China project has noted, the common prosperity campaign’s success will ultimately be judged not by economics but by whether it can “maintain social harmony and stability” — which is to say, by whether the CCP can suppress the political consequences of inequality without addressing its material causes. That is not Marxism. That is its managed inverse.
The Overproduction Trap: What Karl Marx Got Right, and What China Ignored
Marx’s central warning in Capital was not simply about exploitation in isolation. It was about the systemic consequences of treating workers purely as inputs: overproduction crises, demand collapse, competitive race-to-the-bottom dynamics that ultimately undermine the capitalist system itself. He called it “the epidemic of overproduction.”
China in 2026 is exhibiting textbook symptoms. The electric vehicle sector’s median net profit margin collapsed to just 0.83% in 2024, down from 2.7% in 2019, as brutal price wars among BYD, Tesla, and dozens of domestic brands hollowed out margins. The solar manufacturing industry lost $40 billion to overcapacity. Steel, cement, food delivery — sector after sector is caught in the deflationary spiral that Chinese policymakers euphemistically call “involution” but that economists recognize as classic overproduction: too much supply chasing too little domestic demand, because workers who make the goods cannot afford to buy them.
The CCP’s own theorists have identified the root: household consumption remains stubbornly low as a share of GDP — hovering near 37-38 percent, compared with 68 percent in the United States and over 50 percent in most developed economies. The Foreign Affairs analysis draws the Henry Ford parallel with precision: Ford famously raised his workers’ wages so they could afford his cars. China’s economy does the reverse — it suppresses wages to make exports price-competitive, and then wonders why domestic demand refuses to ignite.
The Global Stakes: What China’s Labor Model Exports
The implications extend well beyond China’s borders. As China Labor Watch has documented, Beijing’s manufacturing dominance is now being actively exported through Belt and Road projects, industrial parks across Africa and Southeast Asia, and Chinese-owned factories in countries from Ethiopia to Cambodia. The labor conditions travel with the capital. A race to the bottom in labor rights is a deliberate feature, not an accident, of China’s industrial model — and it sets the competitive benchmark to which other manufacturing nations must respond or decline.
For Western policymakers, this reframes the trade debate. Tariffs address the symptom — price-competitive imports — without touching the cause, which is systematic wage compression underwritten by a state that suppresses independent unions, restricts collective bargaining, and classifies labor organizing as a political threat. The US-China trade war’s escalating tariff regime, which has seen duties on Chinese goods reach 145 percent, is economically disruptive for both sides. But it does not change the structural reality that China’s manufacturing advantage is built on a foundation that would have been recognizable to Friedrich Engels touring Manchester in 1845.
Conclusion: The Haunting of Deng Liqun
History’s ironies rarely arrive cleanly. Deng Liqun was, in many respects, a problematic figure — a hardliner who helped orchestrate ideological campaigns that silenced liberal reformers and contributed to the atmosphere of repression that culminated in Tiananmen. His Marxism was often a political instrument as much as a philosophical commitment.
But on this one point, his analysis was structurally sound: a Communist Party that permits unlimited private capital accumulation without empowering workers to claim a proportionate share of the value they create is not transcending Marx. It is fulfilling him. The exploitation he predicted has arrived — not in the form of Victorian factory owners with top hats, but in the form of platform algorithms calculating delivery routes to the nearest yuan, 996 schedules enforced through the threat of precarity, and a gig economy that has absorbed 84 million workers without offering a single one a union card.
Xi Jinping’s “common prosperity” rhetorical architecture is vast and elaborate. The material delivery, forty years after Deng Liqun’s warnings, remains insufficient. China’s economy runs on labor exploitation. Marx would have recognized it immediately. He would have found it almost unremarkable. What would have astonished him — what should astonish us — is that the party invoking his name is the one enforcing it.
Discover more from The Economy
Subscribe to get the latest posts sent to your email.
-

 Markets & Finance3 months ago
Top 15 Stocks for Investment in 2026 in PSX: Your Complete Guide to Pakistan’s Best Investment Opportunities
-

 Analysis2 months ago
Brazil’s Rare Earth Race: US, EU, and China Compete for Critical Minerals as Tensions Rise
-

 Banks3 months ago
Best Investments in Pakistan 2026: Top 10 Low-Price Shares and Long-Term Picks for the PSX
-

 Investment3 months ago
Top 10 Mutual Fund Managers in Pakistan for Investment in 2026: A Comprehensive Guide for Optimal Returns
-

 Analysis2 months ago
Top 10 Stocks for Investment in PSX for Quick Returns in 2026
-

 Asia3 months ago
China’s 50% Domestic Equipment Rule: The Semiconductor Mandate Reshaping Global Tech
-

 Global Economy3 months ago
Pakistan’s Export Goldmine: 10 Game-Changing Markets Where Pakistani Businesses Are Winning Big in 2025
-

 Global Economy3 months ago
15 Most Lucrative Sectors for Investment in Pakistan: A 2025 Data-Driven Analysis