
Markets & Finance
The $14 Trillion Paradox: Why BlackRock’s Record AUM and Crashing Profits Signal a Global Economic Shift

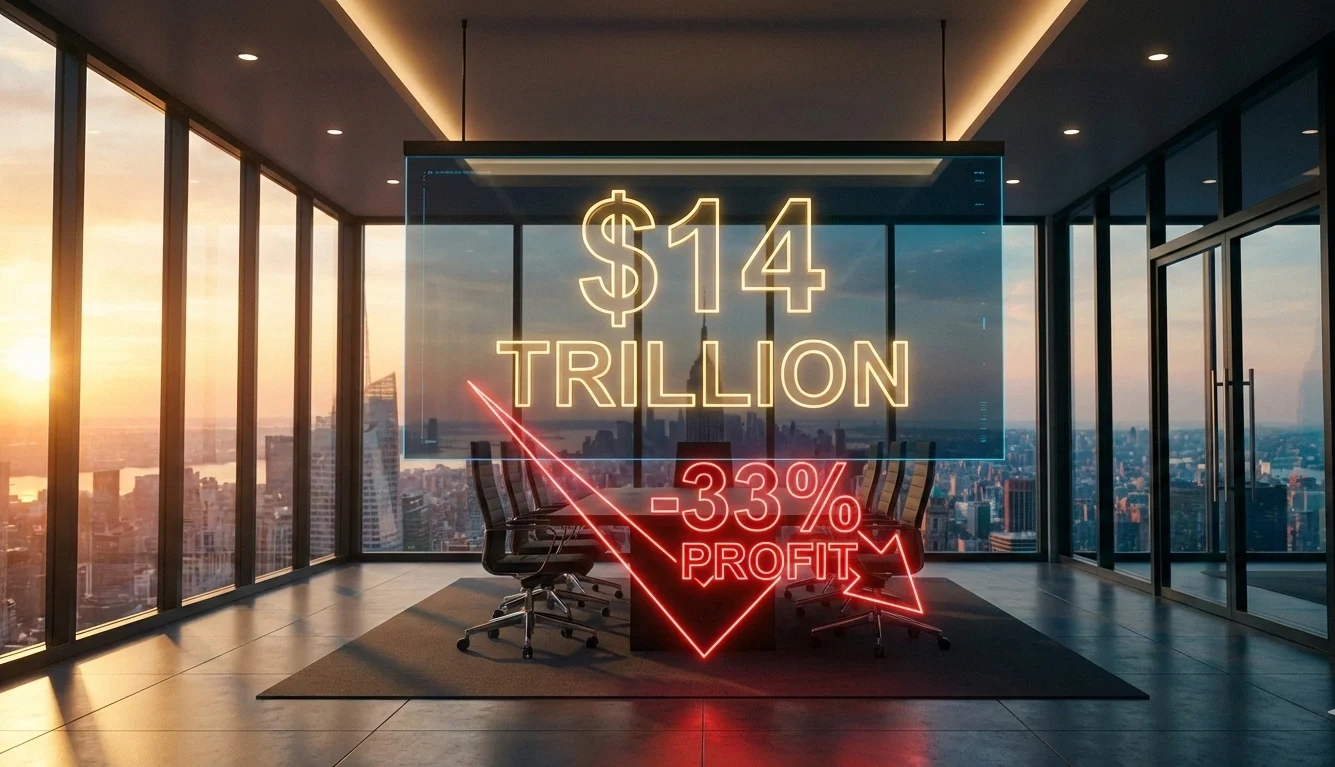
In global finance, numbers often tell two conflicting stories. Today, BlackRock (NYSE: BLK) released its Q4 2025 earnings, and the headlines are a masterclass in cognitive dissonance. On one hand, Larry Fink’s empire has officially crossed the $14 trillion Assets Under Management (AUM) threshold—a figure so vast it exceeds the GDP of every nation on Earth except the U.S. and China.
On the other hand, the firm’s net income plummeted by 33% year-over-year to $1.13 billion.
To the casual observer, this looks like a leak in the hull. To a Political Economy Analyst, it’s a calculated pivot. We are witnessing the “Great Compression” of the asset management industry, where the race to the bottom in fees is forcing the world’s largest liquidity provider to cannibalize its short-term profits to buy a long-term seat at the “Private Markets” table.
1. The AUM Illusion: Scaling to $14 Trillion in a Low-Yield World
The $14 trillion milestone is a testament to the relentless “flywheel” effect of passive index dominance. In 2025, BlackRock saw record quarterly net inflows of $342 billion, driven largely by the iShares ETF engine.
However, AUM is a vanity metric if the operating margins are under siege. The reality of Institutional Liquidity 2026 is that traditional beta (market tracking) has become a commodity. When everyone can own the S&P 500 for nearly zero basis points, the “World’s Largest Money Manager” title becomes a burden of scale.
Why the AUM Record Matters:
- Geopolitical Leverage: With $14T, BlackRock isn’t just a firm; it’s a sovereign-level entity.
- Data Supremacy: Its Aladdin platform now processes more data than most national central banks.
- The Passive Trap: As more capital flows into indexes, market discovery weakens, creating the very volatility BlackRock’s active “Alts” team hopes to exploit.
2. The 33% Profit Dive: Empire Building Isn’t Cheap
The most jarring figure in the report is the 33% drop in net income. In an era where the S&P 500 grew 16% in 2025, how does the house lose money?
The answer lies in Strategic M&A and Integration Costs. Throughout 2024 and 2025, BlackRock went on a shopping spree, acquiring Global Infrastructure Partners (GIP) and HPS Investment Partners. These weren’t just “bolt-on” acquisitions; they were a total re-engineering of the firm’s DNA.
“We are transitioning from being a provider of index exposure to a provider of whole-portfolio solutions,” Larry Fink noted in his2025 Shareholder Letter Analysis.
This “one-time” income hit is the price of admission to Private Credit and Infrastructure. BlackRock is betting that the future of profit isn’t in stocks—it’s in data centers, power grids, and private loans that bypass the traditional banking system.
3. The Political Economy of “Private Assets in Public Hands”
From a political economy perspective, BlackRock’s 2025 performance signals the de-banking of the global economy. As traditional banks face tighter capital requirements under Basel IV, BlackRock is stepping in as the “Shadow Lender of Last Resort.”
With $423 billion in alternative assets, the firm is positioning itself to fund the global AI infrastructure boom. This creates a new power dynamic: Institutional Liquidity vs. State Sovereignty. When a single firm manages $14 trillion, its “Investment Stewardship” guidelines carry more weight than many national environmental or labor laws.
4. The 2026 Outlook: Margin Compression vs. Tokenization
As we look toward 2026, the Asset Management Margin Compression trend will likely accelerate. To combat this, keep an eye on two “Platinum-level” shifts:
- The 50/30/20 Portfolio: Fink is successfully moving institutions away from the 60/40 split into a model that allocates 20% to private markets. This is where the 33% profit dip will be recouped—private market fees are 5x to 10x higher than ETF fees.
- Asset Tokenization: By moving real-world assets onto the blockchain, BlackRock aims to slash settlement costs. If they can tokenize even 1% of their $14T AUM, the operational efficiencies would send net income to record highs by 2027.
Verdict: A “Buy” on the Dip of the Century?
BlackRock’s 33% profit drop is a “red herring” for the uninformed. For the Technical SEO Specialist and the Economic Analyst, it is a signal of a massive capital reallocation. They are sacrificing the “Old World” (low-margin ETFs) to dominate the “New World” (high-margin infrastructure and private credit).
The Bottom Line: Don’t fear the 33% drop. Respect the $14 trillion reach.
Discover more from The Economy
Subscribe to get the latest posts sent to your email.


Markets & Finance
Indonesia’s Confidence Problem: Record Investment, a Sinking Rupiah, and a Widening Credibility Gap
Introduction
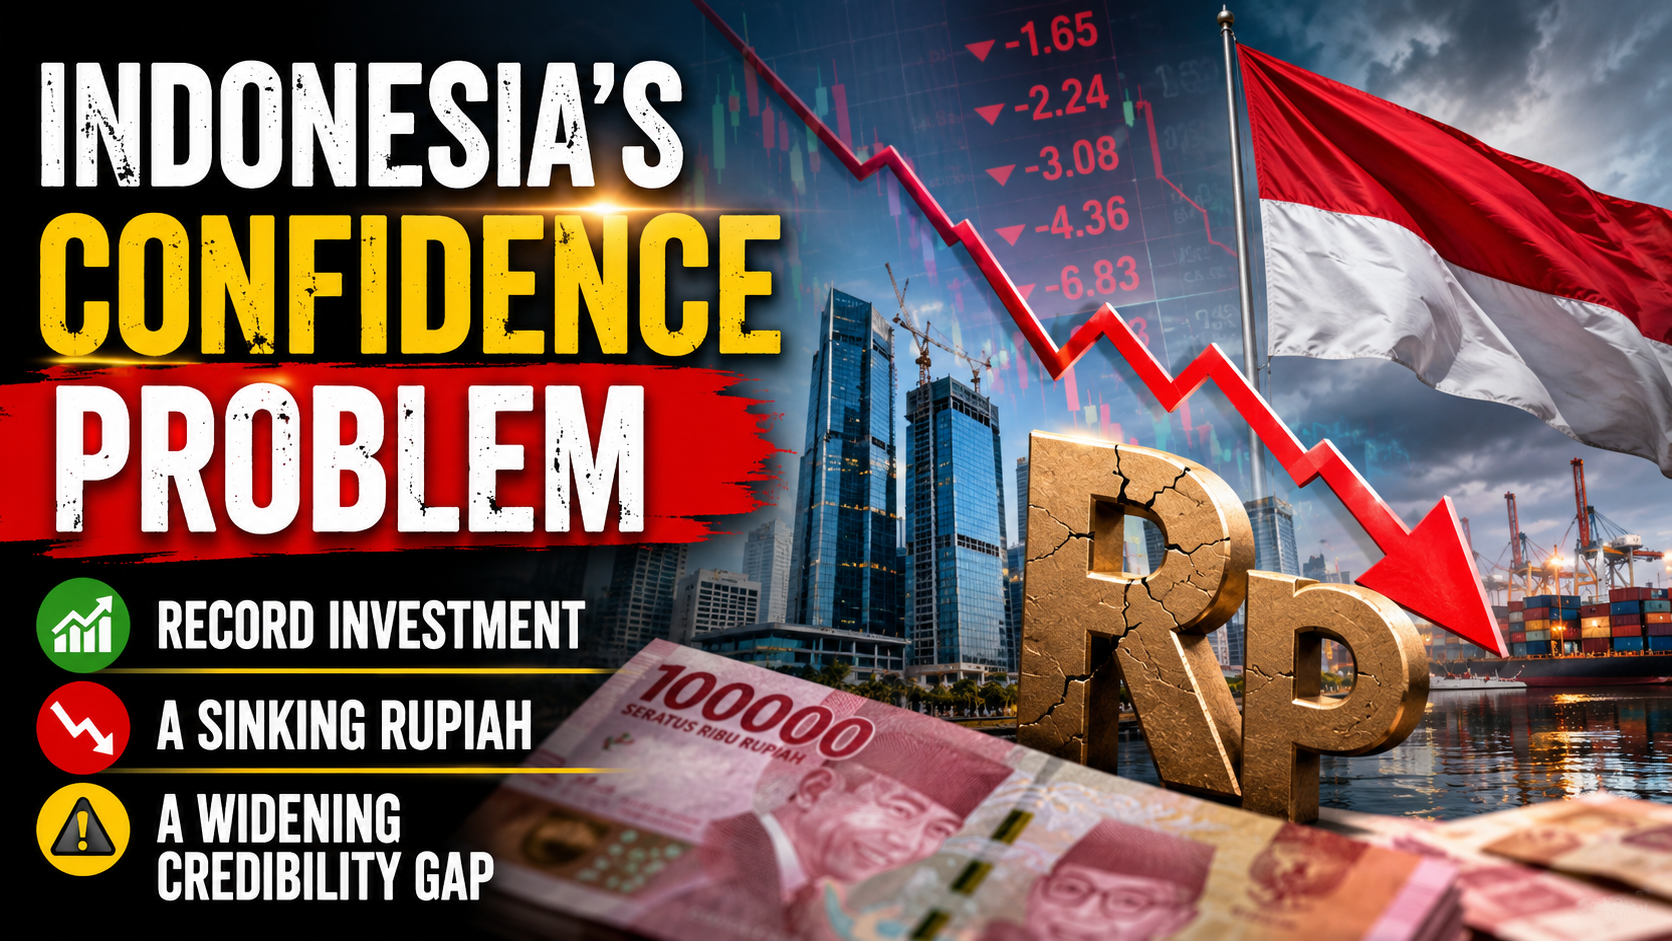
Indonesia’s economic story in mid-2026 is one of genuine contradiction. On one hand, the government posted a record Rp1,010.6 trillion ($56.1 billion) in realized investment for the first half of the year, up 7.2% from a year earlier and on pace to hit its full-year target (Antara News). On the other, the rupiah has been sliding toward Rp18,000 per US dollar, the state budget deficit has widened, and a growing chorus of domestic commentators is warning that Indonesia risks permanently losing what one Jakarta Post analysis called “the vital game of investor confidence” (The Jakarta Post).
The Investment Numbers Look Genuinely Strong
Indonesia’s Investment and Downstreaming Minister Rosan Roeslani reported that first-half 2026 investment realization reached 49.5% of the government’s full-year target of Rp2,041.3 trillion, creating 1.44 million jobs — a 15% increase in job creation compared to the first half of 2025 (Antara News). Domestic and foreign investment remained almost perfectly balanced, with foreign direct investment reaching Rp507.6 trillion (50.2% of the total) against Rp502.9 trillion in domestic investment (Antara News). Notably, investment outside the country’s most populous island, Java, exceeded inflows into Java itself for the first time in this dataset — Rp507.8 trillion versus Rp502.8 trillion — supporting the government’s long-standing goal of more balanced regional development (Antara News).
Singapore remained by far Indonesia’s largest source of foreign capital at $8.8 billion, followed by Hong Kong ($7.6 billion), China ($3.9 billion), Japan ($1.9 billion) and the United States ($1.7 billion) — together accounting for roughly 77.8% of all foreign direct investment into the country (Antara News). Second-quarter investment specifically rose 7.1% year-on-year to Rp511.8 trillion, with Minister Roeslani noting that investor commitment to Indonesia has held up despite significant “geopolitical and geoeconomic challenges” globally (The Jakarta Post).
But the Pace Is Slowing, and the Currency Is Under Pressure
Despite the record absolute figures, the Jakarta Post notes that investment growth in 2026 has been running at a distinctly slower pace than the country achieved in recent prior years, even as it remains on track to hit the annual target (The Jakarta Post). Meanwhile Bank Indonesia has had to actively respond to renewed rupiah weakness, attributing the currency’s slide toward Rp18,000 per dollar to hawkish signals from Federal Reserve officials and broader movements in the US dollar index (Samuel Sekuritas Daily Economic Insights). The state budget deficit reached Rp196.5 trillion in the first half of 2026, equivalent to 0.76% of GDP (Samuel Sekuritas Daily Economic Insights).
There has been some relief more recently: a 27.4% surge in second-quarter foreign direct investment helped strengthen the rupiah, with USD/IDR trading around 17,990 in mid-July as softer US inflation data reduced the odds of a near-term Fed hike (TMGM). Even so, the US dollar has retained broad support from escalating Middle East geopolitical tensions, keeping the rupiah’s recovery fragile rather than decisive (TMGM).
Why Growth Forecasts Keep Getting Trimmed
International lenders have grown more cautious about Indonesia’s growth trajectory for 2026. The OECD has held its outlook at 4.7% year-on-year — a clear deterioration from 2025’s realized 5.1% growth — with most major lending institutions clustering around the 5.0% threshold, implying a loss of momentum after Indonesia posted 5.61% growth in the first quarter of 2026 alone (Indonesia Investments). The deceleration is attributed to a softening labor market, weakening consumer confidence, and contracting retail sales in the second quarter (Indonesia Investments). High global oil prices are compounding the pressure on the government’s fiscal balance, since Indonesia continues to subsidize a significant portion of domestically sold fuel — a policy that transmits global energy volatility directly into the state budget rather than shielding consumers from it entirely (Indonesia Investments).
The Deeper Warning: A Confidence Problem, Not Just a Cyclical One
The most pointed recent critique comes from domestic commentary rather than foreign analysts. A Jakarta Post opinion piece published July 20, 2026 argues Indonesia must halt what it describes as erratic policymaking and institutional erosion before the country permanently damages its standing in the “vital game of investor confidence,” framing the rupiah’s weakness and shifting global market conditions as symptoms of a deeper credibility issue rather than purely external shocks (The Jakarta Post). That framing matters for how the strong headline investment numbers should be read: capital is still arriving, but the terms on which it arrives, and the confidence with which it stays, are visibly more fragile than the raw totals suggest.
Strategic Bright Spots
Not every recent development points toward strain. India secured access to Indonesian critical minerals through several major agreements signed during Prime Minister Narendra Modi’s visit to Jakarta, part of a broader push by Indonesia to leverage its resource base for deeper strategic partnerships (Samuel Sekuritas Daily Economic Insights). Indonesia is also pursuing energy independence through B50 biodiesel and compressed natural gas development, aimed explicitly at reducing reliance on imported LPG — a structural move that, if successful, would reduce exactly the kind of imported-energy vulnerability now straining the budget (Samuel Sekuritas Daily Economic Insights).
Key Takeaways
- Indonesia posted a record Rp1,010.6 trillion ($56.1 billion) in H1 2026 investment, up 7.2% year-on-year, with foreign and domestic capital nearly evenly split.
- The rupiah has weakened toward Rp18,000 per dollar on hawkish Fed signals, though a Q2 FDI surge has since provided partial relief.
- International lenders have trimmed Indonesia’s 2026 growth outlook to around 4.7–5.0%, down from 5.1% realized growth in 2025.
- The H1 2026 budget deficit reached 0.76% of GDP, pressured by continued fuel subsidies amid high global oil prices.
- Domestic commentary increasingly frames Indonesia’s challenge as a credibility and policymaking issue, not merely a cyclical external shock.
Sources: Antara News, The Jakarta Post — Investment Growth, The Jakarta Post — Confidence Game, Samuel Sekuritas Daily Economic Insights, Indonesia Investments, TMGM
Discover more from The Economy
Subscribe to get the latest posts sent to your email.
AI
Anthropic Offers Up to $600,000 Salary for Critical IPO Role as AI Giant Prepares for Wall Street Debut

As anticipation builds around what could become one of the largest technology listings in recent history, artificial intelligence company Anthropic is offering an eye-catching base salary of up to $600,000 for a key investor relations position, underscoring how seriously the company is preparing for its expected initial public offering (IPO).
The San Francisco-based AI developer, best known for its Claude family of AI models, has posted a vacancy for a Director of Investor Relations with a base compensation ranging from $425,000 to $600,000, making it one of the most strategically important hires ahead of its anticipated public market debut. According to a report by Business Insider, the company is expected to pursue an IPO as early as fall 2026, following a surge in valuation and extraordinary revenue growth.
A Strategic Hire Ahead of a Landmark IPO
The investor relations director will be responsible for shaping Anthropic’s investment narrative, maintaining relationships with institutional investors, and helping Wall Street understand the company’s long-term strategy and financial outlook.
According to the job description, the successful candidate will:
- Develop Anthropic’s investment story for public markets.
- Serve as a primary liaison between executive leadership and investors.
- Analyze AI industry developments and communicate their financial implications.
- Support earnings communications, investor presentations, and regulatory disclosures.
- Work closely with the company’s newly appointed Head of Investor Relations.
The position reports into Kenneth Dorell, who joined Anthropic earlier this year after previously leading investor relations at Meta. His appointment reflects the company’s broader effort to build an experienced leadership team capable of navigating public market expectations.
Why Investor Relations Matters More Than Ever
While investor relations roles are common among public companies, they become especially significant during the transition from private to public ownership.
For Anthropic, the challenge extends beyond explaining quarterly financial results. The company must convince investors that its massive investments in AI research, computing infrastructure, and talent acquisition can translate into sustainable long-term growth.
Unlike many traditional software companies, Anthropic operates as a public benefit corporation, meaning it is legally committed to balancing shareholder returns with the responsible development of advanced artificial intelligence. The company’s official mission emphasizes building reliable, interpretable, and safe AI systems for the long-term benefit of society, according to the company’s website.
This dual mandate creates a unique communication challenge for investor relations executives, who must explain how commercial success aligns with responsible AI development.
AI Boom Drives Extraordinary Compensation
The offered salary highlights the increasingly fierce competition for executive talent across the AI industry.
Although a base salary of $600,000 is exceptional by conventional corporate standards, compensation at leading AI companies frequently includes stock awards, bonuses, and long-term incentives that can substantially increase total earnings.
Anthropic has become one of Silicon Valley’s fastest-growing companies, with demand for its enterprise AI products accelerating rapidly. The company’s coding assistant, Claude Code, has gained significant traction among software developers and businesses seeking AI-powered programming tools.
Recent reporting indicates that Anthropic’s annualized revenue has expanded dramatically as enterprise adoption of generative AI continues to accelerate, strengthening investor expectations ahead of a potential IPO.https://www.businessinsider.com/anthropic-ipo-hiring-investor-relations-director-2026-7
Preparing Wall Street for an Unconventional AI Company
Anthropic’s investor relations team faces a unique assignment.
Unlike mature technology companies with decades of operating history, frontier AI companies remain difficult to value because they invest billions of dollars annually in computing infrastructure, model training, and research talent while operating in a rapidly evolving competitive environment.
Potential investors will likely seek clarity on several key questions:
- Future profitability.
- Infrastructure spending.
- AI safety governance.
- Regulatory risks.
- Competitive positioning against OpenAI, Google, Meta, and xAI.
- Long-term monetization strategy.
The investor relations director will play a central role in translating these complex issues into a compelling investment thesis.
Strong Financial Momentum Strengthens IPO Expectations
Anthropic has emerged as one of the world’s most valuable privately held AI companies.
Backed by major investors including Amazon and Google, the company has attracted substantial funding over the past several years while rapidly expanding its enterprise customer base.
Its Claude models have become widely used for coding, research, enterprise automation, and business productivity, placing Anthropic among the strongest competitors to OpenAI.
The company’s remarkable financial momentum has fueled growing speculation that its IPO could become one of the defining public offerings of the AI era.
Competition for AI Talent Intensifies
The generous compensation package also reflects the broader battle for experienced executives across the artificial intelligence sector.
Companies developing frontier AI systems increasingly compete not only for elite researchers and engineers but also for specialists in finance, public markets, communications, and regulatory affairs.
As valuations continue climbing into the hundreds of billions of dollars, experienced executives capable of guiding companies through IPOs have become increasingly valuable.
Industry observers expect executive compensation across AI firms to remain elevated as competition intensifies.
The Bigger Picture
Anthropic’s decision to offer a base salary reaching $600,000 for an investor relations executive sends a clear signal that preparations for public markets are accelerating.
Beyond the headline salary, the recruitment reflects a broader transformation within the AI industry. As companies mature from venture-backed startups into global technology leaders, success increasingly depends not only on breakthrough research but also on convincing investors that enormous AI investments can produce sustainable long-term returns.
If Anthropic proceeds with its widely anticipated IPO, this investor relations hire could become one of the most influential behind-the-scenes roles in shaping how one of the world’s most valuable AI companies is introduced to public investors.
Sources
- Business Insider, Anthropic is offering a $600,000 salary for one of its most important IPO hires: https://www.businessinsider.com/anthropic-ipo-hiring-investor-relations-director-2026-7
- Anthropic, Official Company Website: https://www.anthropic.com/
Discover more from The Economy
Subscribe to get the latest posts sent to your email.
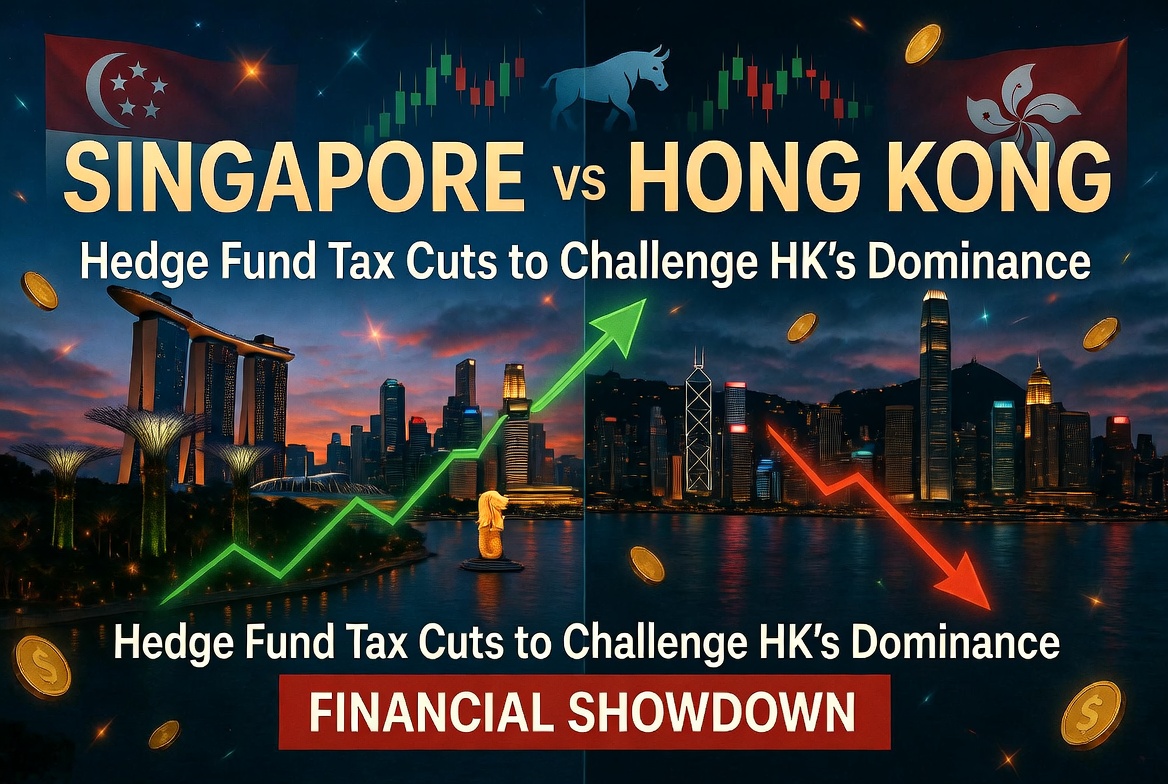
Singapore is considering fresh tax incentives for hedge fund managers as it seeks to reinforce its position as Asia’s leading asset management hub amid an increasingly aggressive push by Hong Kong to attract global investment firms.
The discussions mark the latest chapter in an intensifying competition between Asia’s two premier financial centres, where governments are using tax policy, regulatory reforms, and business-friendly measures to win over international capital and top financial talent.
Singapore Examines New Incentives
According to recent reports, Singapore’s financial authorities have been consulting hedge funds and investment firms on possible measures to strengthen the country’s competitiveness.
Among the proposals under discussion are:
- Reducing tax rates applicable to eligible fund managers.
- Enhancing existing tax incentive schemes.
- Lowering operational costs for investment firms.
- Expanding incentives designed to attract new hedge funds to establish regional headquarters in Singapore.
While no final decision has been announced, the consultations suggest policymakers are carefully evaluating how to respond to shifting competitive pressures across Asia’s financial landscape.
Hong Kong Raises the Stakes
Singapore’s review comes only months after Hong Kong unveiled plans to broaden its own preferential tax regime for investment managers.
Hong Kong is seeking to extend tax benefits beyond traditional private equity structures, making zero-tax treatment on certain carried interest and investment profits available to a wider range of asset management activities.
The reforms are intended to encourage hedge funds, family offices and alternative investment firms to expand their operations in the city.
A Renewed Battle for Financial Leadership
For decades, Singapore and Hong Kong have competed for dominance as Asia’s gateway for global finance.
During the COVID-19 pandemic, Singapore gained momentum as several multinational firms relocated staff due to Hong Kong’s prolonged travel restrictions and political uncertainty.
Today, however, Hong Kong is mounting a determined comeback by introducing regulatory reforms and tax incentives aimed at reversing that trend.
Industry analysts say both cities now recognize that maintaining an attractive tax environment is essential in an industry where investment firms can relocate operations relatively quickly.
Why Hedge Funds Matter
Hedge funds contribute significantly beyond investment returns.
Their presence creates demand for:
- Investment banking services
- Legal and accounting firms
- Prime brokerage operations
- Technology providers
- Financial data companies
- Compliance specialists
The concentration of hedge funds also strengthens a city’s broader financial ecosystem, making it more attractive for institutional investors, sovereign wealth funds and family offices.
This explains why governments are increasingly willing to compete through targeted tax policies rather than broad corporate tax reductions.
Political and Fiscal Considerations
Although Singapore is widely regarded as one of the world’s most business-friendly economies, policymakers must balance competitiveness with domestic priorities.
Introducing additional tax breaks could face scrutiny at a time when residents remain sensitive to issues such as living costs and government spending.
As a result, analysts believe Singapore may opt for more targeted incentives, such as reducing compliance costs or refining existing tax schemes, instead of implementing sweeping tax cuts.
Industry Response
Investment professionals have welcomed the government’s willingness to engage with the sector.
Many argue that certainty, regulatory stability and efficient administration remain just as important as tax rates when deciding where to establish investment operations.
Some market participants also note that Singapore already enjoys advantages including political stability, strong rule of law, sophisticated financial infrastructure and an established ecosystem of global asset managers.
These strengths could help the city retain its leadership even if Hong Kong introduces more generous tax incentives.
Implications for Global Investors
The growing rivalry between Singapore and Hong Kong is expected to benefit global investors.
Competition between the two financial centres could lead to:
- Lower operating costs for investment firms.
- More attractive tax structures.
- Greater innovation in financial regulation.
- Increased investment flows into Asia.
- Expanded employment opportunities across financial services.
As institutional capital continues shifting toward Asian markets, both cities are positioning themselves as the preferred regional headquarters for international hedge funds and alternative asset managers.
Outlook
Singapore has not yet confirmed whether new tax measures will be implemented, but ongoing consultations indicate that policymakers are actively considering options.
The outcome could shape the competitive balance between Asia’s two largest international financial hubs for years to come.
With Hong Kong accelerating reforms and Singapore evaluating its response, the contest for global hedge fund capital is entering a new phase, one that is likely to influence investment decisions across the region and reinforce Asia’s growing importance in international finance.
Sources
- Financial Times. “Singapore weighs hedge fund tax cuts to rival Hong Kong.” https://www.ft.com/content/d3221c90-c2a4-4bdd-8e0d-6e069bf0ca25
- Reuters. “Hong Kong close to proposing tax cuts to lure asset and wealth managers.” https://www.reuters.com/world/asia-pacific/hong-kong-plans-tax-cuts-asset-managers-ft-reports-2026-03-26/
Discover more from The Economy
Subscribe to get the latest posts sent to your email.

Gulf Capital Retreat From Pakistan 2026: UAE Loan Freeze & What It Means

Pakistan’s Most Reliable Export Is Its People: Remittances Hit $41.6 Billion, Overtaking Total Exports

Indonesia’s Confidence Problem: Record Investment, a Sinking Rupiah, and a Widening Credibility Gap

Down But Not Out: Inside the Slow Sinking of Russia’s War Economy

China’s Growth Slips to a Four-Year Low: Why Beijing Still Won’t Pull the Stimulus Trigger

The Johor-Singapore Corridor: How Malaysia Became Southeast Asia’s AI Infrastructure Powerhouse

Canada’s Economy ‘On Pause’: Inside the CUSMA Deadline That Passed Without a Deal

Dubai’s Millionaire Magnet: How the UAE Turned Middle East Turmoil Into a Capital Safe-Haven Boom

Britain’s Sixth Prime Minister in a Decade: What Starmer’s Exit Means for Gilts, Sterling and Your Portfolio

Anthropic Offers Up to $600,000 Salary for Critical IPO Role as AI Giant Prepares for Wall Street Debut

EU Readies Crisis Team for Potential China Rare Earths Stand-Off as Supply Chain Risks Mount

Singapore Weighs Hedge Fund Tax Cuts to Counter Hong Kong’s Growing Financial Challenge

Facebook and Instagram Experience Global Outage

Inside the $1 Billion Tap-to-Pay Fraud Rings Targeting Banks and Retailers

Carry Trade Unwind 2026: How the Yen’s Snapback Triggered a Global Margin Call

AI Bubble Warning 2026: Why BIS, IMF and Bank of England Fear a Market Crash

BRICS De‑Dollarization Strategy Takes Shape with $15 Billion Local‑Currency Push

Male Labor Force Participation Rate 2026: Why Men Are Leaving & Economic Impact

Russia Bans Diesel Exports 2026: Global Fuel Market Impact Explained

The AI Super Bubble Is Ready to Burst

Strait of Hormuz Blockade 2026: Oil Prices Surge 9% as US-Iran Conflict Reignites

IMF Cuts Pakistan Growth Forecast, Raises Inflation to 8.4%

Private Credit Warning: Most BDCs Turn Unprofitable in 2026, Reuters Finds
Gulf Capital Retreat From Pakistan 2026: UAE Loan Freeze & What It Means

India Economic Rise 2026: How the Subcontinent Toppled Japan

Bitcoin $150k Milestone Achieved as US Sovereign Crypto Pivot Looms

Strait of Hormuz 2026: Why Markets Still Don’t Trust It’s Open

Chipmakers Just Lost 6.7% in Two Days: Inside the Great AI Trade Rotation
-

 Markets & Finance7 months ago
Top 15 Stocks for Investment in 2026 in PSX: Your Complete Guide to Pakistan’s Best Investment Opportunities
-

 Analysis5 months ago
Johor’s Investment Boom: The Hidden Costs Behind Malaysia’s Most Ambitious Economic Surge
-

 Analysis5 months ago
Top 10 Stocks for Investment in PSX for Quick Returns in 2026
-

 Analysis6 months ago
Brazil’s Rare Earth Race: US, EU, and China Compete for Critical Minerals as Tensions Rise
-

 Banks6 months ago
Best Investments in Pakistan 2026: Top 10 Low-Price Shares and Long-Term Picks for the PSX
-

 Investment7 months ago
Top 10 Mutual Fund Managers in Pakistan for Investment in 2026: A Comprehensive Guide for Optimal Returns
-

 Global Economy7 months ago
15 Most Lucrative Sectors for Investment in Pakistan: A 2025 Data-Driven Analysis
-

 Global Economy7 months ago
Pakistan’s Export Goldmine: 10 Game-Changing Markets Where Pakistani Businesses Are Winning Big in 2025