
Analysis
America Will Come to Regret Its War on Taxes. Lately, Democrats Have Joined the Charge.

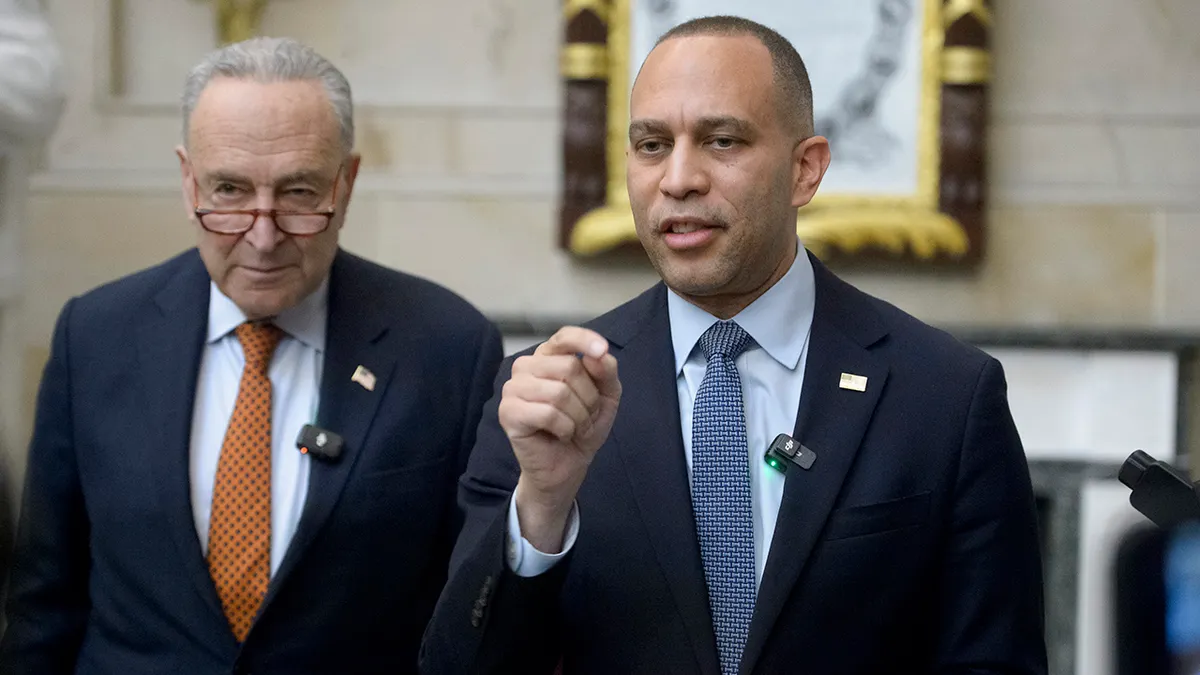
A shared political appetite for punishing fiscal policy is quietly eroding the foundations of American economic dynamism — and the bill is coming due.
The Bipartisan Consensus Nobody Wants to Admit
There is a peculiar silence at the center of American fiscal discourse. Politicians of every stripe have discovered that the most reliable applause line in any town hall, any fundraiser, any cable news segment, is some variation of the same promise: someone else will pay. Cut taxes on this constituency. Raise them on that one. The details change with the political season; the underlying logic — that prosperity can be legislated by picking the right winners and losers — never does.
For decades, the “war on taxes” was assumed to be a Republican pathology: supply-side zealotry dressed up in Laffer Curve charts, a theology descended from Reagan and codified in every subsequent GOP platform. But something significant has shifted. Democrats, long the party of public investment and progressive redistribution, have increasingly embraced a mirror-image version of the same fiscal populism — one that punishes capital, discourages corporate risk-taking, and promises to fund an ever-expanding social state on the backs of a narrowing sliver of the economy. The names change; the economic consequences do not.
America is conducting, in real time, a grand experiment in what happens when both parties stop believing in the unglamorous, politically unrewarding work of building a broad, competitive, internationally benchmarked tax base. The results, already visible in the data, are quietly alarming. The reckoning, when it arrives, will be loud.
A Brief History of the Thirty-Year Tax War
To understand where America is, it helps to understand where it has been. The modern war on taxes has two distinct fronts — and they have never been more active simultaneously.
The first front opened with Ronald Reagan’s Economic Recovery Tax Act of 1981, which slashed the top marginal income tax rate from 70 percent to 50 percent, and his subsequent 1986 reform that brought it further to 28 percent. The intellectual architecture — that lower rates would unleash private investment, broaden the tax base, and eventually pay for themselves — was elegant, seductive, and partially correct. Growth did accelerate in the mid-1980s; revenues did recover. But the full Laffer Curve promise, that tax cuts would be self-financing, proved durable as mythology and elusive as policy. The Congressional Budget Office has consistently found that major tax reductions generate significant revenue losses even after accounting for macroeconomic feedback effects, typically recovering no more than 20–25 cents on the dollar.
The second front, less examined, is the Democratic one. It did not begin with hostility to revenue — quite the opposite. The party of Franklin Roosevelt and Lyndon Johnson understood that ambitious government required ambitious financing. What shifted, gradually and then rapidly, was the political calculus. As inequality widened after 2000, and as the 2008 financial crisis delegitimized much of the financial establishment, progressive politics increasingly turned punitive. The goal shifted subtly from raising revenue to making the wealthy pay — and those are not always the same objective.
The Surprising Democratic Convergence
The turning point is easier to pinpoint in retrospect. Following the passage of the Tax Cuts and Jobs Act of 2017, Democrats rightly criticized the legislation’s regressive structure and its contribution to the federal deficit — which widened by approximately $1.9 trillion over ten years, according to the Tax Policy Center. But the party’s response was not to propose a more efficient, growth-compatible alternative. It was, increasingly, to simply invert the TCJA’s priorities: higher corporate rates, higher capital gains taxes, expanded wealth levies, and a proliferating series of targeted surcharges.
By 2024, the progressive policy agenda included proposals for a corporate minimum tax, a billionaire’s income tax on unrealized capital gains, expanded estate taxes, and a surtax on high earners that would push the effective federal rate on investment income in some brackets above 40 percent — before state taxes. Combined rates in California, New York, or New Jersey would, for some investors, approach or exceed 60 percent on long-term capital gains. The OECD’s 2024 Tax Policy Report notes that even the highest-taxing European economies — Denmark, Sweden, France — have carefully engineered lower capital gains rates to protect the investment engine, while taxing labor and consumption broadly.
The Democratic pivot is understandable politically. Polls consistently show that taxing the wealthy is popular. Wealth concentration in the United States is genuinely severe: the top 1 percent hold approximately 31 percent of all net wealth, according to Federal Reserve distributional accounts data. The moral case for asking more of those at the summit is real.
But moral appeal and economic efficacy are distinct questions — and conflating them has been the defining intellectual failure of the current progressive tax debate.
What the Data Actually Shows
Let us be specific, because specificity is where ideology goes to die.
The United States currently raises federal tax revenue equivalent to approximately 17–18 percent of GDP — below the OECD average of roughly 25 percent. The shortfall is not, as is often assumed, primarily a product of insufficiently taxed wealthy individuals. It is a product of structural choices: the U.S. relies far less on value-added taxes, payroll taxes, and broad consumption levies than any comparable advanced economy. The revenue base is narrow, politically constrained, and increasingly volatile.
Meanwhile, the federal debt-to-GDP ratio has surpassed 120 percent, a threshold that IMF research consistently links to measurable drag on long-term growth — on the order of 0.1 to 0.2 percentage points of annual GDP per 10-percentage-point increase in the debt ratio. That is not dramatic in any given year; compounded over decades, it is civilization-scale arithmetic.
What neither party’s tax agenda directly addresses is this structural misalignment. Republican supply-siders promise growth through rate cuts while refusing to touch the expenditure base that drives borrowing. Progressive Democrats promise justice through higher rates on capital while refusing to broaden the base through more efficient instruments. Both sides are, in the language of corporate finance, optimizing for the wrong metric.
The consequences are measurable. Corporate investment as a share of GDP has remained stubbornly below pre-2000 peaks despite repeated cycles of tax reduction. Business formation rates, despite a pandemic-era surge in sole proprietorships, remain below their 1980s levels when adjusted for population. And the metric that should most alarm policymakers: research and development intensity, where the United States once led the world, has been gradually overtaken by South Korea, Israel, and several Northern European economies, according to OECD research and development statistics.
Punitive taxation of capital gains and corporate profits does not, by itself, explain these trends. But it is an accelerant — particularly when combined with regulatory uncertainty, political instability, and the growing attractiveness of alternative jurisdictions.
The Coming Regrets: Five Vectors of Consequence
Innovation flight and brain drain. The United States has historically compensated for its fiscal imprecision with an unmatched capacity to attract global talent and capital. That advantage is eroding. Canada’s Express Entry program, the UK’s Global Talent visa, Portugal’s NHR regime, and Singapore’s sophisticated incentive architecture are explicitly designed to intercept the mobile, high-value individuals and firms that once defaulted to American addresses. A 2024 study from the National Bureau of Economic Research found that inventor mobility increased meaningfully in response to state-level tax changes — evidence that the creative class is more price-sensitive to fiscal environments than policymakers assume.
The inequality paradox. Progressive tax increases that reduce after-tax returns to capital sound redistributive. In practice, they often aren’t. When high capital gains rates reduce the frequency of asset sales, they lock in gains among the wealthy (the “lock-in effect”), reduce tax revenue below projections, and simultaneously reduce the liquidity and price discovery in markets that smaller investors rely on. The Tax Foundation’s modeling of the Biden-era capital gains proposals suggested that the revenue-maximizing rate for long-term capital gains is somewhere between 20 and 28 percent — meaning rate increases above that threshold are simultaneously less progressive and less fiscally productive. This is the Laffer Curve in its most defensible form: not as a justification for fiscal irresponsibility, but as a constraint on policy design.
Fiscal illusion and compounding debt. Perhaps the most insidious consequence of the current bipartisan war on taxes is the fiscal illusion it sustains. Republicans use low-rate orthodoxy to pretend that expenditure commitments are affordable; Democrats use high-rate symbolism to pretend that a narrow base can finance an expansive state. Both are practicing a form of collective self-deception that the Congressional Budget Office’s 2025 Long-Term Budget Outlook makes starkly visible: under current law, federal debt held by the public is projected to reach 156 percent of GDP by 2055 — with interest payments alone consuming roughly 6 percent of GDP annually, crowding out every priority both parties claim to champion.
Global competitiveness erosion. The 2017 TCJA reduced the statutory corporate tax rate to 21 percent, bringing it closer to — though still above — the OECD average of approximately 23 percent (weighted by GDP). But subsequent proposals to raise it to 28 percent would push the combined federal-and-state effective rate above 30 percent for many corporations, and above the G7 average. The OECD/G20 Global Minimum Tax framework of 15 percent has, paradoxically, weakened the case for aggressive U.S. corporate rate increases: if a global floor exists at 15 percent, the incremental deterrence of raising the U.S. rate from 21 to 28 does not prevent profit-shifting — it merely changes where profits shift, and on whose books they settle.
Growth stagnation. At a deeper level, the cumulative uncertainty created by perpetual tax warfare — the TCJA expires at end-of-2025, extensions are contested, each election cycle brings threats of reversal — imposes a “policy uncertainty premium” on long-duration investment. Research by Scott Baker, Nicholas Bloom, and Steven Davis at NBER has quantified this effect: elevated economic policy uncertainty is associated with reduced investment, hiring, and output, with effects that compound over multi-year horizons. America’s tax code has become a source of chronic uncertainty that no individual rate level can fully offset.
The Counter-Arguments, Considered Honestly
The counter-argument most worth engaging is the Nordic one: Denmark, Sweden, and Finland maintain high tax burdens, robust welfare states, and strong productivity growth simultaneously. If Europe can have both high taxes and competitive economies, why can’t America?
The answer lies in composition, not level. Nordic countries achieve their fiscal capacity through broad-based consumption taxes (value-added taxes averaging 22–25 percent) and highly efficient, simple labor taxes — not through punitive capital gains or corporate rate structures that deter investment. Their top marginal income tax rates are high, but they kick in at relatively modest incomes, meaning the burden is genuinely shared rather than concentrated on a narrow slice of filers. The lesson from Scandinavia is not “raise rates on the wealthy” — it is “build a broad, efficient, transparent fiscal compact.” That is a lesson both American parties currently refuse to learn, because neither constituency wants to be the one that pays more.
The second counter-argument is that inequality itself is the growth constraint — that concentrated wealth reduces aggregate demand, under-finances public goods, and ultimately depresses productivity. This is a serious argument with genuine empirical support, particularly at the research level from economists like Joseph Stiglitz and Daron Acemoglu. But the corrective for inequality is not simply higher top rates; it is smarter expenditure on early childhood education, infrastructure, R&D, and portable worker benefits — investments that widen participation in the productive economy. Revenue-raising in service of those goals is entirely defensible. Revenue-raising as political theater, while the underlying investment architecture remains broken, is not.
Toward a Fiscal Compact Worth Having
America does not have a tax problem; it has a fiscal design problem. The country neither raises revenue efficiently nor spends it strategically — and both parties have made peace with a status quo that serves their rhetorical needs while quietly bankrupting the national balance sheet.
What a genuinely reform-minded fiscal agenda would require is uncomfortable for everyone. It would raise revenue through a federal value-added tax, modest initially, which would broaden the base while reducing the economy’s sensitivity to any single rate change. It would lower and stabilize the corporate rate — at or below the current 21 percent — while closing the most egregious profit-shifting opportunities. It would tax capital gains more consistently at death to address the step-up basis loophole, rather than raising rates that trigger lock-in effects during life. It would index tax brackets to productivity growth, not merely inflation, preventing bracket creep from doing the work of deliberate policy.
None of this is politically possible in the current moment. That is precisely the point. The “war on taxes” — conducted by both parties, against different targets, for different rhetorical purposes — has made it impossible to have a serious conversation about what a fiscally sustainable, economically competitive America actually looks like.
The regret is not coming. It is already accumulating — in the debt clock, in the innovation statistics, in the migration patterns of the globally mobile, in the quiet recalculation happening in boardrooms from Austin to Singapore. When it finally becomes undeniable, the political system will search, as it always does, for someone to blame. The answer, unfashionable as it is, will be everyone.
America’s great fiscal tragedy is not that it taxed too much or too little. It is that it never stopped fighting long enough to tax well.
Discover more from The Economy
Subscribe to get the latest posts sent to your email.



Key Takeaways
- Rolex’s secondary market rose approximately 7.9% year-over-year as of 2026 (per WatchCharts data) — trailing Patek Philippe (+16.2%) and Tudor (+11.4%) but still outperforming Audemars Piguet (+3.4%).
- Rolex raised U.S. retail prices 4–9% in January 2026 (steel models ~5.6%, gold models ~8.7%), narrowing the historical gap between retail and pre-owned pricing.
- Not every model appreciates: steel sports references (Submariner, GMT-Master II, Daytona) have held value far better than two-tone or widely available dress references like the standard Datejust.
- The Lady-Datejust posted the sharpest 2026 gain among tracked collections — up 22.73%, from roughly $9,269 to $11,376 — driven by demand for smaller, “everyday luxury” watches.
- Gold’s rise past $2,400/oz has directly lifted the investment case for Rolex’s precious-metal references (Day-Date, Sky-Dweller, Yacht-Master).
The Model-by-Model Picture
| Category | 2026 Trend |
|---|---|
| Lady-Datejust | +22.73% (strongest performer among tracked collections) |
| Steel sports models (Submariner, GMT-Master II) | Held value well; corrected from 2022 peak but stabilized above retail |
| Daytona | Corrected from highs above $50,000 to the mid-$30,000s; still among the most sought-after references |
| Two-tone/widely available Datejust | Flat to negative — “holds value” is an overstatement for this category |
| Gold references (Day-Date, Sky-Dweller) | Lifted by gold’s rise above $2,400/oz |
Why the “Rolex Always Appreciates” Myth Is Fading
The pandemic-era boom pushed some references — the Daytona above all — to speculative highs disconnected from historical norms. Since the March 2022 peak, steel sports models have compressed meaningfully, and dealers who bought inventory near the top have in some cases faced 20–40% markdowns on liquidation. The lesson for 2026 buyers: Rolex as a category is not a monolith. Value retention depends heavily on specific reference, condition, and whether the piece comes with box and papers (“full set”).
What’s Actually Driving 2026 Strength
- Retail price increases raise the floor. When a new Submariner retails at $10,050 (up from $9,500), a pre-owned example at $11,000–$12,000 suddenly represents a smaller premium — narrowing the gap without secondary prices actually moving.
- Supply discipline remains Rolex’s core lever. The brand has never confirmed production numbers, and secondary-market premiums remain entirely a function of Rolex’s own manufacturing decisions — a risk factor as much as a support.
- Certified Pre-Owned rollout. Rolex’s now fully rolled-out CPO program has changed how buyers transact in the used market, adding a layer of brand-verified legitimacy that supports pricing.
The Case for Rolex as a Portfolio Diversifier
Financial advisors increasingly frame luxury watches not as a replacement for equities or bonds, but as a tangible, historically low-correlation diversifier — one that carries its own risks (illiquidity, condition-dependent pricing, no yield) but has demonstrated multi-decade resilience for specific references.
Is Rolex a good investment in 2026?
It depends heavily on the specific reference. Steel sports models like the Submariner and Daytona have held or grown in value; two-tone and widely available dress models generally have not. Overall, Rolex’s secondary market rose about 7.9% year-over-year in 2026, trailing Patek Philippe but ahead of Audemars Piguet.
Discover more from The Economy
Subscribe to get the latest posts sent to your email.

Navigating Mortgage and Loan Refinancing in a High-Yield Environment
Global public debt crossing critical thresholds has kept central bank policies volatile, resulting in fluctuating US Treasury yields throughout 2026. For homeowners and commercial property holders burdened by previous high-interest borrowing cycles, finding optimal refinance windows has become a high-stakes financial puzzle. Stalled disinflation and stubborn employment numbers mean rate cuts are incremental, requiring borrowers to act with precision.
Timing your mortgage or commercial loan refinance in this environment requires a deep understanding of yield curve movements and lender risk appetites.
Decoding 2026 Refinance Dynamics
The 10-Year Treasury Yield Benchmark
Mortgage rates continue to track closely with the 10-year US Treasury yield. When macroeconomic anxiety spikes debt issuance, yields rise, tightening consumer borrowing capacity. Savvy borrowers monitor weekly Treasury auctions to lock in rates during brief dip windows.
Hybrid ARMs and Alternative Structures
With fixed rates remaining elevated, 7/1 and 10/1 adjustable-rate mortgages (ARMs) have surged in popularity. These products offer lower initial monthly payments, giving borrowers breathing room until central bank easing cycles fully materialize.
| Loan Product | Current Rate Range | Best For | Key Risk Factor |
| 30-Year Fixed Mortgage | 6.2% – 6.8% | Long-term predictability | Higher initial monthly outlay |
| 7/1 Hybrid ARM | 5.5% – 5.9% | Short-term ownership / flipping | Rate reset risk after year 7 |
| Commercial Refinance | 7.0% – 8.2% | Corporate asset restructuring | Strict DSCR lender covenants |
Actionable Steps for Successful Refinancing
To maximize your chances of securing favorable refinance terms in a volatile market, follow a disciplined preparation strategy.
Boost Your Credit Score Immediately: Lenders in 2026 are applying stringent credit tiering; a 20-point increase can drop your APR by a crucial quarter-point.
Shop Regional Credit Unions: Smaller financial institutions often offer portfolio loans with more flexible underwriting than major national banks.
Calculate the Break-Even Point: Ensure your total closing costs are recouped through monthly savings within 24 months of closing.
“Market Strategist View: Refinancing in 2026 is an exercise in opportunistic timing. Borrowers must maintain immaculate financial profiles ready to strike the moment Treasury yields dip.”
Mastering the complexities of today’s debt environment ensures you can successfully lower your debt service costs and protect your long-term financial stability.
Discover more from The Economy
Subscribe to get the latest posts sent to your email.

The days of pulling generic auto insurance quotes based purely on your zip code and age are officially over. In 2026, insurance comparison engines are powered entirely by generative AI and real-time telematics. These platforms digest thousands of live data points—ranging from your driving smoothness via connected vehicle sensors to real-time traffic congestion patterns—to generate hyper-personalized premiums instantly.
For consumers, this evolution represents both a massive opportunity for savings and a hidden trap for penalty pricing. Understanding how AI algorithms evaluate risk is essential for anyone looking to lower their monthly auto insurance premiums.
How AI Comparison Engines Evaluate Your Risk Profile
Behavioral Telematics and Connected Cars
Modern cars stream performance data directly to insurance aggregators. Generative AI models analyze braking sharpness, acceleration curves, cornering G-forces, and phone distraction metrics. Drivers who maintain smooth, defensive habits are rewarded with dynamic rate cuts of up to 40% compared to traditional rating tiers.
Predictive Traffic and Weather Modeling
AI tools now cross-reference your daily commute route with predictive weather and accident probability models. If your standard parking location or driving corridor has a statistically higher incidence of uninsured motorist claims, your quotes will reflect that hyper-local risk assessment.
| Comparison Factor | Traditional Rating Model | 2026 Generative AI Model | Impact on Premium |
| Mileage & Usage | Annual estimated odometer reading | GPS tracking & live trip duration | High (up to 35% savings) |
| Driving Behavior | MVR driving record & accidents | Real-time braking, speed, & G-force | Critical (determines tier) |
| Vehicle Tech | Make, model, and safety rating | ADAS calibration & repair cost data | Moderate |
Strategies to Lower Your AI-Driven Insurance Quote
To outsmart the algorithm and secure the lowest possible premium in 2026, drivers must proactively manage their digital footprint on insurance platforms.
Opt-In for Telematics Trial Periods: Many insurers offer immediate 15% discounts just for installing their driving app; let it track safe habits for 30 days to lock in permanent savings.
Scrub Unverified Public Records: Ensure your motor vehicle report is free of clerical errors that AI risk models misinterpret as reckless behavior.
Compare AI Aggregators: Use platforms that integrate multi-carrier API feeds rather than single-brand comparison sites to find the best risk-adjusted rate.
“Industry Note: AI-driven pricing rewards transparency and precision. Drivers who actively manage their telematics data consistently out-save those relying on legacy quote calculators.”
Embracing AI comparison tools allows savvy policyholders to customize coverage limits precisely to their driving habits, eliminating wasted premium spend while ensuring robust protection.
Discover more from The Economy
Subscribe to get the latest posts sent to your email.

The Global South: Debt, Climate Finance and Investment in 2026

Energy Security Is the New Economic Security

Can Global Tourism Survive Geopolitical Shocks?

Global Maritime Hegemony: How China Secured Over 81% of All New Shipbuilding Orders

The Coming Battle Over AI, Jobs and Wages

Why Developing Economies Face a Sharper Inflation Problem

The New Geography of Trade: Are Supply Chains Coming Home?

Is AI Saving Global Growth or Creating the Next Bubble?

Global Banking Trends 2026: Digital Banks, AI and Compliance

Gold vs US Dollar vs Bitcoin in 2026: Inflation Hedge Compared

How Global Interest Rates Affect Savings, Loans and Investments

How to Invest During High Inflation: A Global Guide

Best Global Stocks to Watch in 2026: Four Sectors to Research

Pakistan’s 2027 Growth Strategy: Exports, AI, Energy and Jobs

Crude Oil & Petroleum Market Analysis: OPEC+ Decisions and Price Forecasts

World’s Largest Economies: Ranking the Top Global Powers

Silver Price Today: Why the Xi-Trump AI Standoff Is Fueling a Safe-Haven Rally

Algorithmic Dogfights: Why the U.S. and China Must Establish Rules of Engagement for Autonomous Air Power

Top US Convenience Store Chains: Store Counts, EV Charging, and Sales Trends

Who Is Shivon Zilis? The Neuralink Executive at the Center of the Musk–OpenAI Trial

Corporate America Faces a New Debt Test as US Borrowing Costs Surge

Global Economic Outlook 2026: 7 Forces Reshaping Markets, Trade and Business

Business Insurance: What Coverage You Actually Need and What It Costs in 2026

Social Security Extra $90 Deposit: Who Qualifies for the October 2026 Medicare Rebate?

US 10-Year Yield Hits 5.24%: What the Historic Bond Market Sell off Means for Mortgages and Investors

Gold Falls 3.7% as Yields Surge: Is Gold Still a Safe Haven in 2026?

Stock Market Today: Dow, S&P 500, and Nasdaq Retreat as Treasury Yields

MAS Allocates S$1.45 Billion to Five Asset Managers in Third EQDP Batch: Total Deployment Reaches S$5.4 Billion
-

 Markets & Finance10 months ago
Top 15 Stocks for Investment in 2026 in PSX: Your Complete Guide to Pakistan’s Best Investment Opportunities
-

 Analysis8 months ago
Johor’s Investment Boom: The Hidden Costs Behind Malaysia’s Most Ambitious Economic Surge
-

 Analysis8 months ago
Top 10 Stocks for Investment in PSX for Quick Returns in 2026
-

 Banks9 months ago
Best Investments in Pakistan 2026: Top 10 Low-Price Shares and Long-Term Picks for the PSX
-

 Analysis9 months ago
Brazil’s Rare Earth Race: US, EU, and China Compete for Critical Minerals as Tensions Rise
-

 Investment9 months ago
Top 10 Mutual Fund Managers in Pakistan for Investment in 2026: A Comprehensive Guide for Optimal Returns
-

 Global Economy10 months ago
15 Most Lucrative Sectors for Investment in Pakistan: A 2025 Data-Driven Analysis
-

 Global Economy10 months ago
Pakistan’s Export Goldmine: 10 Game-Changing Markets Where Pakistani Businesses Are Winning Big in 2025