
Analysis
Asia’s Energy Triage Amid the Iran War
The Conflict Is Exposing a Hierarchy of Energy Vulnerability Across the Indo-Pacific
Live Data Snapshot — March 12, 2026
Indicator Figure Global oil & LNG offline ~20% Brent crude (bbl) ~$107 South Korea KOSPI (Mar 9) −6.0% Japan Nikkei 225 (Mar 9) −5.2% Hormuz oil bound for Asia 84% Effective Hormuz closure duration 12 days
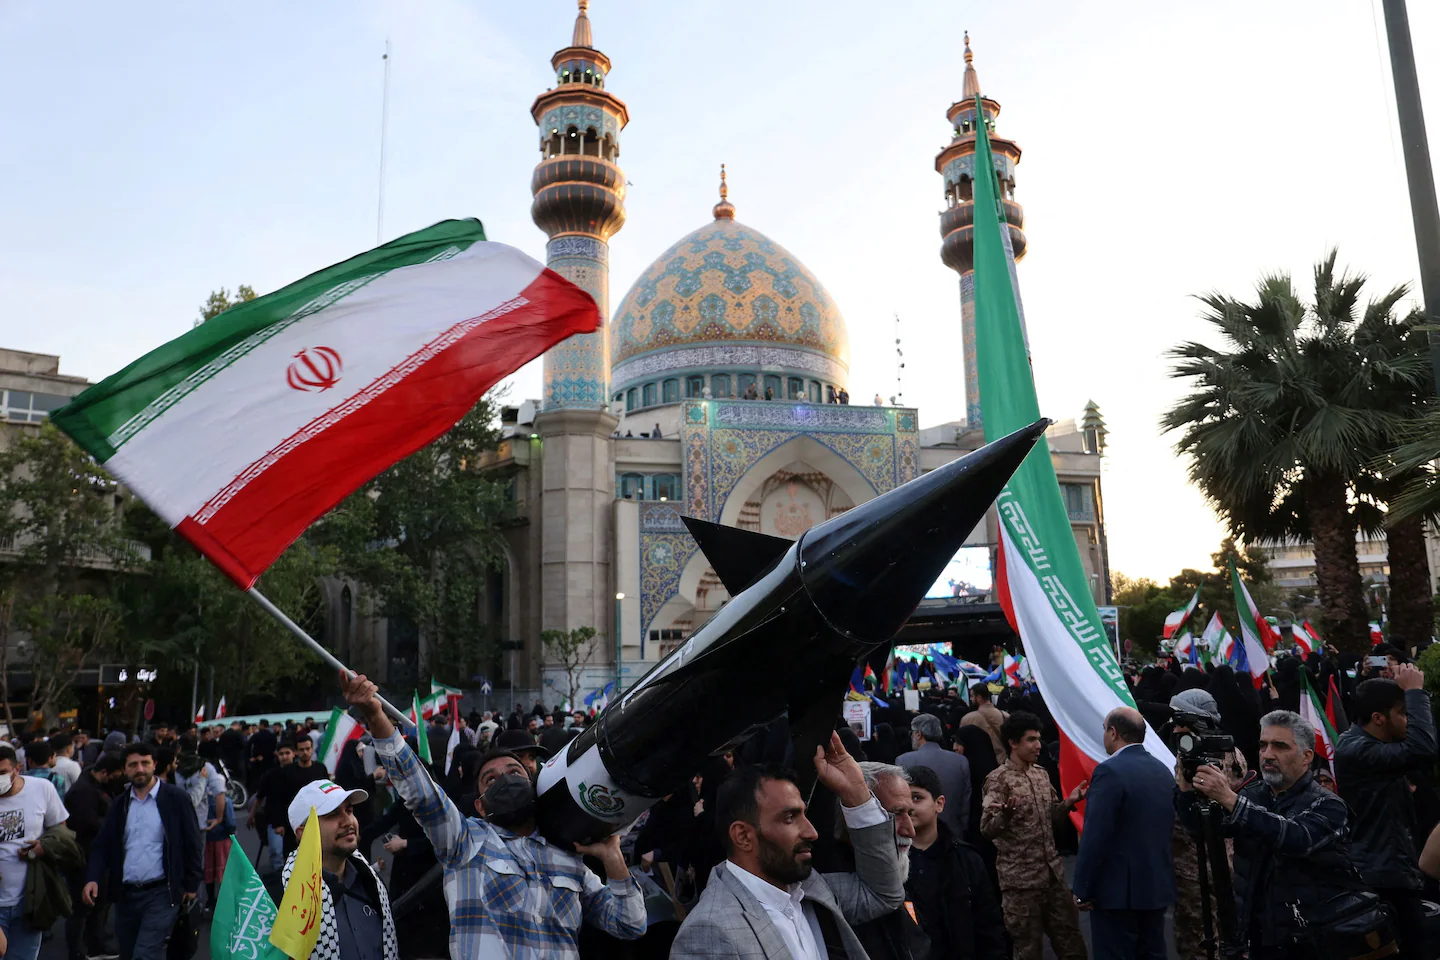
On the morning of March 9, a trading floor in Seoul fell silent in the way that trading floors only fall silent when something truly systemic is breaking. South Korea’s KOSPI had already plunged 8 percent in early trading — its second circuit-breaker halt in four sessions — before closing down 6 percent at 5,251. Across the Korea Strait, Tokyo’s Nikkei 225 was off more than 5 percent. In Manila, the government had already announced a four-day workweek for public offices. In Bangkok, the prime minister had capped diesel prices. Brent crude, which had been $73 a barrel just two weeks before, was trading above $119 — its highest print since Russia’s 2022 invasion of Ukraine.
These are not coincidental data points. They are the first vital signs of a patient whose diagnosis is the same in every language: acute energy shock. Twelve days after U.S. and Israeli forces struck Iran on February 28, killing Supreme Leader Ali Khamenei and triggering retaliatory strikes across the Gulf, the Strait of Hormuz — through which roughly 20 percent of the world’s daily oil supply and an equivalent share of global LNG transits — is effectively closed. As RBC Capital Markets global commodity strategist Helima Croft told NPR, “We’re now facing what looks like the biggest energy crisis since the oil embargo in the 1970s.” Iran achieved it not with a naval armada, but with cheap drones and the credible threat of mines.
What those initial market readings are only beginning to reveal, however, is something more structural than a price spike: a hierarchy of energy vulnerability across the Indo-Pacific that this crisis is making impossible to ignore. Asia absorbs 84 percent of the crude oil and 83 percent of the LNG that normally transits the Strait, according to U.S. Energy Information Administration data. Four economies — China, India, Japan, and South Korea — accounted for nearly 69 percent of all Hormuz crude flows in 2024. Their factories, semiconductor fabs, petrochemical complexes, and power grids are all downstream of that 34-kilometer chokepoint. But their capacity to absorb the shock is radically unequal. That inequality is the real story of Asia’s energy triage amid the Iran War.
The Choke: How a 21-Mile Strait Became Asia’s Oxygen Line
The Strait of Hormuz is 21 miles wide at its narrowest. The navigable shipping lanes are barely two miles across in each direction. Iran achieved its effective closure not with an internationally illegal blockade, but with something far more economical: targeted drone strikes on vessels transiting its approach, the apparent laying of a modest number of naval mines, and a sustained VHF radio warning from the Islamic Revolutionary Guard Corps that “no ship will be permitted to pass.” Within hours of Tehran’s warnings, the world’s major Protection and Indemnity insurers withdrew war-risk coverage. Shipping companies, unwilling to send crews and vessels through an uninsured war zone, stood down. Tanker traffic dropped by 70 percent within 48 hours and fell to near zero within a week.
The immediate impact is well-documented: nearly 15 million barrels per day of crude and 4.5 million barrels of refined products are stranded inside the Gulf, filling storage tanks that were designed for throughput, not warehousing. Iraq has begun shutting down production in its largest fields because it has nowhere to send the oil. Qatar’s Ras Laffan complex — the world’s largest LNG export facility, responsible for roughly 20 percent of globally traded LNG — suspended operations after an Iranian drone strike in the facility’s vicinity in the opening days of the conflict. The IEA has announced its largest emergency reserve release in history, some 400 million barrels in coordination with member states. The U.S. alone is contributing 172 million barrels from the Strategic Petroleum Reserve. None of this is close to adequate for a disruption that, by the EIA’s own accounting, represents the largest supply interruption since the 1970s — double the Suez Crisis’s 9–10 percent share of global trade.
What makes the current crisis categorically different from previous Gulf emergencies is its LNG dimension. The world has never stress-tested a simultaneous disruption of both oil and LNG flows through Hormuz at scale. Qatar’s suspension of Ras Laffan operations — even if temporary — sent European natural gas prices up 45 percent and delivered a supply shock for which strategic reserves simply do not exist in the same way they do for crude oil. There are no LNG equivalents to the SPR. Liquefied natural gas cannot be easily stockpiled above a few weeks’ operational buffer. And it is here that the Indo-Pacific’s hierarchy of vulnerability becomes most stark.
“This is about as wrong as things could go at any single point of failure in global oil markets.”
— Kevin Book, Clearview Energy Partners, quoted in NPR (March 4, 2026)
The Hierarchy of Vulnerability: A Three-Tier Framework
Not all of Asia is equally exposed to this shock. Understanding the Indo-Pacific’s energy triage requires mapping the region not by geography but by a more revealing metric: the intersection of import dependency, reserve depth, portfolio diversification, and institutional capacity to respond. That map produces a clear three-tier structure.
Tier 1 — Stressed but Managed: Japan & South Korea
Deep strategic crude reserves. Critical LNG exposure.
Over 150–208 days of strategic crude cover. LNG is the binding vulnerability: Japan holds 2–4 weeks, South Korea 9–52 days of operational inventory. Both are activating reserves, seeking emergency spot LNG from Australia, Canada, and the U.S., and implementing price caps. Survival is not in question; rationing may be.
Tier 2 — Scale With Exposure: China & India
Stockpile cushion versus structural brittleness.
China holds an estimated 1.2–1.3 billion barrels in strategic and commercial reserves (~108–130 days of cover) and benefits from Russian supply independent of Hormuz. India holds ~15 days of strategic crude and has already begun LNG rationing. Both face acute LPG and LNG shortfalls and are pivoting further toward Russian supply, reshaping Indo-Pacific geopolitics in the process.
Tier 3 — Acute Crisis: Southeast Asia & the Pacific
Thin margins, thin reserves, no buffer.
The Philippines, Thailand, Vietnam, Myanmar, Laos, Cambodia, and Pacific Island nations face immediate rationing, four-day workweeks, and export bans. Qatar supplied 42.5% of Singapore’s LNG and 42.7% of Thailand’s in 2025. Several nations hold less than 30 days of crude cover and have no meaningful alternative supply. The civilian pain here is already severe.
Asia-Pacific Energy Exposure Profile — March 2026
| Economy | Middle East Oil Dependence | Hormuz Exposure | Strategic Crude Reserve | LNG Buffer | Vulnerability Tier |
|---|---|---|---|---|---|
| Japan | ~90% | ~70% | ~150 days | 2–4 weeks | Tier 1 (Stressed) |
| South Korea | ~70% | ~65% | ~208 days | 9–52 days | Tier 1 (Stressed) |
| China | ~50% | ~50% | ~108–130 days | Weeks (partial coal hedge) | Tier 2 (Cushioned) |
| India | ~45% | ~45% | ~15 days | <2 weeks | Tier 2 (Acute) |
| Thailand | High | ~42.7% LNG from Qatar | Low | Very thin | Tier 3 (Crisis) |
| Philippines | ~95% | Very high | Minimal | Days | Tier 3 (Crisis) |
| Singapore | High | ~42.5% LNG from Qatar | Regional hub | Weeks (hub buffer) | Tier 2/3 (Transition) |
Sources: EIA, Kpler, Atlantic Council, The Diplomat, parliamentary disclosures. Data as of March 12, 2026.
Tier 1: Japan and South Korea — The Illusion of Preparedness
Japan and South Korea look, on paper, like the region’s best-prepared economies. Japan holds national and commercial strategic petroleum reserves covering approximately 150 days of net crude imports, according to Atlantic Council analysis of Kpler data. South Korea holds roughly 208 days. Both governments have moved rapidly: Japan’s refiners have formally requested reserve releases; Seoul has imposed the first fuel price caps in nearly three decades and announced a 100 trillion won ($68.3 billion) economic stabilization fund. Given that both economies source 70–90 percent of their crude from the Middle East — with roughly 70 percent of Japan’s supply transiting Hormuz directly — the response has been considered and reasonably swift.
But crude oil is only half the story, and it is the easier half. LNG is the binding constraint, and it is here that both countries’ preparedness assumptions collapse. South Korea’s working LNG inventory at import terminals covers roughly nine days of consumption, according to a parliamentary disclosure last week — though the government’s own figure is closer to 52 days. Japan holds an estimated two to four weeks. These are not strategic reserves in any meaningful sense; they are operational buffers, maintained not for crisis but for routine supply chain management. And they are draining at a rate that no emergency spot LNG cargo from Australia, Canada, or the United States can replace in the near term. Arranging alternative LNG cargoes requires weeks of logistics, and the global spot market was already tight before the war.
The semiconductor dimension adds a further layer of systemic risk that most energy analyses have underweighted. South Korean lawmaker Kim Yong-bae told Reuters this week that the chip industry is alarmed not just by energy costs but by the potential loss of helium — a byproduct of natural gas processing in which the Gulf is a major producer — that is essential to semiconductor fabrication. Samsung Electronics fell 7.81 percent on March 9; SK Hynix shed 9.52 percent. For economies whose export competitiveness rests on fabrication nodes measured in nanometers, the energy triage is already a technology security problem.
Tier 2: China and India — Asymmetric Resilience
China occupies a paradoxical position in this crisis: on paper the most exposed, in practice the most insulated. The People’s Republic holds the world’s largest onshore crude stockpiles, estimated at 1.2 to 1.3 billion barrels in combined strategic and commercial reserves, according to data from Kpler and the Atlantic Council. At current refinery runs of 15.5 million barrels per day, that represents approximately 108 to 130 days of import cover — a buffer built deliberately and methodically over nearly a decade of strategic pre-positioning, accelerated sharply after tensions in the Taiwan Strait began rising in 2023 and 2024. Beijing had added approximately 100 million barrels to its stockpiles in the twelve months before the war broke out, taking advantage of lower global prices and deeply discounted Russian and Iranian supply.
China has also spent two decades building structural energy independence that is now proving its strategic value. Coal and renewables dominate its power mix. Half of all nuclear reactors under construction worldwide are in China. In 2024, virtually all electricity demand growth was met by clean sources. As Foreign Policy argued this week, China’s push to become an “electrostate” — reducing its exposure to liquid fuels for power generation — means that even a prolonged LNG disruption can be partially bridged with domestic coal, a hedge that Japan and South Korea, which have been actively winding down coal generation capacity, cannot easily replicate. Beijing has also ordered state refiners to suspend petroleum product exports to conserve domestic supply, a mercantilist move that tightens Tier 3’s already critical situation.
Yet China’s resilience has a structural floor — and possibly a geopolitical ceiling. LNG is Beijing’s soft underbelly. Qatar supplies approximately 30 percent of China’s LNG imports, and China’s rapidly growing gas-fired industrial and heating sector cannot be fully substituted by coal at speed. This is why Beijing moved with unusual diplomatic urgency within 48 hours of the war’s outbreak, pressing Tehran not to target LNG tankers or Qatari export infrastructure. China’s foreign ministry called for an end to hostilities; China’s special envoy Zhai Jun condemned attacks on civilian infrastructure. These are not the statements of a government indifferent to the crisis. They are the statements of a government that has bought itself time — but not immunity.
India’s position is the most acute of the major powers. New Delhi holds strategic crude reserves of approximately 39 million barrels across three underground caverns — roughly 15 days of total imports — in a reserve system that was designed for a smaller economy and has never been fully tested in a drawdown scenario. India has already begun rationing LNG, raised LPG prices, and watched the rupee slide to near-record lows. Its benchmark indices recorded their worst week in over a year. Prime Minister Modi’s visit to Israel in the days just before the strikes has generated significant diplomatic discomfort, complicating New Delhi’s traditional posture of strategic non-alignment. Almost half of India’s crude imports and roughly 60 percent of its natural gas supplies transit Hormuz. The pivot to Russian crude, already well underway since 2022, will now accelerate sharply — deepening a bilateral energy dependency that Washington will watch with considerable unease.
Tier 3: Southeast Asia’s Acute Pain — The Region Nobody Prepared For
If Japan and South Korea face a managed crisis and China a cushioned one, Southeast Asia and the Pacific face something rawer: an emergency without a safety net. The Philippines imports nearly all of its crude from the Middle East, holds minimal strategic reserves, and is entirely dependent on imported LNG for its gas-fired power generation. The four-day government workweek announced in Manila this week — ordering agencies to cut energy consumption by 10 to 20 percent — represents a war-footing conservation measure that peacetime governments rarely invoke. Emergency fuel subsidies are under study. Gas queues stretched for blocks in Metro Manila on March 9.
Thailand and Vietnam have moved to restrict official travel and encourage remote work. Myanmar has imposed alternating driving days. Thailand has already suspended crude exports — except to Cambodia and Laos, which lack refining capacity and depend on Bangkok’s surplus. China has ordered its state refiners to cease petroleum product exports entirely, a decision that will ripple through the informal supply chains feeding Laos, Cambodia, and Myanmar within weeks. Petrochemical companies including Singapore’s Aster Chemicals and Indonesia’s PT Chandra Asri Pacific have already begun declaring force majeure on contractual obligations.
The Economist Intelligence Unit estimated this week that global oil prices averaging around $80 per barrel in 2026 — a figure that already looks conservative against today’s Brent print of $107 — would “raise inflation and lower growth across much of Asia.” For Tier 3 economies, where energy subsidies have already strained fiscal space and where household energy costs represent 15 to 25 percent of disposable income for working families, this is not a macroeconomic abstraction. It is a rapidly deteriorating quality-of-life crisis with direct implications for political stability. The Pacific Island states, which import virtually all their fuel and have virtually no fiscal capacity to cushion price shocks, represent the most acute humanitarian dimension of the Indo-Pacific’s energy triage — the least discussed, and potentially the most damaging.
The Diplomatic Tightrope: Energy, Alignment, and the New Indo-Pacific Order
Every energy crisis is also a diplomatic crisis, and this one is reshaping the Indo-Pacific’s political geometry in real time. The most consequential realignment involves India and Russia. Moscow’s Deputy Prime Minister Alexander Novak has stated publicly that Russia is “ready to increase supplies” to both India and China. Russian crude, which does not transit Hormuz — reaching Asian markets via Baltic, Black Sea, and Pacific routes — has emerged as the war’s single most important alternative supply source. India, which had already been purchasing Russian crude at a significant discount since 2022, will now accelerate that dependence sharply. China, which had been moderating its Russian crude intake as relations with the Gulf states deepened, will now abandon that restraint.
The geopolitical mathematics are uncomfortable for Washington. As the Foreign Policy Research Institute has noted, Russian state oil and gas revenues had fallen to a four-year low in January 2026, creating meaningful pressure on the Kremlin to negotiate in Ukraine. The Iran war has reversed that trajectory overnight. Higher oil revenues will directly strengthen Russia’s capacity to finance its war in Ukraine, directly undercutting one of Washington’s stated policy objectives. The crisis that the Trump administration triggered by striking Iran has, as a side effect, bailed out Vladimir Putin’s war chest.
For China, the crisis presents a more complex set of opportunities and constraints. Beijing’s immediate interest is in reopening Hormuz — not to help Washington, but because China’s LNG exposure means a prolonged closure hurts it too, despite its stockpile cushion. Yet over the medium term, as Foreign Policy argued this week, the crisis may actually consolidate China’s strategic position. Its domestic renewables buildout — already the most ambitious in the world — now looks less like climate policy and more like military-industrial foresight. Every additional gigawatt of solar and wind generation is a unit of strategic autonomy that Japan, South Korea, and India currently lack at scale. The crisis accelerates China’s relative energy independence even as it deepens the dependence of its regional rivals.
India’s position is the most diplomatically contorted. New Delhi’s traditional doctrine of strategic autonomy — buying Russian oil while deepening U.S. security ties, investing in Iranian infrastructure while accepting Western sanctions constraints — is under simultaneous pressure from every direction. The rupee’s slide, the LNG rationing, and the optics of Modi’s Israel visit have narrowed India’s maneuvering room precisely at the moment when it needs maximum flexibility. Chinese Foreign Minister Wang Yi’s call for BRICS solidarity this week — urging India to “step up to the plate” within the bloc — is a reminder that Beijing intends to use the crisis to deepen its gravitational pull on New Delhi’s policy calculus.
The Clean Energy Paradox: Acceleration and Rebound
Energy crises historically trigger two simultaneous and contradictory responses: an acceleration of clean energy transition, as nations confront their import dependency, and a short-term rebound toward energy security at any cost — including coal. Both dynamics are visible in Asia today, and both will shape the region’s energy architecture for the next decade.
The acceleration case is powerful. Japan’s long-stalled nuclear restart program — which had recovered from near-zero post-Fukushima to roughly 8 percent of the electricity mix by 2025 — is now receiving an unexpected political tailwind. Every reactor that comes back online reduces LNG demand and extends the operational buffer that stands between Japan’s industrial economy and rationing. South Korea’s government, which had been navigating a politically fraught coal phaseout strategy, is now confronting the reality that its accelerated LNG dependency — the direct consequence of closing coal plants before equivalent renewables capacity was online — has dramatically worsened its position in the hierarchy of vulnerability.
The rebound risk is equally real. Thailand, the Philippines, and Vietnam have been among Southeast Asia’s most ambitious renewable energy markets. Under acute fiscal pressure, with energy subsidies straining budgets and foreign exchange reserves being drawn down to purchase spot LNG, the temptation to extend coal plant lifetimes rather than retire them — accepting the carbon cost in exchange for energy security and price certainty — will be significant. The crisis is creating conditions in which “energy security” and “clean transition” feel like opposing vectors, when the reality is that domestic renewables are the only durable solution to Hormuz dependency. That insight may take hold. Or it may arrive too slowly to prevent a decade of coal lock-in across precisely the economies that most need to decarbonize.
“Every kilowatt-hour generated from domestic renewables is now a unit of strategic autonomy.”
— The structural insight reshaping Indo-Pacific energy policy, March 2026
The Path Forward: Three Structural Shifts That Will Harden
The immediate crisis — the drone strikes, the insurance paralysis, the stranded tankers — will eventually resolve. Either a ceasefire will allow underwriters to reassess war-risk coverage, or a sustained U.S. naval escort regime will restore a partial flow of commercial vessels, or Iran’s own export calculus will create sufficient diplomatic leverage to broker a limited reopening. History suggests that the strait’s de facto closure is unlikely to persist beyond four to six weeks before some combination of military deterrence and economic necessity forces a partial resolution.
What will not resolve is the structural exposure that this crisis has exposed. Three shifts are likely to harden into permanent features of Indo-Pacific energy and security architecture.
First, energy security will be permanently redefined across the region as a core national security imperative, not merely an economic or environmental policy domain. Every Asian government that has watched its equity market fall 6 to 16 percent in two weeks will emerge from this crisis with a different calculation about the cost of import dependency.
Second, LNG supply diversification will accelerate sharply, and the beneficiaries will be American, Australian, and Canadian producers. Long-term contracts with non-Hormuz LNG suppliers — already rising before the crisis — will now command a strategic premium. The IEA’s post-crisis assessment will almost certainly recommend a formal LNG strategic reserve mechanism for the first time, analogous to the crude oil reserves that have been inadequately but meaningfully mobilized in the current emergency.
Third, and most consequentially for the Indo-Pacific’s geopolitical order, the crisis will accelerate the energy-driven reshaping of the U.S.-China-Russia triangle. American LNG will flow to Japan, South Korea, and eventually India at volumes that were commercially marginal before the war. Russian crude will flow to China and India at volumes that are strategically inconvenient for Washington. China’s domestic clean energy buildout will continue at a pace that, within a decade, will make Beijing significantly less vulnerable to the kind of chokepoint coercion that has just traumatized its neighbors.
The hierarchy of energy vulnerability that this crisis has exposed is not permanent. But the divergent trajectories it has revealed — and accelerated — will define who holds structural power in the Indo-Pacific for the next generation.
In a region that has long preferred to treat energy as a commercial matter and security as a separate domain, the Iran war’s twelve days of closed waters have delivered a lesson that will not be forgotten: the two were never separate. They were simply waiting for a drone strike in a narrow Gulf waterway to make the connection undeniable.
Frequently Asked Questions
What is the “hierarchy of energy vulnerability” exposed by the Iran war in Asia?
The hierarchy framework ranks Asia-Pacific economies by their structural capacity to absorb the Hormuz supply shock. Tier 1 (Japan and South Korea) hold deep strategic crude reserves but face acute LNG vulnerability. Tier 2 (China and India) benefit from scale and diversification respectively, but both face LNG constraints and import dependency. Tier 3 (Southeast Asia and Pacific Island states) have minimal reserves, thin fiscal buffers, and are experiencing immediate rationing, shorter workweeks, and export restrictions. The key insight is that exposure is asymmetric even among countries at comparable levels of import dependency.
Why is LNG more critical than crude oil in the current Asia energy crisis 2026?
Unlike crude oil, LNG cannot be stockpiled at the same scale. Most Asian economies hold only weeks of LNG operational buffer — compared to months of strategic crude reserves. Japan’s two-to-four weeks of LNG cover and South Korea’s nine-day parliamentary estimate underscore how quickly a protracted closure translates into electricity and industrial rationing. The global LNG spot market was already tight before the war, making emergency procurement both expensive and logistically constrained.
How has China managed to remain relatively insulated from the Strait of Hormuz closure impact on the Indo-Pacific?
China’s relative resilience reflects three deliberate structural choices made over the past decade: aggressive stockpiling (an estimated 1.2–1.3 billion barrels in combined strategic and commercial reserves); supply diversification including deep reliance on Russian crude arriving via non-Hormuz routes; and a domestic clean energy buildout that reduces dependence on gas-fired power. Its principal vulnerability remains LNG, where Qatar supplies roughly 30 percent of its imports — which is why China moved diplomatically within 48 hours to pressure Tehran not to target LNG tankers or Qatari export infrastructure.
Will the Iran war accelerate the clean energy transition or trigger a coal rebound in Asia?
Both dynamics are underway simultaneously. The acceleration case is driven by Japan’s nuclear restart momentum and South Korea’s recognition that its coal phaseout worsened its crisis exposure. The rebound risk is driven by Southeast Asian economies — particularly Thailand, Vietnam, and the Philippines — that face acute fiscal pressure and may find coal plant life extensions more politically viable under emergency conditions. The structural argument for domestic renewables as strategic autonomy has never been stronger, but policy windows in a crisis are narrow.
What are the broader Indo-Pacific security implications of the energy supply shock from the Iran conflict?
The crisis is reshaping three geopolitical relationships simultaneously. Russia benefits directly: higher oil revenues reverse a budget squeeze that had been pressuring Moscow toward Ukraine negotiations. The U.S.-India relationship is complicated by New Delhi’s accelerated pivot to Russian energy. And China’s domestic clean energy leadership will compound over the next decade into a structural energy security advantage relative to Japan, South Korea, and Southeast Asia. The crisis has exposed Hormuz as Asia’s systemic single point of failure, and the geopolitical consequences will outlast any ceasefire.
Discover more from The Economy
Subscribe to get the latest posts sent to your email.


Oracle’s stock collapsed 24% in 2026 as $130 billion in AI debt and negative free cash flow of $23.7 billion rattled markets. Inside the hyperscaler’s existential reckoning.
Larry Ellison’s audacious pivot to AI infrastructure is drawing comparisons to the dot-com implosion — and for good reason.
Oracle Corp. closed out the week of June 27, 2026 with a stock price of $148.53, down 19% in a single week — the worst weekly performance since the 2001 technology bust. The collapse has shaken not just Oracle shareholders but the entire ecosystem of AI infrastructure optimism that has dominated capital markets for the better part of two years. What began as a generational pivot into cloud computing has become a cautionary tale about how quickly leverage can transform ambition into crisis.
The Numbers Behind the Nosedive
The arithmetic is stark. Oracle’s capital expenditures surged 162% to nearly $56 billion in fiscal year 2026, leaving the company with negative free cash flow of $23.7 billion — a dramatic deterioration from just a $394 million deficit in fiscal 2025. Long-term debt ballooned to approximately $124.7 billion by the end of the third fiscal quarter, making Oracle one of the most leveraged technology companies in history relative to its operating cash generation.
Despite posting total revenue of $67.4 billion for fiscal 2026 — a 17% year-on-year gain — investors focused on what was missing rather than what was achieved. Cloud infrastructure revenue did surge 93% to $5.8 billion in the fourth quarter, and total cloud revenue climbed 47% to $9.9 billion, demonstrating genuine demand. But those gains are being funded by capital markets in a way that is testing the boundaries of investor patience.
Having already raised $43 billion in debt and $5 billion in equity during fiscal 2026, Oracle announced plans to secure a further $40 billion in fiscal 2027 — on top of a previously disclosed $20 billion at-the-market equity programme. The announcement sent shares tumbling roughly 10% in after-hours trading on the day of the earnings call.
The OpenAI Dependency Problem
Central to investor anxiety is Oracle‘s lopsided reliance on OpenAI. The ChatGPT developer accounts for the majority — at least $300 billion — of Oracle’s remaining performance obligations. The concentration risk is extraordinary for a company of Oracle’s scale. If OpenAI stumbles in its own fundraising or fails to monetise its products at the projected pace, the cascade effects on Oracle’s revenue backlog — which rose 325% to an eye-catching figure that initially thrilled analysts — could be severe.
D.A. Davidson analysts warned in a December 2025 note that, “considering Oracle is already barely hanging on to an investment grade rating, we would be concerned about Oracle’s ability to live up to these obligations without restructuring its OpenAI contract.” The concern is not hypothetical: the cost to insure Oracle’s debt against default on credit default swap markets has hit record levels, a signal that bond investors are demanding higher risk premiums.
Morgan Stanley estimates that AI-related global debt issuance will more than double to nearly $570 billion in 2026, with hyperscaler spending potentially exceeding $1 trillion by 2027. Oracle sits at the most precarious position in that ecosystem — large enough to be systemic, but without the balance sheet cushion of Amazon, Microsoft, or Alphabet to absorb multi-year cash burn.
The Margin Trap
There is a structural problem embedded in Oracle’s strategy that goes beyond near-term financing concerns. The company’s traditional enterprise software business carries gross margins of approximately 77%. Infrastructure — the business it is pivoting toward — runs at margins closer to 49% at maturity, according to FactSet analyst consensus. That is a punishing dilution for a company that has historically been valued on premium software economics.
Analysts estimate Oracle will burn roughly $34 billion in cumulative free cash flow over the next five years before the infrastructure business turns cash-flow positive in 2029. “Four or five years is a long time,” Eric Lynch, managing director at Suncoast Equity Management, told Bloomberg. “That’s just not within our investment discipline.” The concern is compounded by reports — which Oracle denied — that completion dates for data centres tied to OpenAI contracts had been pushed back from 2027 to 2028.
Meanwhile, headcount declined 13% to 141,000 employees in fiscal 2026, with pullbacks concentrated in sales and marketing — the exact functions needed to defend the existing software business from AI-native competitors. Larry Ellison, absent from the most recent earnings call, has been surpassed on the global wealth rankings by Larry Page, Sergey Brin, Jeff Bezos, and Michael Dell as the stock’s decline eroded the paper value of his stake.
What Evercore and the Bulls Are Still Saying
Not every analyst has abandoned the thesis. Evercore maintained a buy recommendation, noting that “financing/leverage and the pace of equity issuance” would remain the central investor debate “even as demand signals stay strong.” The company’s fiscal 2027 revenue guidance of $90 billion was left intact, and adjusted EPS targets were nudged higher to $8.05. Evercore analysts argue that the backlog growth and infrastructure demand pipeline are real — the question is whether markets will extend the runway needed to prove it.
The broader tech software sector offers context: the iShares Expanded Tech-Software ETF (IGV) is down 16% year-to-date in 2026, while Oracle has fallen 24% — worse than the index but not in isolation. The investor thesis on enterprise software has broadly softened on fears that large language models will automate away categories of software that have historically commanded subscription premiums.
The Systemic Warning
Oracle’s distress carries implications well beyond its own share price. Fortune reported that Morgan Stanley wealth management’s Lisa Shalett flagged Oracle’s credit default swap widening as an early warning indicator for the broader AI investment complex. If confidence in Oracle’s ability to service its debt erodes, it signals that markets are beginning to reprice the risk embedded in the entire hyperscaler debt stack — a reassessment that could spread to data centre REITs, AI chip suppliers, and enterprise cloud vendors.
The debt load, the leadership transition to dual CEOs Clay Magouyrk and Mike Sicilia, the OpenAI concentration risk, and the structural margin compression collectively make Oracle the most visible stress test of the AI infrastructure buildout in 2026. Whether it passes or fails that test will shape capital allocation across the technology sector for years to come.
Discover more from The Economy
Subscribe to get the latest posts sent to your email.

A global memory chip shortage is hitting AI hyperscalers, tanking Nvidia and Apple shares, and triggering a Wall Street rotation. Here’s what the AI sector’s supply crisis means for investors.The artificial intelligence boom that has driven Wall Street’s most extraordinary bull run in a generation is running headlong into a physical constraint: the world cannot produce memory chips fast enough to feed it.
On Friday, June 26, 2026, technology stocks extended a brutal weekly decline even as the broader market stabilized and advancing shares outnumbered declining ones. Nvidia slipped another 1% in early trading and was on pace for an 8% weekly loss—its worst five-day stretch in more than a year. Apple dived after announcing price increases for several iPad and Mac models, citing higher costs from memory chip shortages. Oracle and CoreWeave fell after the New York Times reported that OpenAI was considering delaying its initial public offering to as late as 2027.
What the headlines share is a single underlying cause: the cost of the memory chips that power AI infrastructure is rising faster than even the most aggressive hyperscaler budgets assumed, and the shortage driving that cost increase is not expected to ease before 2028.
The Architecture of the Crisis
Memory chips—specifically the high-bandwidth memory, or HBM, used in AI accelerators—are produced by a small number of manufacturers: SK Hynix, Micron, and Samsung. Demand for HBM has exploded because each new generation of Nvidia’s AI chips requires substantially more of it. As Nvidia pushes its product cycle faster to maintain competitive advantage, each cycle pulls forward enormous new demand for chips that take 18 to 24 months to ramp in production.
Micron reported strong quarterly earnings—its results have been spectacular—but the very strength of those results is the problem for the rest of the tech sector. Micron’s margins are rising because memory is scarce and expensive. The companies buying that memory—Microsoft, Amazon, Alphabet, Meta, and the rest of the hyperscaler complex—are absorbing higher input costs on a scale that is beginning to show up in margin guidance.
Analysts at Charles Schwab noted a “growing wedge” in the technology sector between memory producers like Micron—which is posting massive gains—and the hyperscaler stocks that are watching their AI infrastructure economics deteriorate. The latter group includes names like Microsoft, Amazon, and Alphabet, which are collectively projected to spend between $660 billion and $700 billion on AI infrastructure in 2026, according to research from Fair Observer.
Nvidia’s Problem Is a Market Concentration Problem
Nvidia entered 2026 having crossed a $5 trillion market capitalization—larger by GDP comparison than all but four national economies. That concentration made the stock not merely a bet on AI but a systemic weight in the S&P 500. Nvidia and its mega-cap technology peers now account for roughly 30% of the entire index—the highest concentration in half a century.
When Nvidia corrects, it does not correct in isolation. It reprices the risk premium of every fund manager with an S&P 500 benchmark, which is nearly every institutional investor in the world. The 8% weekly decline in late June—attributed to a combination of rising memory costs, margin anxiety among hyperscaler customers, and a broader rotation away from high-multiple AI stocks—had ripple effects across semiconductor infrastructure names including Lumentum, Marvell Technology, and Corning.
Apple Raises Prices—and Reveals the Exposure
Apple’s announcement of price increases for iPad and Mac models was notable for two reasons. First, Apple’s supply chain is among the most sophisticated on earth; if Apple could not absorb memory cost increases without raising consumer prices, the margin pressure is acute. Second, Apple’s pricing decision revealed an exposure that consumer electronics companies had managed to keep largely invisible through inventory buffers.
Those buffers, built up when memory was cheap, are now depleted. The shortage is forecast to persist through 2027 and potentially into 2028, driven by Nvidia’s accelerated chip release cadence and the insatiable demand of AI data centers for high-bandwidth memory. Analysts at Briefing.com noted that higher memory costs are seen “persisting throughout 2027 and perhaps into 2028, driven by increasing data center demand and Nvidia’s rapid introduction of updated AI chips.”
OpenAI Delays Its IPO—Absorbing the Lesson From SpaceX
The reported delay in OpenAI’s public offering is a direct consequence of two market developments: the broader tech weakness driven by the memory supply crisis, and the troubled IPO debut of SpaceX earlier in June, whose shares suffered heavy losses in the days following listing as global markets repriced risk.
OpenAI executives, who had targeted 2026 for a public offering, are now said to be evaluating a 2027 launch—giving markets time to stabilize and giving the company time to demonstrate that its AI infrastructure economics are sustainable at the scale that a public market valuation would demand.
The Rotation That May Define the Rest of 2026
The most significant market dynamic emerging from the memory chip crisis is not the decline in any single stock but the rotation it is enabling. As the mega-cap AI trade faces margin headwinds, investors are moving into financial and industrial companies, healthcare, and energy—sectors that had been overshadowed for years by the AI growth narrative. The Dow, weighted toward those steadier names, was holding up even as the Nasdaq declined through the final week of June.
That divergence—Dow up, Nasdaq down—is a familiar pattern in sector rotation cycles. It does not necessarily signal a bear market. It may signal the beginning of a more broadly distributed bull market, one less concentrated in five or seven names. The memory supply crisis, in that reading, is not the end of the AI boom—it is the first serious test of whether the boom’s economics are durable enough to survive contact with physical constraints.
Discover more from The Economy
Subscribe to get the latest posts sent to your email.
US national debt has crossed $39 trillion, bond yields are spiking, and Treasury auctions are showing soft demand. Here is what the bond market knows that Washington refuses to acknowledge.The United States crossed a number this year that no country in history has ever reached: $39 trillion in total federal debt. Not in inflation-adjusted terms. Not as a percentage of GDP. In raw dollars, the figure that sits on the public ledger of the world’s largest economy grew by $1 trillion in five months and $2 trillion in seven and a half months—and it is not slowing down.
What makes the velocity of that accumulation remarkable is the context in which it occurred. The Iran war added direct military expenditure at a pace that budget analysts said was accelerating. The 2025 tax cuts continued to erode revenue. And rising interest rates—the same rates the Federal Reserve is now signaling it may push higher still—are compounding the cost of servicing all that outstanding debt in a feedback loop that the bond market has quietly begun to price.
What the Auctions Are Saying
The most direct readout of market confidence in U.S. fiscal sustainability is the Treasury auction market, where the government sells new debt every week. Recent auctions have produced signals that bond investors usually describe in muted, technical language—but the direction is consistent.
A recent three-year Treasury auction cleared at 4.192%, well above the 3.965% at the prior auction. Yields rise when demand is soft. Soft demand at U.S. Treasury auctions is not a crisis signal—these are still among the most liquid securities in the world—but the trend line is one that fixed-income analysts at institutions ranging from J.P. Morgan to the Council on Foreign Relations have flagged as requiring close attention.
Foreign investors currently hold just above 30% of the Treasury market. Alarm bells rang briefly after April 2025’s Liberation Day tariffs—when U.S. bonds, equities, and the dollar all sold off together, the rarest of Wall Street trifectas—but subsequent data showed no dramatic reallocation away from Treasuries by foreign holders. That relative stability, however, depends on the continuation of conditions (a strong dollar, a functioning petrodollar system, geopolitical faith in U.S. institutions) that several of those conditions’ own architects now question.
The Interest Payment Problem
Of that $39 trillion, roughly $31.4 trillion is held by the public—the portion traded in financial markets globally. At current yields, the annual interest cost the U.S. government pays is on track to exceed $1 trillion for the first time in the country’s history. That figure is not a forecast. It is an arithmetic consequence of the debt level and the rate environment.
For context: U.S. defense spending in 2026 is approximately $900 billion. The federal government will spend more on interest payments than on the entire military. More than on Medicaid. More than on all discretionary non-defense programs combined. That structural reality constrains fiscal policy in ways that economists at the Deloitte Center for Financial Services have described as the most significant long-term challenge facing the U.S. economy.
“Higher bond yields affect U.S. fiscal dynamics in a number of ways,” analysts at the Council on Foreign Relations noted in their examination of tariff and Treasury interactions. “As interest payments on debt increase and use a greater share of available government funds, policymakers become more constrained around other fiscal priorities. They also can be more challenged when they need to respond to economic shocks.”
Three Credit Downgrades, Zero Course Correction
The United States has now been downgraded by all three major credit ratings agencies: S&P in 2011, Fitch in 2023, and Moody’s in May 2025. Each downgrade arrived with similar language—concerns about fiscal trajectory, political dysfunction over the debt ceiling, and a structural unwillingness to match revenues with spending. Each was followed by a brief market convulsion and then, effectively, nothing. Congress did not respond. The debt continued growing.
That pattern—of consequences being absorbed rather than heeded—is what makes the current moment structurally different from prior debt discussions, according to analysts who study sovereign fiscal crises. In those prior episodes, the U.S. still had room to maneuver: rates were low, the global appetite for dollar-denominated safe assets was rising, and alternative reserve currencies were even less credible than they are today. The margin for error has narrowed on all three dimensions.
The Political Ceiling on Solutions
The challenge is not primarily economic—it is political. Addressing a $39 trillion debt requires some combination of higher revenues, lower spending, or both. In the current Washington environment, tax increases are politically radioactive for one party and spending cuts face equivalent resistance from the other—particularly for the entitlement programs (Social Security, Medicare, Medicaid) that account for the largest share of mandatory outlays.
Markets have not yet priced the national debt as an immediate crisis, as analysts at U.S. Bank noted in their midyear market review: investors continue to watch whether rising debt eventually requires higher interest rates to attract enough Treasury buyers. The passive construction of that sentence—”continue to watch”—captures the market’s posture precisely. It is waiting. It is not yet acting.
The bond market’s message, in the language of Treasury yields and auction results, is being sent in increments rather than in a single shock. Washington is not listening. The question is not whether the message will eventually become impossible to ignore—it is how high rates must rise, and how much growth must slow, before the political system treats the ledger as a constraint rather than an abstraction.
Discover more from The Economy
Subscribe to get the latest posts sent to your email.

Oracle AI Debt Crisis 2026: $130 Billion Gamble Triggers Worst Stock Crash Since Dot-Com Bust

Male Labor Force Participation Rate 2026: Why Men Are Leaving & Economic Impact

Trump Tariffs 2026: Economic Impact, Household Costs & Trade War Outlook

China Economy 2026: Export Boom Masks Property Crisis & Investment Slump

US Inflation 4% May 2026: Is the Worst Over? Fed, Oil Prices

AI Memory Chip Shortage 2026: Nvidia, Apple & What Comes Next

US $39 Trillion National Debt 2026: Bond Market Warning Signs Explained

Ray Dalio US Suez Moment 2026: Dollar Decline, $39 Trillion Debt & Empire’s End

Kevin Warsh Fed Rate Hike 2026: What His Hawkish Pivot Means for Markets

Gold Price 2026: Will Gold Hit $6,000? JPMorgan Forecast, Drivers & Investment Guide

US Recession 2026: Four Key Threats, Warning Signs & How to Protect Your Portfolio

AI Energy Demand 2026: Data Centres, Power Grids & the $725B Infrastructure Boom

AI Semiconductor Selloff 2026: Micron Crash, Nasdaq Pullback & What Comes Next

US Tariffs 2026: How Trump’s 11.7% Effective Rate Is Reshaping Global Trade & Inflation

KPMG Australia CEO Resigns After Whistleblower Claims Exposed Investigation Failures

PwC China Partner Payouts Cut Amid Evergrande Audit Fraud

Broadcom Market Value Loss: Revenue Forecast Disappoints

Investors Pile Into Bullish Dollar Bets as ‘US Exceptionalism’ Trade Returns

Here’s How Much It’ll Cost You to Be Part of SpaceX’s Record-Breaking $75 Billion IPO

Nasdaq Tumbles 4% as Chip and Memory Stocks Sink: A $1.2 Trillion Wipeout

How to Fix Pakistan’s Debt Economy: A Structural Blueprint

Smash Capital Leads $200M Funding for Allen Control Systems

Democrats Draw a Red Line Around Military AI — And the Pentagon Is Already Pushing Back

New Investment Super-Cycle: AI, Green Energy & Re-Shoring

Russia Overspends on Putin’s War in Ukraine by $28bn

Xponential Fitness Franchise Lawsuit: The $3.97M Judgment

Middle East Conflict Oil Prices: The $4 Surge Explained

The End of the Chatbot: Why OpenAI is Tearing Up Its Most Successful Product
-

 Markets & Finance6 months ago
Top 15 Stocks for Investment in 2026 in PSX: Your Complete Guide to Pakistan’s Best Investment Opportunities
-

 Analysis4 months ago
Top 10 Stocks for Investment in PSX for Quick Returns in 2026
-

 Analysis5 months ago
Brazil’s Rare Earth Race: US, EU, and China Compete for Critical Minerals as Tensions Rise
-

 Analysis4 months ago
Johor’s Investment Boom: The Hidden Costs Behind Malaysia’s Most Ambitious Economic Surge
-

 Banks5 months ago
Best Investments in Pakistan 2026: Top 10 Low-Price Shares and Long-Term Picks for the PSX
-

 Investment6 months ago
Top 10 Mutual Fund Managers in Pakistan for Investment in 2026: A Comprehensive Guide for Optimal Returns
-

 Global Economy6 months ago
15 Most Lucrative Sectors for Investment in Pakistan: A 2025 Data-Driven Analysis
-

 Global Economy6 months ago
Pakistan’s Export Goldmine: 10 Game-Changing Markets Where Pakistani Businesses Are Winning Big in 2025