
Analysis
Singapore Dollar Slides 1.1% as Iran War Sparks a Safe-Haven Rush to the Dollar

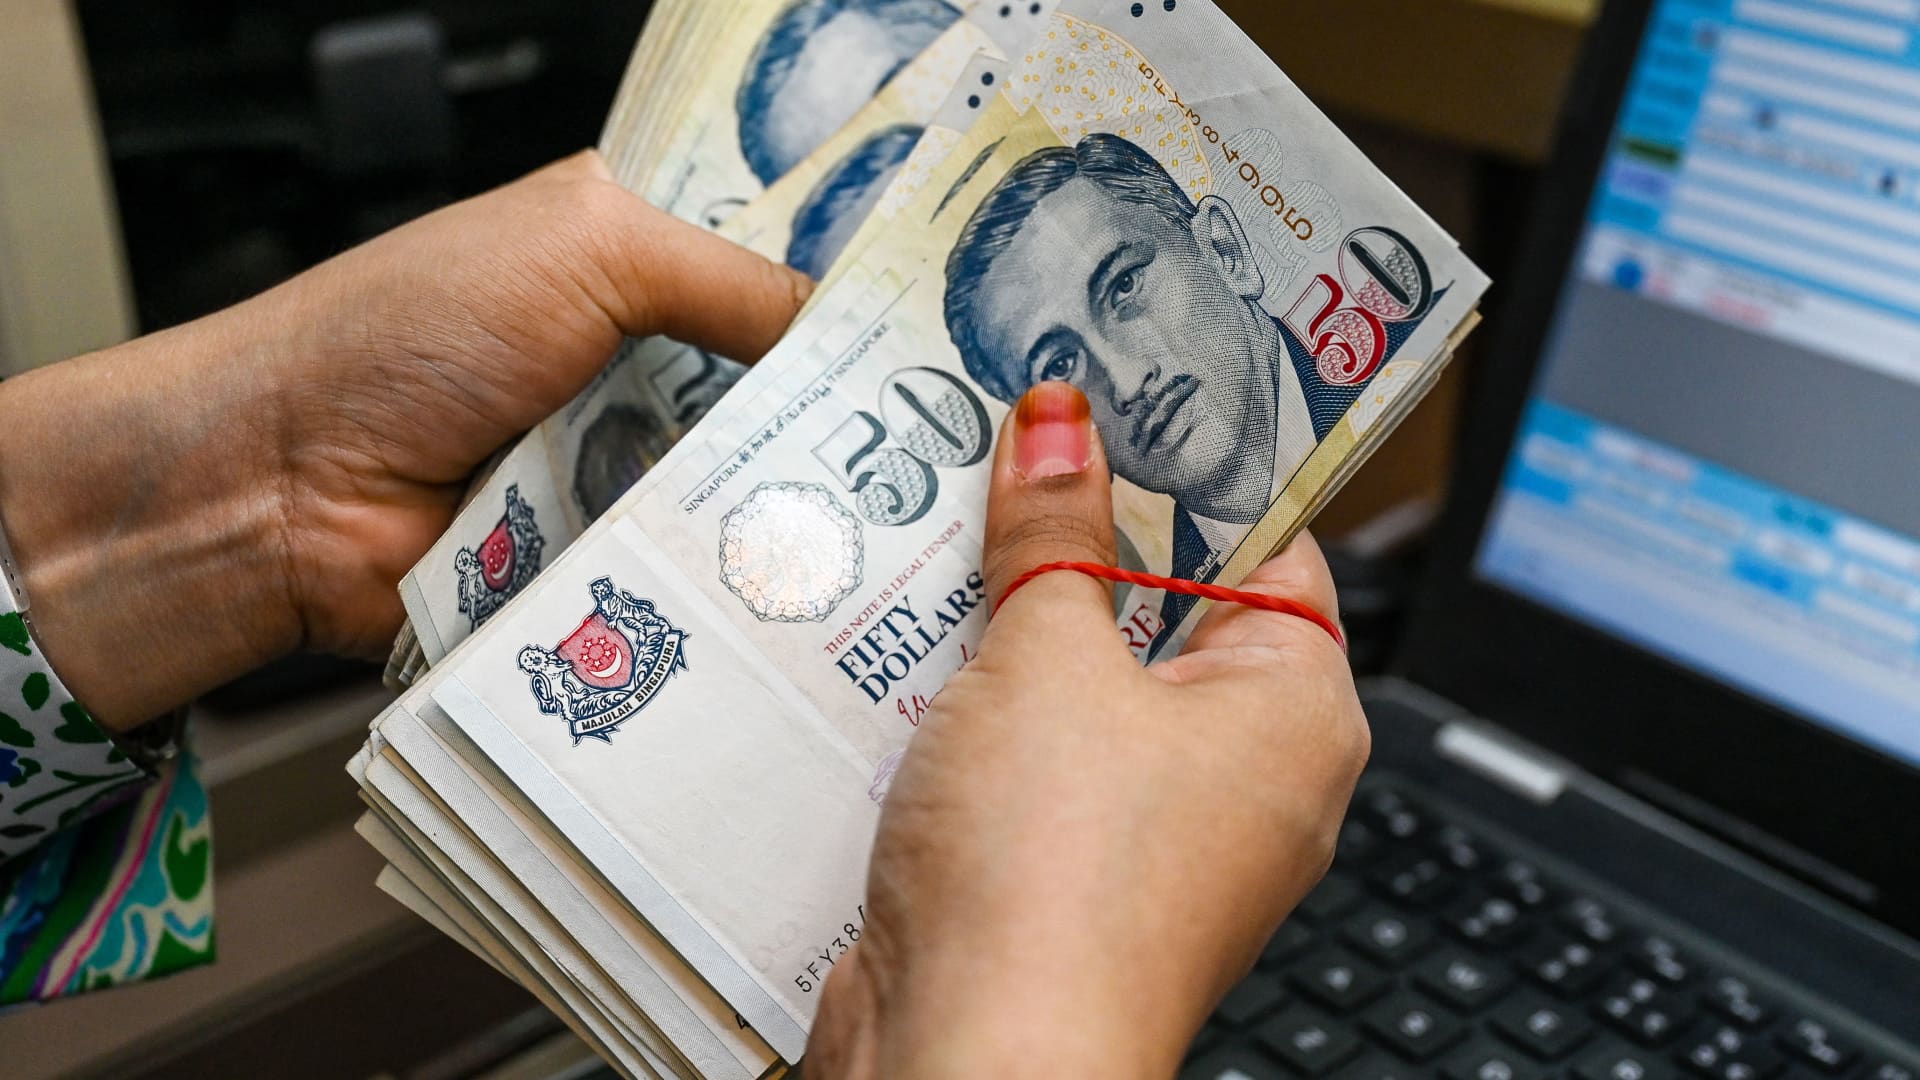
As US and Israeli strikes reshape the Middle East’s energy map, the SGD retreats — but Singapore’s fundamentals offer more ballast than the headlines suggest
The Singapore dollar has shed more than a full percentage point against the US dollar in five trading sessions, the steepest weekly decline the currency has seen in months — but the real story is not the number on the screen. It is the cascade of events that produced it: coordinated American and Israeli airstrikes on Iran that killed Supreme Leader Ayatollah Ali Khamenei over the weekend of 28 February, a de facto closure of the Strait of Hormuz, Brent crude surging past $84 a barrel, and a stampede of global capital into the one refuge that never seems to go out of fashion — the US dollar.
On Wednesday morning in Singapore, SGD/USD was quoted at approximately 0.7824, meaning one Singapore dollar buys just over 78 US cents. Flipped into the more commonly traded convention, USD/SGD stood at 1.278, its highest point since late 2025. The move places the pair at the centre of a broader emerging-market rout: an MSCI gauge of developing-nation currencies logged its worst single session since November 2024 on Monday, as central banks in Indonesia, Turkey and India were forced to intervene. Singapore, by contrast, did neither — a quiet signal of relative confidence.
Market Snapshot: Key Data as of 4 March 2026
| Asset | Level | 5-Day Change |
|---|---|---|
| SGD/USD | 0.7824 | −1.1% |
| USD/SGD | 1.278 | +1.1% |
| DXY (US Dollar Index) | ~99.7 → 99.16 | +~1.0% (WTD) |
| Brent Crude | $82.76/bbl | +13.5% (WTD) |
| WTI Crude | $75.48/bbl | +12.0% (WTD) |
| Straits Times Index (STI) | ~4,800 est. | −1.6% (WTD) |
| Fed Rate Cut (first fully priced) | September 2026 | Pushed back from July |
Sources: Bloomberg, CNBC, TradingEconomics, Wise FX
The Geopolitical Trigger: When “Operation Epic Fury” Hit the FX Markets
The catalyst arrived without warning on the weekend of 28 February, when US and Israeli forces launched what President Donald Trump dubbed “Operation Epic Fury” — a massive wave of coordinated strikes against Iranian nuclear and military infrastructure. Tehran responded with missile salvos targeting Gulf energy facilities, and within hours the commander of Iran’s Revolutionary Guard declared the Strait of Hormuz closed, threatening to “set any ship on fire” that attempted passage.
The consequences for energy markets were immediate and severe. Brent crude, which had closed near $73 per barrel on the Friday before the strikes, surged as high as $85 at one point on Tuesday — a level last seen in early 2024 — before settling into a still-elevated range around $82–84 by Wednesday. WTI rose above $75. The Strait of Hormuz typically channels roughly 20 per cent of the world’s seaborne oil and vast volumes of Qatari liquefied natural gas; QatarEnergy halted LNG production after attacks on its Ras Laffan export site, sending European natural gas futures rocketing more than 40 per cent in a single session.
For foreign-exchange markets, the transmission mechanism was swift and familiar: energy shock → inflation risk → narrowing Fed rate-cut expectations → dollar strength. The US dollar index gained nearly 1 per cent on Monday alone, erasing its losses for 2026 and trading at a five-week high. By Wednesday, DXY hovered near 99.7 before easing slightly to 99.16, approaching but not yet piercing the psychologically important 100 level. Meanwhile, former Treasury Secretary Janet Yellen summed up the Fed’s dilemma bluntly: “The recent Iran situation puts the Fed even more on hold, more reluctant to cut rates than they were before this happened.”
The market agrees. Rate futures now push the first fully priced Fed cut to September, two months later than the July consensus that prevailed before the weekend — a shift with direct implications for dollar-denominated carry trades and Asian currency valuations alike.
Singapore: Risk-Off, but Relatively Contained
Against that backdrop, the Singapore dollar’s 1.1 per cent weekly retreat looks, in context, almost orderly. Senior economists Chua Han Teng and Radhika Rao at DBS Group Research offered the most measured institutional read on the situation, noting that “Singapore’s financial markets saw risk-off but contained movements,” with the benchmark equity index — the Straits Times Index — declining approximately 1.6 per cent, and the SGD weakening by around 1 per cent. Their conclusion: “The economy [is] confronting uncertainty from a relatively strong position, amid solid growth momentum buoyed by global artificial intelligence-related tailwinds and still-low inflation at the start of 2026.”
That framing is important. Singapore entered this crisis with considerably more macro cushion than many of its emerging-market peers. In January 2026, the government upgraded the full-year GDP growth forecast to a range of 2 to 4 per cent, lifted higher in part by the sustained global boom in artificial intelligence infrastructure investment — a wave that has turbocharged Singapore’s data-centre sector, financial services exports and semiconductor-adjacent supply chains. Core inflation, meanwhile, was running well within the Monetary Authority of Singapore’s 1–2 per cent target band heading into the conflict.
The MAS moved quickly to reassure markets. In a statement issued on 2 March, the central bank confirmed that it is “closely monitoring developments arising from the ongoing situation in the Middle East, and is assessing the impact on the domestic economy and financial system.” Critically, it confirmed that “Singapore’s foreign exchange and money markets continue to function normally,” and that the Singapore dollar nominal effective exchange rate — the S$NEER — “remains within its appreciating policy band, which will continue to dampen imported inflationary pressures.” Translation: the MAS is not panicking, and the exchange-rate framework is doing exactly what it was designed to do.
Deputy Prime Minister Gan Kim Yong told Parliament on 2 March that a prolonged conflict could push up prices and weigh on growth, and that the government stands ready to revise GDP and inflation forecasts if conditions warrant. He also pointed to Budget 2026 measures designed to build precisely this kind of economic resilience.
Singapore’s Structural Vulnerabilities and Compensating Strengths
The city-state is not, however, immune. As a small, highly open economy with no domestic energy production, Singapore is structurally exposed to Persian Gulf disruptions through multiple channels simultaneously. More than 14 million barrels of crude oil per day typically pass through the Strait of Hormuz, with roughly three-quarters destined for China, India, Japan and South Korea — the same economies to which Singapore’s trading, logistics and financial infrastructure is intimately connected. A sustained Hormuz disruption ripples outward through shipping costs, LNG prices and ultimately consumer price indices.
Maybank economist Dr Chua Hak Bin had flagged in advance that inflation was an underappreciated risk in 2026, citing rising semiconductor prices and the unwinding of Chinese export deflation — a deflationary cushion that had kept manufactured goods prices suppressed for several years. A Gulf supply shock superimposes an energy cost surge on top of those pre-existing pressures. If the conflict persists beyond four to six weeks, Singapore’s core inflation could break above the MAS’s 1–2 per cent forecast band, creating pressure on the central bank to shift its exchange-rate policy.
On the currency’s specific bilateral move, three forces are at work. First, broad dollar strength driven by safe-haven demand and reduced Fed easing expectations. Second, a modest compression of Singapore’s yield advantage as global risk premia widen. Third, the direct trade exposure: Singapore’s port and re-export economy is a node through which Middle East energy flows toward the rest of Asia — a role that, if interrupted, shrinks the near-term growth outlook priced into SGD. The relative outperformance of SGD versus, say, the Indonesian rupiah or the Thai baht reflects the first factor (safe-haven properties of a highly creditworthy small open economy) partially offsetting the second and third.
Global Macro: The Fed Between Two Fires
For the Federal Reserve, the Iran conflict has arrived at the most uncomfortable possible moment. US inflation stood at 2.4 per cent in January 2026, already above the 2 per cent target. JPMorgan Chase CEO Jamie Dimon put the conundrum plainly: “This right now will increase gas prices a little bit, and again, if it’s not prolonged it’s not going to be a major inflationary hit. If it went on for a long time, that would be different.”
Markets are currently pricing in two 25-basis-point cuts by year-end — but with the first fully expected cut pushed to September and genuine uncertainty about supply-side inflation, even that modest easing path is far from guaranteed. Nomura economists have flagged the dilemma facing Asian central banks as a binary: tolerate higher inflation, or absorb the fiscal cost of consumer subsidies. “So which ‘negative’ do you want to have: higher inflation or worse fiscal?” asked Rob Subbaraman, Nomura’s head of global macro research.
Barclays analysts have flagged a scenario where Brent reaches $100 per barrel if Hormuz remains blocked, with UBS seeing potential for $120 in an extreme-disruption case. Even BMI, which maintained its full-year Brent forecast at $67 per barrel, acknowledged that its core view rests on a “brief spike in March, followed by rapid retracement” — an assumption that requires a relatively swift de-escalation. President Trump, who has said the conflict “could become a prolonged battle,” has offered no such assurance.
What It Means for Investors — and for Travellers
For Singapore-based investors, the near-term calculus involves navigating a market that is simultaneously buffeted by geopolitical risk and buoyed by structural AI-driven growth. DBS’s equity strategy team identified defence, oil-and-gas, and shipbuilding names — including ST Engineering, Seatrium and Nam Cheong — as likely near-term beneficiaries, while flagging headwinds for aviation, transport and interest-rate-sensitive REITs. At the same time, the STI’s historical tendency to recover geopolitical drawdowns within 60 days — an average of 6 to 7 per cent decline over that window — provides a baseline for calibrating exposure.
For the millions of travellers who use Singapore as a hub or who hold SGD-denominated accounts, the currency move has a practical dimension. A weaker Singapore dollar means purchasing power against USD-denominated goods and services — American hotel rates, US flight tickets, dollar-priced tours across Southeast Asia — has declined. At 0.7824, a Singapore traveller exchanging S$5,000 receives around US$3,912, compared with roughly US$3,963 before the conflict. That is not a catastrophic shift, but it underscores the direct household relevance of geopolitical shocks that often appear abstract. Conversely, travellers to Singapore from the United States will find the city-state modestly more affordable — a silver lining for inbound tourism that Singapore’s hotel and hospitality sector will welcome.
Forward Outlook: A Corridor of Uncertainty
The range of plausible outcomes from here is unusually wide. At one end: a swift diplomatic resolution, Hormuz reopens, oil retraces toward $70, the Fed resumes its cutting cycle in July, and the SGD recovers toward the 0.79–0.80 range versus the dollar that prevailed in early 2026. At the other: a conflict lasting weeks or months, Brent sustaining above $90 or beyond, core inflation breaking above MAS targets, and USD/SGD testing 1.30 or higher.
What keeps Singapore closer to the optimistic scenario than most of its peers is precisely what DBS’s economists identified: the economy is not entering this shock from a position of vulnerability. The AI investment supercycle, export resilience, low pre-crisis inflation, and MAS’s exchange-rate-based policy framework — which can tighten by allowing a faster SGD appreciation when inflation threatens — all represent buffers unavailable to less structurally sound emerging markets.
The MAS’s managed float system, in which the S$NEER is guided within a policy band that prioritises inflation control over short-term exchange-rate stability, is arguably the most sophisticated monetary transmission mechanism in Asia. The current episode is not testing its limits — not yet.
One number to watch above all others: Brent crude. If it holds below $90 and Hormuz traffic resumes within weeks, Singapore’s financial markets are likely to absorb this shock with the composure they have shown so far. If it approaches $100 and the geopolitical calendar darkens further, the MAS will face choices it would prefer not to make.
The Conclusion
The Singapore dollar’s retreat is real, but it is not a verdict. Markets price fear before they price facts, and the facts of Singapore’s economic position in early 2026 — strong growth momentum, low inflation, a credible central bank, and an economy wired into the AI-powered future — are considerably more durable than the fear that moved the currency by a percentage point this week. In the fog of geopolitical war, that is worth remembering.
A weaker SGD is a symptom of global anxiety. Singapore’s fundamentals are the cure — and they remain intact.
Discover more from The Economy
Subscribe to get the latest posts sent to your email.


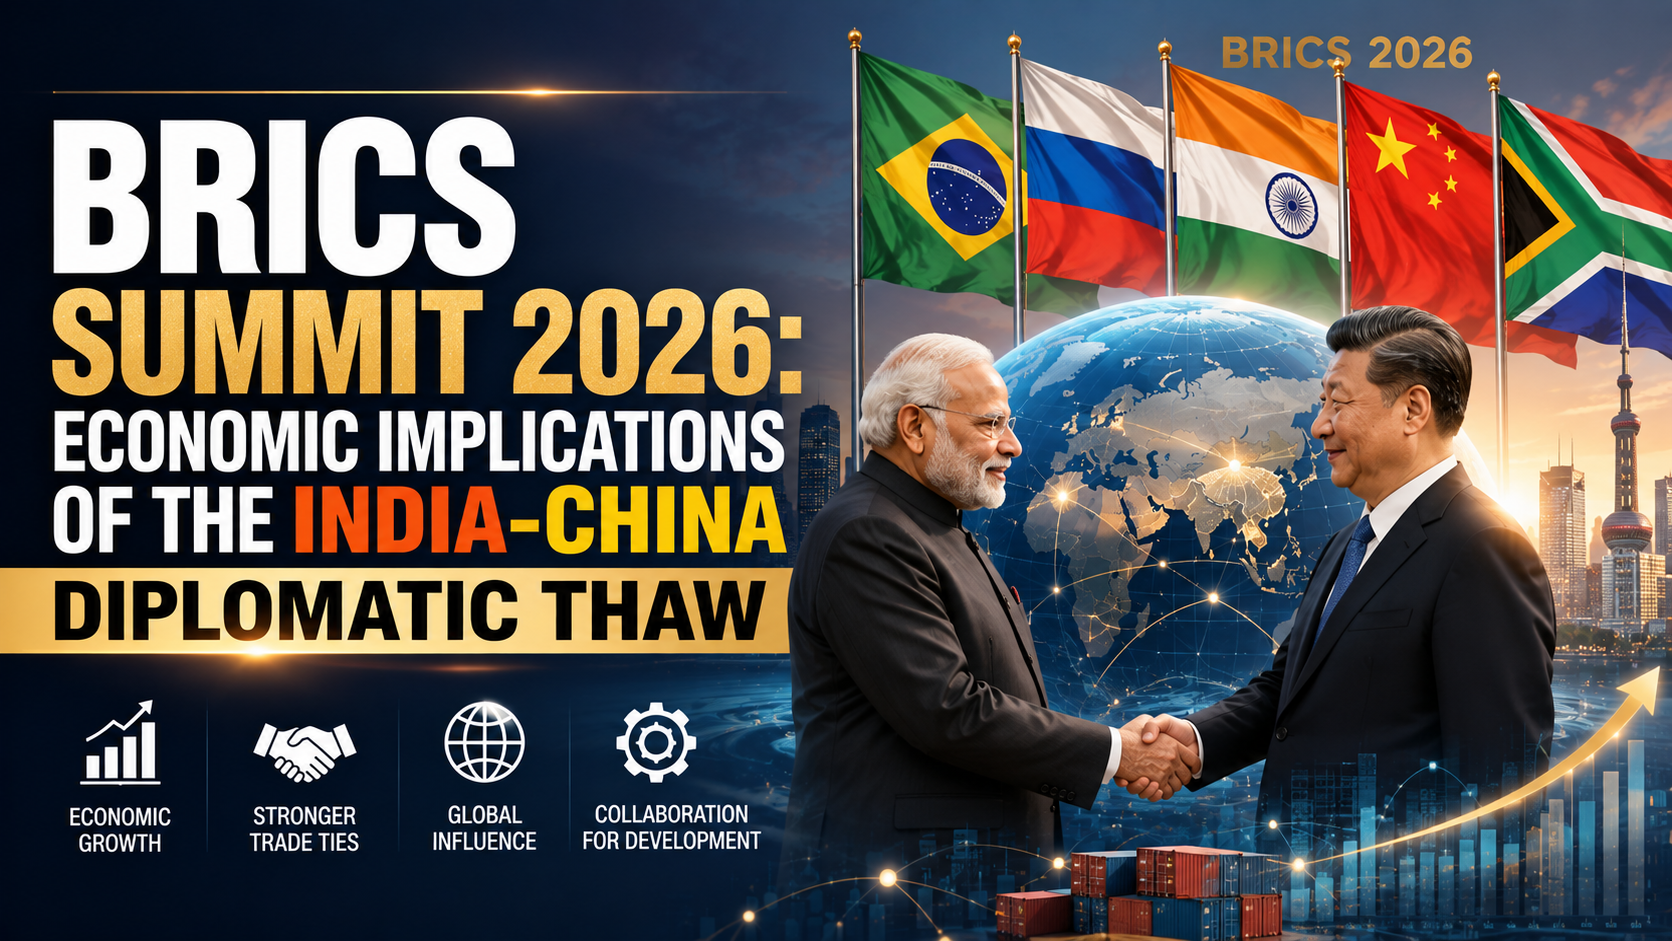
Chinese President Xi Jinping is expected to travel to New Delhi on September 12–13, 2026, for the 18th BRICS Summit — his first visit to India in six years, and the clearest signal yet that Beijing and New Delhi are prepared to move past the 2020 Galwan Valley border clash, according to Indian Defence News. For enterprise strategists and investors positioned across South Asian and Chinese supply chains, this is not a symbolic handshake — it is a signal event with direct implications for trade flows, tariff exposure, and capital competition across the Global South.
From Galwan to Kazan to New Delhi: The Timeline
The normalization process has moved in deliberate stages, not a single reset:
- October 2024 — Kazan, Russia: Modi and Xi meet on the sidelines of the BRICS summit, the first formal meeting since 2019, following a border disengagement agreement, according to The Diplomat.
- 2025 — Resumption of high-level visits: India’s defense and external affairs ministers visited Beijing; China’s Foreign Minister Wang Yi visited New Delhi, producing several bilateral agreements, per The Diplomat.
- August 2025 — Tianjin SCO Summit: Modi and Xi met again, described as the culmination of the resumed high-level engagement.
- May 2025 — India-Pakistan conflict stress test: The thaw survived Beijing providing military and political support to Islamabad against India during a brief conflict — evidence the normalization is now resilient to shocks, per The Diplomat.
- September 12–13, 2026 — New Delhi BRICS Summit: India chairs BRICS for a fourth time, hosting Xi for the first time since 2019, per Indian Defence News.
Why Now: The Strategic Logic on Both Sides
For Beijing, sustaining a frozen conflict with a rising economic power while simultaneously managing friction with Washington over the South China Sea and Taiwan Strait has become strategically costly, per Indian Defence News. For New Delhi, hosting Xi under the multilateral BRICS umbrella allows Modi to project global statesmanship while engaging Beijing without appearing to unilaterally concede on unresolved border issues.
Crucially, analysts at the China-Global South Project note the 2026 dynamic is being shaped primarily by regional realities and a deliberate decoupling of economic cooperation from security disputes — not by U.S. trade pressure, even though Trump-era tariff policy has often been cited as a contributing factor.
Where the Economic Exposure Sits
Import Dependency: India’s Structural Vulnerability
India’s supply chains remain heavily dependent on Chinese intermediate goods, particularly in pharmaceuticals and electronics, according to Indian Defence News. Any further normalization of technology-investment restrictions — India banned a range of Chinese tech applications and tightened border-nation investment rules after Galwan — would be the single highest-impact policy shift for enterprise B2B supply chain planners in the region.
The BRICS Bloc Itself: Expanded and More Consequential
The 2026 summit occurs against a materially expanded BRICS bloc. Since the original five-member group, Egypt, Ethiopia, Iran, Saudi Arabia, and the UAE joined in 2024, and Indonesia joined in 2025, per the official BRICS 2026 site — with ten additional partner countries (Belarus, Bolivia, Cuba, Kazakhstan, Malaysia, Nigeria, Thailand, Uganda, Uzbekistan, Vietnam) joining in 2025. The bloc’s prior Rio summit produced a Leaders’ Framework Declaration proposing to mobilize $300 billion annually by 2035 for climate finance, according to Business Standard.
Trade & Investment Exposure Matrix
| Sector | Pre-Thaw Position (2020–2024) | Post-Thaw Trajectory (2025–2026) | Enterprise Risk/Opportunity |
|---|---|---|---|
| Pharmaceuticals (API imports) | Heavy Indian dependency on Chinese active pharmaceutical ingredients | Potential easing of investment friction | Opportunity: supply diversification talks; Risk: continued single-source dependency |
| Electronics/consumer tech | Chinese app bans, investment screening for border-sharing nations | Selective, cautious relaxation possible | Watch for FDI rule changes ahead of/after the summit |
| Border trade | Suspended since 2020 | Partial resumption of trade at three border outposts | Direct logistics opportunity for regional trade B2B services |
| Africa infrastructure/capital | Parallel, competing Chinese BRI and Indian maritime/digital investment | Continued competition, not cooperation | Africa remains contested capital-deployment theatre, per Indian Defence News |
| AI governance | No joint framework | BRICS Leaders’ Statement on Global AI Governance (Rio) | Multilateral framework emphasizing Global South inclusion, UN-led process |
Sources: Indian Defence News, The Diplomat, Business Standard — see citations above.
What to Watch at the September Summit
- Border trade mechanics: Whether the Working Mechanism for Consultation and Coordination produces concrete friction-point resolutions in eastern Ladakh ahead of the summit, per Indian Defence News.
- Investment-screening rule changes: Any signal India will ease its border-nation FDI restrictions would be the most direct enterprise-relevant outcome.
- Africa positioning: Whether joint statements address, rather than paper over, competing Chinese BRI and Indian maritime-security/digital-investment strategies across the continent.
- AI governance follow-through: Concrete mechanisms building on the Rio AI governance statement, relevant to any enterprise operating AI infrastructure across BRICS-aligned markets.
The Caveat: This Is a Thaw, Not a Resolution
Independent policy analysis from the ISAS Brief is explicit that the Kazan-era thaw has not resolved bilateral mistrust or delivered progress on sensitive issues — it has stabilized the border and eased some economic restrictions without addressing the underlying territorial dispute. The China-Global South Project similarly notes India continues to treat Beijing with caution in the security domain even as it normalizes economic engagement. Investors should read the September summit as confirmation of a durable, deliberate de-escalation track — not as a signal that structural India-China rivalry has been resolved.
The Bottom Line
The India-China thaw formalized at the New Delhi BRICS Summit represents a genuine, multi-year, deliberately sequenced de-politicization of economic relations between two of the world’s largest economies — but one that leaves core security and territorial disputes unresolved. For enterprise and investment strategists, the actionable signal is narrower than “US-China rapprochement” headlines suggest: watch FDI screening rules, pharmaceutical/electronics supply-chain diversification announcements, and border-trade resumption specifics, not broad geopolitical sentiment.
Discover more from The Economy
Subscribe to get the latest posts sent to your email.
Emerging and developing economies face refinancing needs of more than $9 trillion in 2026, according to the Institute of International Finance’s Global Debt Monitor — the largest wall of maturing sovereign and corporate debt these markets have ever faced simultaneously. At the center of that system sits China, now the single largest issuer of emerging-market sovereign debt and, increasingly, the largest bilateral lender of last resort when smaller economies can’t refinance on their own. For institutional investors and foreign-policy-adjacent business strategists, understanding China’s dual role — dominant issuer and dominant creditor — is now a prerequisite for pricing emerging-market risk correctly.
Editorial note on sourcing: a specific figure describing a discrete “$1.3 billion” China sovereign refinancing transaction could not be independently verified against primary reporting at the time of writing. This article instead builds its analysis on verified, dated figures from the OECD, IIF, Moody’s, and peer-reviewed research, and any deal-level claim should be confirmed against primary sources (finance ministry statements, rating-agency releases) before publication or citation.
China’s Dual Role: Issuer and Creditor of Last Resort
China accounted for 45% of total EMDE sovereign bond issuance in 2024, up sharply from just 17% in the 2007–2014 period, according to the OECD’s Global Debt Report 2025. By 2025, China remained the top borrower among a concentrated group — China, India, Brazil, Egypt, and Argentina together represented 78% of EMDE central-government borrowing, per the OECD’s Global Debt Report 2026.
Domestically, Beijing has simultaneously executed one of the largest local-government debt refinancing programs in history: a 6 trillion yuan (roughly $839 billion) swap of “hidden” local-government debt into standardized bonds, approved in late 2024 and implemented through 2026, according to VOA News. By mid-2026, Chinese provinces had used nearly 94% of that swap allowance, according to Bloomberg.
Internationally, China has also re-entered dollar sovereign bond markets at scale — its 2026 international offering was reported as its largest ever, oversubscribed well beyond target, according to Business Standard/Reuters reporting on the prior comparable issuance. This dual positioning — massive domestic refinancing plus expanding international issuance — gives China outsized influence over EM bond-market liquidity and pricing benchmarks that smaller sovereigns then reference for their own issuance.
The $9 Trillion Wall: Why 2026 Is Different
The scale of what’s coming due matters more than any single deal. Key figures from the IIF’s Global Debt Monitor and OECD’s 2026 report:
- Gross EMDE central-government borrowing crossed $4 trillion in 2025, up from roughly $3 trillion in 2024.
- Around 36% of outstanding EMDE bond stock matures within three years.
- Low-income countries face the sharpest cliff: 52% of their outstanding bonds mature by 2028, with 29% due by the end of 2026 alone.
- Secondary-market yields on maturing debt now exceed 10% for non-investment-grade sovereigns, meaning refinancing at current rates locks in materially higher debt-service costs than the original issuance.
Refinancing Cost Comparison: Then vs. Now
| Issuer Tier | Original Issuance Yield (illustrative range) | 2026 Refinancing Yield | Refinancing Risk |
|---|---|---|---|
| Investment-grade EMDEs (e.g., select Gulf, Southeast Asia sovereigns) | 3–5% | 5–7% | Moderate — absorbable within fiscal space |
| Non-investment-grade EMDEs | 6–8% | 10%+ | High — debt-service costs rising faster than revenue growth |
| Low-income issuers (heavy China bilateral exposure) | Concessional/below-market | Market-rate or restructured terms | Severe — 29% of debt stock matures by end of 2026 |
Source: OECD Global Debt Report 2025/2026 (see citations above); ranges are illustrative of documented tier-level trends, not specific bond issues.
The Restructuring Precedent: What Happens When Refinancing Fails
China’s response to sovereign distress has evolved into a distinct pattern that investors increasingly price into risk premiums. Research published via the National Bureau of Economic Research documents a rising trend of “re-structurings” — repeated restructurings of the same debt with the same creditor — echoing the drawn-out resolution patterns of prior global debt crises. Angola, Ecuador, Seychelles, Sri Lanka, and Venezuela have each undergone two or more restructurings with Chinese state creditors.
Sri Lanka’s case is illustrative of the mechanics: China Development Bank extended a $500 million financing facility in 2020, and a subsequent equity-linked arrangement brought in $1.12 billion in cash that Colombo used to repay non-Chinese creditors, according to Oxford Academic’s International Affairs journal. These bilateral bridge arrangements illustrate how China’s rescue lending functions as a parallel track to traditional Paris Club-style restructuring — often faster to arrange, but less transparent to third-party bondholders pricing the same sovereign’s risk.
Regional Ripple Effects: Where Investors Should Watch Closely
Direct Exposure Zones
- Sub-Saharan Africa: Heaviest concentration of low-income issuers facing near-term maturity walls and prior China restructuring history (Angola, Zambia).
- South Asia: Sri Lanka’s precedent shapes how markets price Pakistan and Bangladesh refinancing risk.
- Latin America: Ecuador and Venezuela carry documented repeat-restructuring histories; Argentina remains among the top-five EMDE borrowers by volume.
Indirect / Second-Order Exposure
- Gulf and Southeast Asian investment-grade sovereigns face rising benchmark yields even without direct restructuring risk, simply because China’s issuance volume moves the EM bond-pricing benchmark broadly.
- Enterprise B2B lenders and trade-finance providers operating in these corridors should treat sovereign-refinancing stress as a leading indicator of counterparty and currency risk, not a lagging one.
An Investor Risk-Monitoring Framework
- Track maturity-wall concentration, not headline debt-to-GDP. A country with moderate debt-to-GDP but a heavy 2026–2028 maturity cliff carries more near-term risk than a higher-leverage country with a smoothed maturity profile.
- Distinguish China’s domestic refinancing (yuan-denominated, largely contained) from its role as an external EM creditor (dollar/foreign-currency exposure, higher spillover risk).
- Watch for repeat-restructuring signals. Countries with a prior China restructuring are statistically more likely to require another, per the NBER research above — treat this as a standing risk flag, not a one-time resolved event.
- Monitor secondary-market yield spreads on maturing debt versus issuance-year yields as the clearest real-time signal of refinancing stress building in a specific sovereign.
The Bottom Line
China’s simultaneous role as the largest domestic debt-refinancer in EM history and the most influential external creditor to distressed sovereigns makes it the single most important variable in the 2026 emerging-market debt outlook. The $9 trillion refinancing wall isn’t a uniform risk — it’s concentrated in low-income issuers with the heaviest prior China bilateral exposure, and that concentration is exactly where enterprise investors, trade-finance providers, and sovereign-risk analysts should be focusing due diligence through the remainder of 2026.
Discover more from The Economy
Subscribe to get the latest posts sent to your email.
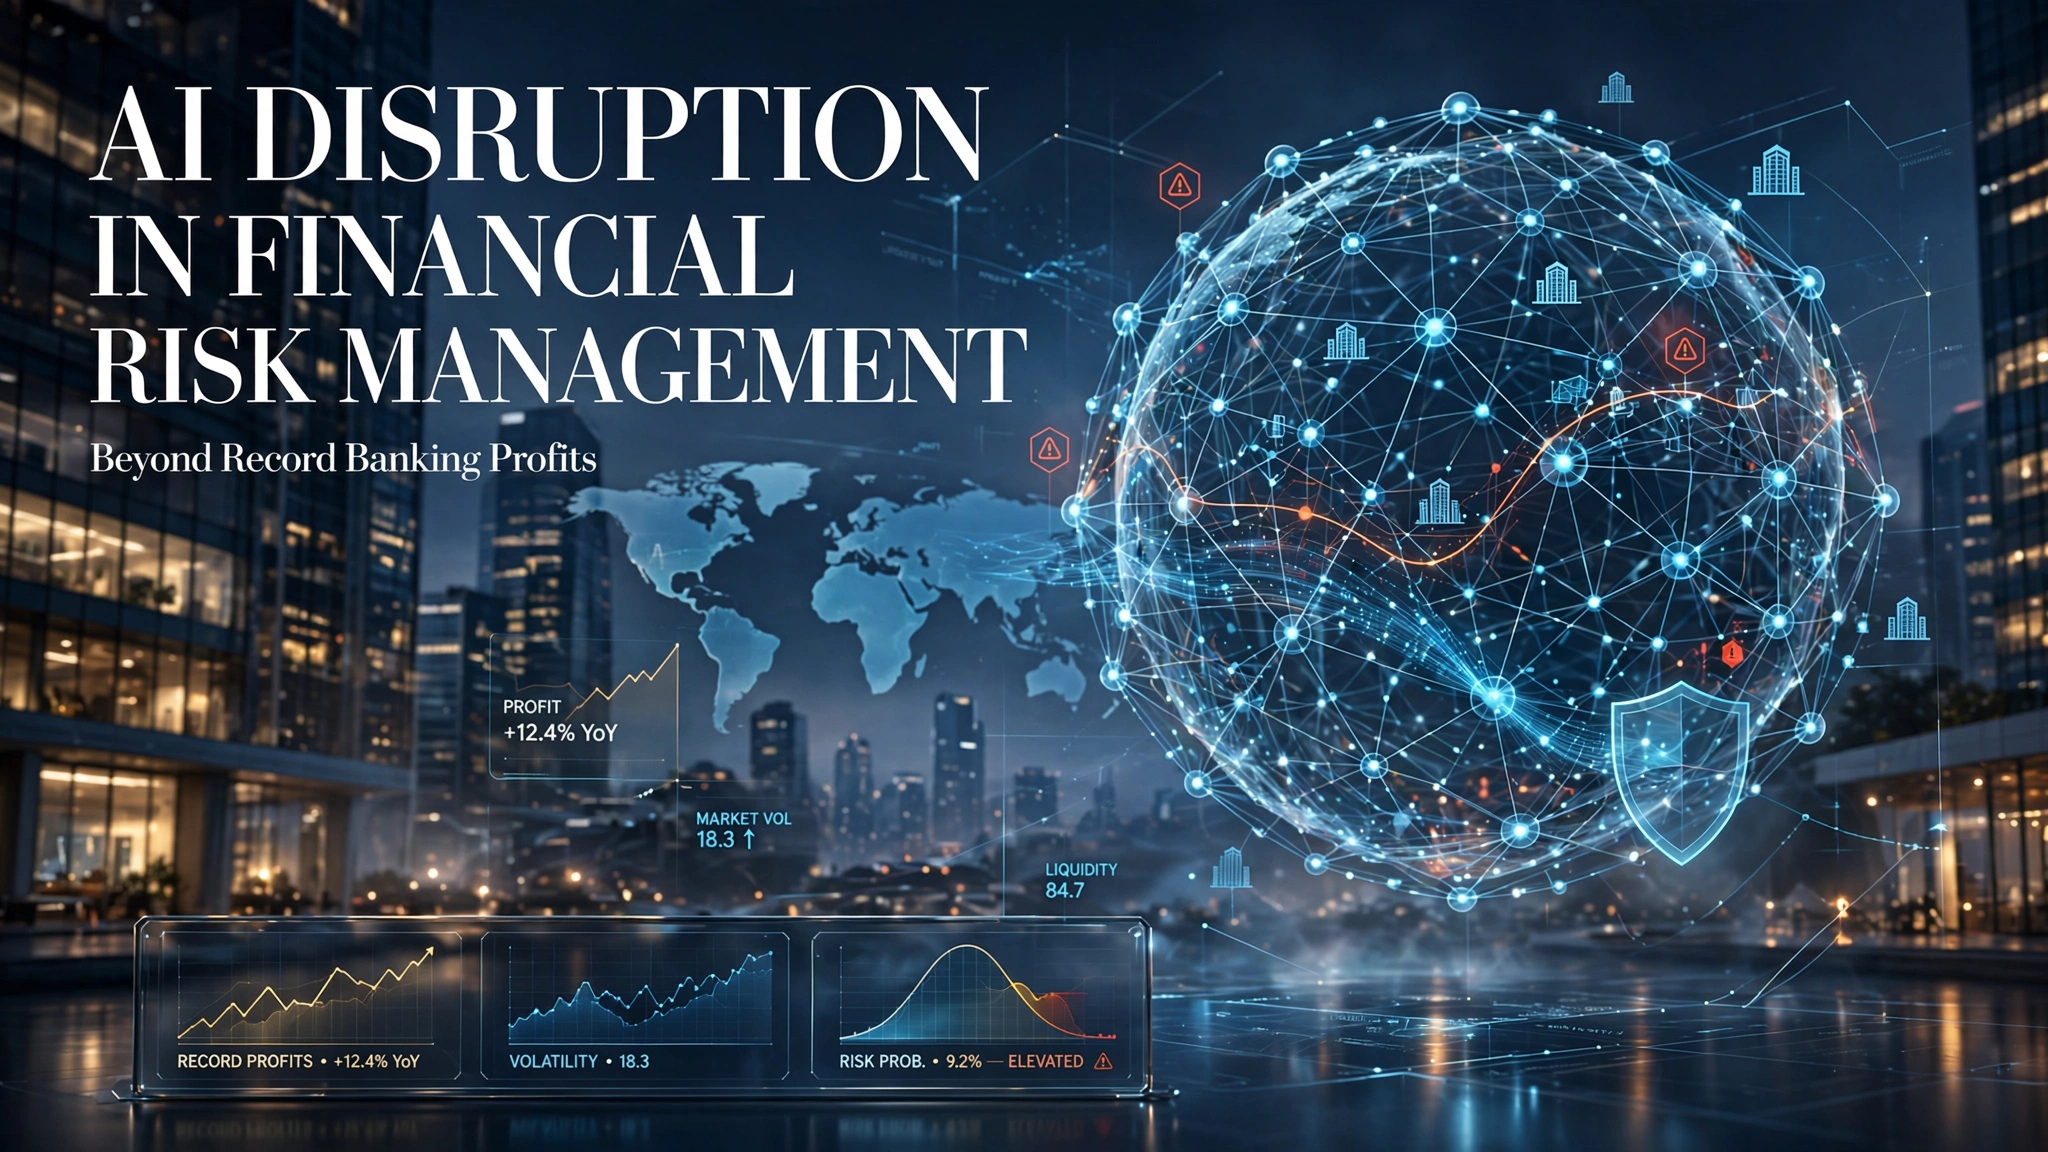
Key Takeaways
- Major US banks generated $47 billion in profits in early 2026 while cutting roughly 15,000 positions tied to AI-driven restructuring — a genuine profit-and-disruption paradox playing out simultaneously.
- Academic research finds AI-adopting banks experience measurably lower default risk, credit risk, and systematic risk versus non-adopters — a causal, not merely correlational, risk-reduction effect.
- Generative AI could contribute $200-340 billion annually to global bank profits through productivity gains and automation, with Morgan Stanley citing a $740 billion 2026 AI capex wave as a direct tailwind for bank financing revenue.
- AI incidents carry a measurable market cost: a study of five US banks found an average short-term cumulative abnormal stock return loss of -21% following AI incidents, with negative spillover to the broader financial sector.
- Real-time credit exposure monitoring is emerging as AI’s most consequential risk-management application — recalculating counterparty exposure continuously as transactions execute, rather than discovering limit breaches the next morning.
A Genuine Paradox: Record Profits, Real Disruption
The defining tension in banking’s 2026 AI story is that efficiency gains and workforce disruption are happening at the same institutions, in the same reporting period, without contradiction. The 21,490 AI-related layoffs recorded in April 2026 and the $47 billion in profits generated by major banks while cutting 15,000 positions represent just the opening chapter of a restructuring that will reshape the industry over the coming decade — a transformation creating both risks and opportunities for investors simultaneously. JPMorgan Chase has emerged as the clearest example of how major financial institutions are restructuring entire organisations around AI capabilities rather than simply layering AI tools onto existing operations.
That reskilling gap is real and measurable at the industry level. The World Economic Forum reports that 77% of employers plan to reskill workers in response to AI disruption, yet only 57% report having created genuine reskilling pathways in practice — a gap between stated intention and operational execution that creates both human and financial-stability risk.
The Evidence: AI Adoption Causally Reduces Bank Risk
Beyond the headline profit and disruption figures sits a more academically rigorous finding that deserves more attention than it typically receives: AI adoption appears to make banks genuinely safer, not just more efficient. Research strongly supports this: AI-adopting banks experience lower default risk, measured by lower probability of default; lower credit risk, with smaller non-performing loan ratios and loan-loss provisions; and lower systematic risk, indicating that AI-adopting banks’ equity values are less exposed to economy-wide shocks and cyclical downturns. These effects remain robust after controlling for bank size, profitability, leverage, governance, and ESG performance, with consistent evidence that AI adoption causally reduces risk rather than simply reflecting already-safer institutions.
Two mechanisms explain this effect: enhanced risk management, where AI enables real-time credit monitoring, early detection of loan deterioration, and automated compliance screening, improving portfolio quality and lowering default probabilities. This is the strongest empirical grounding available for the “AI as risk-management upgrade” thesis, as distinct from the more commonly cited “AI as cost-cutting tool” narrative.
Real-Time Risk: The Practical Application
The operational shift this enables is significant. AI enables risk assessment at the speed of the business: as transactions execute, credit exposure to counterparties is recalculated continuously, and limit breaches are detected in real time rather than discovered the next morning. For risk managers, that shift from batch-processed, next-day exposure reporting to continuous real-time monitoring represents a genuine structural upgrade in how counterparty risk is managed — not merely a faster version of the same process.
The Capital and Profit Case
The scale of capital flowing into this transition is substantial, and banks sit at the centre of financing it. With an expected $740 billion in AI capex in 2026, banks stand to benefit from rising financing demand, resilient M&A activity, and long-term efficiency gains — AI is poised to be a net positive for banks, with disruption risks considered manageable even as investors worry about job losses and macro impacts. AI is driving major efficiency gains for banks, potentially boosting productivity by 20% to 50% over the next five to ten years.
The productivity dividend estimate at the global level is similarly large: generative AI could contribute between $200 billion and $340 billion a year to global bank profits through productivity advances and automation, with banks introducing knowledge agents powered by large language models in 2026 that can extract rich insights from loan applications, financial statements, and customer communications at scale.
Comparative Table: AI’s Dual Effect on Bank Risk Profile
| Dimension | Risk-Reducing Effect | Risk-Increasing Effect |
|---|---|---|
| Credit risk | Lower non-performing loan ratios, better early detection | New model/hallucination risk in credit decisioning |
| Operational risk | Real-time exposure monitoring, automated compliance | Cascading agentic-AI errors across chained workflows |
| Market/systematic risk | Lower exposure to economy-wide shocks (per LSE research) | AI-incident-driven stock price shocks (-21% average CAR) |
| Fraud risk | AI-powered fraud detection catches anomalies faster | AI-enabled deepfake fraud up over 2,000% in three years |
| Capital allocation | $740bn AI capex driving bank financing revenue | Chicago Fed-flagged tail risk from AI-adjacent loan exposure |
Why It Matters: The New Tail Risks Nobody Priced In
The efficiency and risk-reduction case is genuine, but it is only half the picture — AI introduces categorically new failure modes that traditional bank risk frameworks were not built to handle. Because AI agents chain tools and call other agents, a single error can propagate quickly through banking workflows, with resulting failures cascading into transaction and payment errors, data privacy breaches, and technical failures that become operational disruptions — a mispriced trade, a duplicated payment, or a misrouted customer instruction can multiply across systems before a human reviewer sees the first alert. Generative models still produce confident but incorrect outputs, and in agentic systems, those outputs become instructions: a model that hallucinates a policy, a customer entitlement, or a calculation rule can trigger actions the bank never approved.
The market has already begun pricing this risk directly. Analysis of five US banks and financial services firms found the average short-term cumulative abnormal stock return loss following an AI incident was -21.04%, with the negative impact spreading to the broader financial industry within a three-day window — a measurable, quantified market penalty for AI-related operational failures.
A Systemic-Level Concern
Regulators are increasingly framing this as a financial-stability issue, not just an institution-level risk. IMF analysis suggests that extreme cyber-incident losses could trigger funding strains, raise solvency concerns, and disrupt broader markets, with advanced AI models dramatically reducing the time and cost needed to identify and exploit vulnerabilities — raising the likelihood of simultaneously discovering and targeting weaknesses in widely used systems, meaning cyber risk is increasingly about correlated failures that could disrupt financial intermediation, payments, and confidence at the systemic level.
Separately, the Federal Reserve Bank of Chicago has explicitly flagged banks’ exposure to the AI investment boom itself as a distinct tail risk: commercial loans underwritten by banking institutions have been one of the mechanisms fuelling the capital expenditure increase across the AI value chain, creating a possible AI-bubble tail risk — the risk of losses due to extremely rare events — through banks’ direct lending exposure to AI-adjacent borrowers.
The Governance Gap: Adoption Outpacing Control Frameworks
Nearly 80% of large financial institutions now use some form of AI in core decision-making processes, according to the Bank for International Settlements, yet deploying AI at scale using control frameworks designed for a pre-AI world introduces structural vulnerabilities that can translate into earnings volatility, regulatory exposure, and reputational damage, at times within a single business cycle. For financial analysts, the maturity of a bank’s AI control environment — revealed through disclosures, regulatory interactions, and operational outcomes — is becoming as telling a signal as capital discipline or risk culture.
Profitability outcomes from AI adoption also remain more mixed than the headline productivity estimates suggest: only 40% of respondents report increased profitability from AI, while 43% report no change — a reminder that the $200-340 billion global profit-uplift estimate represents a potential ceiling, not a guaranteed outcome, and depends heavily on execution quality.
What to Do Next
- Distinguish AI-driven risk reduction from AI-driven risk creation when assessing a bank’s AI strategy — both are simultaneously real, and the net effect depends on control-framework maturity, not adoption speed alone.
- Treat a bank’s AI governance disclosures as a genuine credit-quality signal, following the CFA Institute’s framing that AI control-environment maturity is becoming as informative as traditional capital and risk-culture metrics.
- Watch for AI-incident-driven equity volatility as a distinct, quantifiable risk category — the documented -21% average abnormal return following AI incidents is a material, not theoretical, market risk.
- Monitor bank lending exposure to AI-value-chain borrowers as a systemic tail-risk indicator, per the Chicago Fed’s direct warning about commercial loan exposure to AI capital expenditure.
- Prioritise real-time exposure monitoring adoption as the highest-value, most empirically supported AI risk-management application, given its direct link to measurably lower default and credit risk in academic research.
FAQ
Does AI actually make banks safer, or does it just make them more efficient?
Rigorous academic research finds both are true simultaneously: AI-adopting banks experience causally lower default risk, credit risk, and systematic risk, driven primarily by enhanced real-time risk management and early deterioration detection — this is a genuine risk-reduction effect, not just an efficiency gain.
What is the biggest new risk that AI introduces to bank risk management?
Agentic AI systems that chain tools and call other agents can propagate a single error rapidly through banking workflows, with hallucinated policies or entitlements becoming executed instructions — and the market has already priced this risk, with AI incidents at banks associated with an average -21% short-term stock return loss.
How much could AI add to global bank profits?
Generative AI could contribute between $200 billion and $340 billion a year to global bank profits through productivity advances and automation, though only about 40% of institutions currently report actually realising increased profitability from their AI investments.
Discover more from The Economy
Subscribe to get the latest posts sent to your email.

BRICS Summit 2026: Economic Implications of the India-China Diplomatic Thaw

Emerging Market Debt: The Ripple Effect of China’s Sovereign Refinancing Role

Dropping Oil & Surging Gold: Navigating Safe-Haven Investments in Q3

2026 AI Stock Frenzy: How to Position Your Portfolio

The AI Disruption in Financial Risk Management: Moving Beyond Record Banking Profits

The Rise of Green Aviation: Balancing High Fuel Prices with Sustainable Infrastructure

US-China Relations in Q3 2026: Trade Tariffs and Supply Chain Risks

Emerging Markets Rebound: Top Stock Strategies for the Gulf and South Asia

Tackling the 2026 Global Food Crisis: Policy Shifts and Market Speculation

Post-Quantum Encryption in Banking: The Next Frontier in Cybersecurity Investments

The Financial Cost of Sanctions: Afghanistan’s Economy 5 Years Under the Taliban

Supply Chain Fragmentation: 10 Trends Reshaping Global Trade This Year

The 2026 Aviation Boom: Investing in Airline Stocks as Passenger Traffic Surges

China’s 2026 Corporate Laws: Western Compliance Guide

China Politburo July 2026: Stimulus Signals Explained

Russia Fuel Shortages 2026: Inside a Cracking War Economy

Top 15 Financial Stocks for Investment in PSX

State Farm’s $5B Dividend 2026: Who Qualifies & Payout Dates

Pakistan Passed Its Third IMF Review

SpaceX Stock Lockup Expiration Explained: Why $123B in Shares Could Hit the Market

Pakistan IMF Program 2026: Inside the Push Toward an Interest-Free Economy

Andy Burnham, UK Gilts and Mortgages: July 2026 Explainer

Russia Oil Revenue 2026: How Sanctions on Rosneft and Lukoil Are Draining the War Chest

Pakistan’s 2026 Monsoon Floods Threaten Fragile Economic Recovery as Inflation Nears 9%

Russia Oil Revenue 2026: The Iran War Windfall and What a Hormuz Deal Means for Moscow

Gold Price 2026: Why Bullion Has Fallen 25% From Its January Record High

Canada US Trade War 2026: Inside Carney’s Push to Cut Ties With Trump’s Tariffs

Russia’s Budget Deficit Blew Past Its Full-Year Target in Three Months
-

 Markets & Finance8 months ago
Top 15 Stocks for Investment in 2026 in PSX: Your Complete Guide to Pakistan’s Best Investment Opportunities
-

 Analysis6 months ago
Johor’s Investment Boom: The Hidden Costs Behind Malaysia’s Most Ambitious Economic Surge
-

 Analysis6 months ago
Top 10 Stocks for Investment in PSX for Quick Returns in 2026
-

 Analysis7 months ago
Brazil’s Rare Earth Race: US, EU, and China Compete for Critical Minerals as Tensions Rise
-

 Banks7 months ago
Best Investments in Pakistan 2026: Top 10 Low-Price Shares and Long-Term Picks for the PSX
-

 Investment8 months ago
Top 10 Mutual Fund Managers in Pakistan for Investment in 2026: A Comprehensive Guide for Optimal Returns
-

 Global Economy8 months ago
15 Most Lucrative Sectors for Investment in Pakistan: A 2025 Data-Driven Analysis
-

 Global Economy8 months ago
Pakistan’s Export Goldmine: 10 Game-Changing Markets Where Pakistani Businesses Are Winning Big in 2025