Connect with us

Analysis

Singapore Dollar Slides 1.1% as Iran War Sparks a Safe-Haven Rush to the Dollar

Published

on

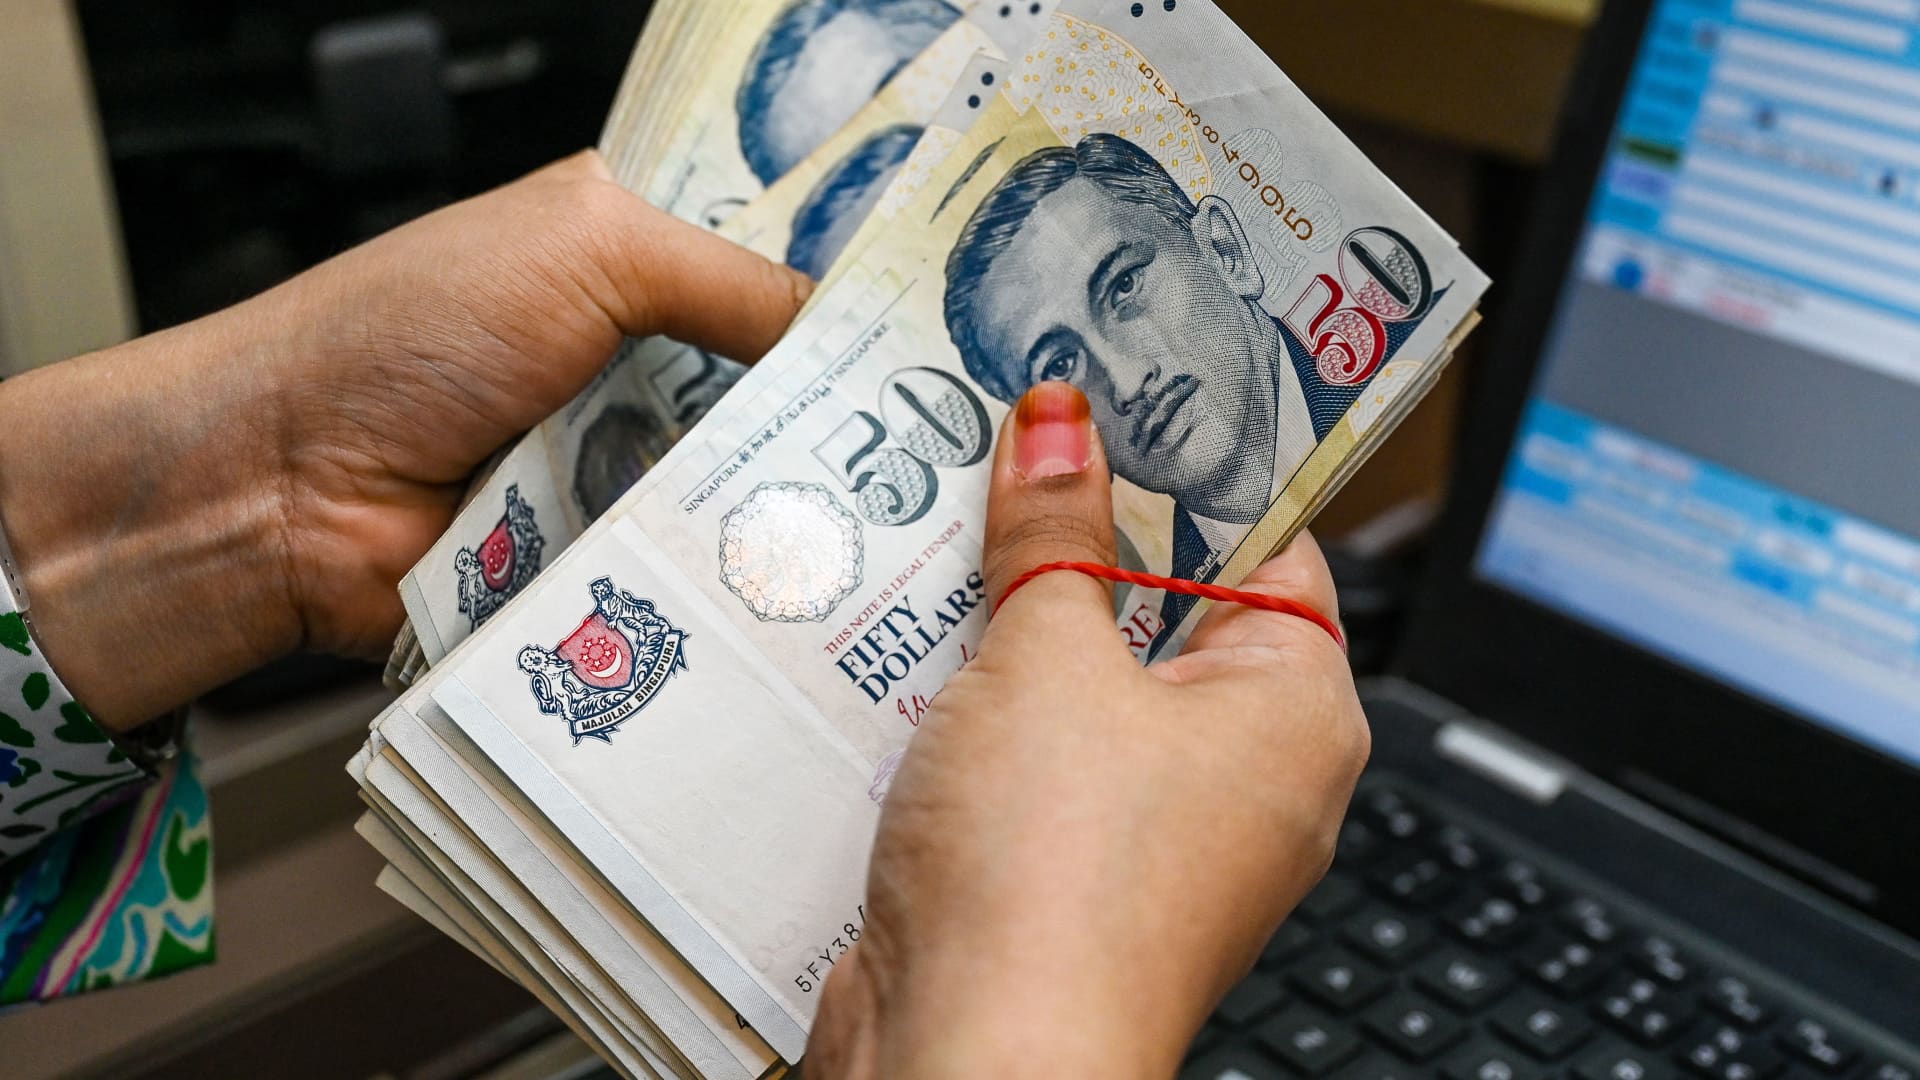
As US and Israeli strikes reshape the Middle East’s energy map, the SGD retreats — but Singapore’s fundamentals offer more ballast than the headlines suggest

The Singapore dollar has shed more than a full percentage point against the US dollar in five trading sessions, the steepest weekly decline the currency has seen in months — but the real story is not the number on the screen. It is the cascade of events that produced it: coordinated American and Israeli airstrikes on Iran that killed Supreme Leader Ayatollah Ali Khamenei over the weekend of 28 February, a de facto closure of the Strait of Hormuz, Brent crude surging past $84 a barrel, and a stampede of global capital into the one refuge that never seems to go out of fashion — the US dollar.

On Wednesday morning in Singapore, SGD/USD was quoted at approximately 0.7824, meaning one Singapore dollar buys just over 78 US cents. Flipped into the more commonly traded convention, USD/SGD stood at 1.278, its highest point since late 2025. The move places the pair at the centre of a broader emerging-market rout: an MSCI gauge of developing-nation currencies logged its worst single session since November 2024 on Monday, as central banks in Indonesia, Turkey and India were forced to intervene. Singapore, by contrast, did neither — a quiet signal of relative confidence.

Market Snapshot: Key Data as of 4 March 2026

AssetLevel5-Day Change
SGD/USD0.7824−1.1%
USD/SGD1.278+1.1%
DXY (US Dollar Index)~99.7 → 99.16+~1.0% (WTD)
Brent Crude$82.76/bbl+13.5% (WTD)
WTI Crude$75.48/bbl+12.0% (WTD)
Straits Times Index (STI)~4,800 est.−1.6% (WTD)
Fed Rate Cut (first fully priced)September 2026Pushed back from July

Sources: Bloomberg, CNBC, TradingEconomics, Wise FX

The Geopolitical Trigger: When “Operation Epic Fury” Hit the FX Markets

The catalyst arrived without warning on the weekend of 28 February, when US and Israeli forces launched what President Donald Trump dubbed “Operation Epic Fury” — a massive wave of coordinated strikes against Iranian nuclear and military infrastructure. Tehran responded with missile salvos targeting Gulf energy facilities, and within hours the commander of Iran’s Revolutionary Guard declared the Strait of Hormuz closed, threatening to “set any ship on fire” that attempted passage.

The consequences for energy markets were immediate and severe. Brent crude, which had closed near $73 per barrel on the Friday before the strikes, surged as high as $85 at one point on Tuesday — a level last seen in early 2024 — before settling into a still-elevated range around $82–84 by Wednesday. WTI rose above $75. The Strait of Hormuz typically channels roughly 20 per cent of the world’s seaborne oil and vast volumes of Qatari liquefied natural gas; QatarEnergy halted LNG production after attacks on its Ras Laffan export site, sending European natural gas futures rocketing more than 40 per cent in a single session.

For foreign-exchange markets, the transmission mechanism was swift and familiar: energy shock → inflation risk → narrowing Fed rate-cut expectations → dollar strength. The US dollar index gained nearly 1 per cent on Monday alone, erasing its losses for 2026 and trading at a five-week high. By Wednesday, DXY hovered near 99.7 before easing slightly to 99.16, approaching but not yet piercing the psychologically important 100 level. Meanwhile, former Treasury Secretary Janet Yellen summed up the Fed’s dilemma bluntly: “The recent Iran situation puts the Fed even more on hold, more reluctant to cut rates than they were before this happened.”

The market agrees. Rate futures now push the first fully priced Fed cut to September, two months later than the July consensus that prevailed before the weekend — a shift with direct implications for dollar-denominated carry trades and Asian currency valuations alike.

Singapore: Risk-Off, but Relatively Contained

Against that backdrop, the Singapore dollar’s 1.1 per cent weekly retreat looks, in context, almost orderly. Senior economists Chua Han Teng and Radhika Rao at DBS Group Research offered the most measured institutional read on the situation, noting that “Singapore’s financial markets saw risk-off but contained movements,” with the benchmark equity index — the Straits Times Index — declining approximately 1.6 per cent, and the SGD weakening by around 1 per cent. Their conclusion: “The economy [is] confronting uncertainty from a relatively strong position, amid solid growth momentum buoyed by global artificial intelligence-related tailwinds and still-low inflation at the start of 2026.”

That framing is important. Singapore entered this crisis with considerably more macro cushion than many of its emerging-market peers. In January 2026, the government upgraded the full-year GDP growth forecast to a range of 2 to 4 per cent, lifted higher in part by the sustained global boom in artificial intelligence infrastructure investment — a wave that has turbocharged Singapore’s data-centre sector, financial services exports and semiconductor-adjacent supply chains. Core inflation, meanwhile, was running well within the Monetary Authority of Singapore’s 1–2 per cent target band heading into the conflict.

The MAS moved quickly to reassure markets. In a statement issued on 2 March, the central bank confirmed that it is “closely monitoring developments arising from the ongoing situation in the Middle East, and is assessing the impact on the domestic economy and financial system.” Critically, it confirmed that “Singapore’s foreign exchange and money markets continue to function normally,” and that the Singapore dollar nominal effective exchange rate — the S$NEER — “remains within its appreciating policy band, which will continue to dampen imported inflationary pressures.” Translation: the MAS is not panicking, and the exchange-rate framework is doing exactly what it was designed to do.

Deputy Prime Minister Gan Kim Yong told Parliament on 2 March that a prolonged conflict could push up prices and weigh on growth, and that the government stands ready to revise GDP and inflation forecasts if conditions warrant. He also pointed to Budget 2026 measures designed to build precisely this kind of economic resilience.

Singapore’s Structural Vulnerabilities and Compensating Strengths

The city-state is not, however, immune. As a small, highly open economy with no domestic energy production, Singapore is structurally exposed to Persian Gulf disruptions through multiple channels simultaneously. More than 14 million barrels of crude oil per day typically pass through the Strait of Hormuz, with roughly three-quarters destined for China, India, Japan and South Korea — the same economies to which Singapore’s trading, logistics and financial infrastructure is intimately connected. A sustained Hormuz disruption ripples outward through shipping costs, LNG prices and ultimately consumer price indices.

Maybank economist Dr Chua Hak Bin had flagged in advance that inflation was an underappreciated risk in 2026, citing rising semiconductor prices and the unwinding of Chinese export deflation — a deflationary cushion that had kept manufactured goods prices suppressed for several years. A Gulf supply shock superimposes an energy cost surge on top of those pre-existing pressures. If the conflict persists beyond four to six weeks, Singapore’s core inflation could break above the MAS’s 1–2 per cent forecast band, creating pressure on the central bank to shift its exchange-rate policy.

On the currency’s specific bilateral move, three forces are at work. First, broad dollar strength driven by safe-haven demand and reduced Fed easing expectations. Second, a modest compression of Singapore’s yield advantage as global risk premia widen. Third, the direct trade exposure: Singapore’s port and re-export economy is a node through which Middle East energy flows toward the rest of Asia — a role that, if interrupted, shrinks the near-term growth outlook priced into SGD. The relative outperformance of SGD versus, say, the Indonesian rupiah or the Thai baht reflects the first factor (safe-haven properties of a highly creditworthy small open economy) partially offsetting the second and third.

Global Macro: The Fed Between Two Fires

For the Federal Reserve, the Iran conflict has arrived at the most uncomfortable possible moment. US inflation stood at 2.4 per cent in January 2026, already above the 2 per cent target. JPMorgan Chase CEO Jamie Dimon put the conundrum plainly: “This right now will increase gas prices a little bit, and again, if it’s not prolonged it’s not going to be a major inflationary hit. If it went on for a long time, that would be different.”

Markets are currently pricing in two 25-basis-point cuts by year-end — but with the first fully expected cut pushed to September and genuine uncertainty about supply-side inflation, even that modest easing path is far from guaranteed. Nomura economists have flagged the dilemma facing Asian central banks as a binary: tolerate higher inflation, or absorb the fiscal cost of consumer subsidies. “So which ‘negative’ do you want to have: higher inflation or worse fiscal?” asked Rob Subbaraman, Nomura’s head of global macro research.

Barclays analysts have flagged a scenario where Brent reaches $100 per barrel if Hormuz remains blocked, with UBS seeing potential for $120 in an extreme-disruption case. Even BMI, which maintained its full-year Brent forecast at $67 per barrel, acknowledged that its core view rests on a “brief spike in March, followed by rapid retracement” — an assumption that requires a relatively swift de-escalation. President Trump, who has said the conflict “could become a prolonged battle,” has offered no such assurance.

What It Means for Investors — and for Travellers

For Singapore-based investors, the near-term calculus involves navigating a market that is simultaneously buffeted by geopolitical risk and buoyed by structural AI-driven growth. DBS’s equity strategy team identified defence, oil-and-gas, and shipbuilding names — including ST Engineering, Seatrium and Nam Cheong — as likely near-term beneficiaries, while flagging headwinds for aviation, transport and interest-rate-sensitive REITs. At the same time, the STI’s historical tendency to recover geopolitical drawdowns within 60 days — an average of 6 to 7 per cent decline over that window — provides a baseline for calibrating exposure.

For the millions of travellers who use Singapore as a hub or who hold SGD-denominated accounts, the currency move has a practical dimension. A weaker Singapore dollar means purchasing power against USD-denominated goods and services — American hotel rates, US flight tickets, dollar-priced tours across Southeast Asia — has declined. At 0.7824, a Singapore traveller exchanging S$5,000 receives around US$3,912, compared with roughly US$3,963 before the conflict. That is not a catastrophic shift, but it underscores the direct household relevance of geopolitical shocks that often appear abstract. Conversely, travellers to Singapore from the United States will find the city-state modestly more affordable — a silver lining for inbound tourism that Singapore’s hotel and hospitality sector will welcome.

Forward Outlook: A Corridor of Uncertainty

The range of plausible outcomes from here is unusually wide. At one end: a swift diplomatic resolution, Hormuz reopens, oil retraces toward $70, the Fed resumes its cutting cycle in July, and the SGD recovers toward the 0.79–0.80 range versus the dollar that prevailed in early 2026. At the other: a conflict lasting weeks or months, Brent sustaining above $90 or beyond, core inflation breaking above MAS targets, and USD/SGD testing 1.30 or higher.

What keeps Singapore closer to the optimistic scenario than most of its peers is precisely what DBS’s economists identified: the economy is not entering this shock from a position of vulnerability. The AI investment supercycle, export resilience, low pre-crisis inflation, and MAS’s exchange-rate-based policy framework — which can tighten by allowing a faster SGD appreciation when inflation threatens — all represent buffers unavailable to less structurally sound emerging markets.

The MAS’s managed float system, in which the S$NEER is guided within a policy band that prioritises inflation control over short-term exchange-rate stability, is arguably the most sophisticated monetary transmission mechanism in Asia. The current episode is not testing its limits — not yet.

One number to watch above all others: Brent crude. If it holds below $90 and Hormuz traffic resumes within weeks, Singapore’s financial markets are likely to absorb this shock with the composure they have shown so far. If it approaches $100 and the geopolitical calendar darkens further, the MAS will face choices it would prefer not to make.

The Conclusion

The Singapore dollar’s retreat is real, but it is not a verdict. Markets price fear before they price facts, and the facts of Singapore’s economic position in early 2026 — strong growth momentum, low inflation, a credible central bank, and an economy wired into the AI-powered future — are considerably more durable than the fear that moved the currency by a percentage point this week. In the fog of geopolitical war, that is worth remembering.

A weaker SGD is a symptom of global anxiety. Singapore’s fundamentals are the cure — and they remain intact.


Discover more from The Economy

Subscribe to get the latest posts sent to your email.

Analysis

Digital Economy as Pakistan’s Next Economic Doctrine: A Growth Debate Trapped in the Past

Published

on

Understanding the Digital Economy: More Than a Sector, a System

There is a persistent category error at the heart of Pakistan’s economic policymaking. Officials speak of the “digital economy” the way an earlier generation spoke of textiles or agriculture — as a discrete sector, a line on an export ledger, a portfolio to be managed rather than a platform to be built. This confusion is not merely semantic. It shapes budget allocations, regulatory frameworks, institutional mandates, and, ultimately, the trajectory of a nation of 240 million people standing at a crossroads between chronic underdevelopment and a genuinely plausible economic transformation.

The digital economy, properly understood, is not a sector. It is the operating system upon which all modern economic activity increasingly runs. It encompasses the digitisation of production processes, the datafication of consumer behaviour, the platformisation of labour markets, and the emergence of knowledge as the primary factor of production. When the World Bank’s April 2025 Pakistan Development Update frames digital transformation as Pakistan’s most credible path toward export competitiveness and sustained growth, it is not advocating for a bigger IT park in Islamabad. It is arguing for a wholesale reimagining of what the Pakistani economy produces, and for whom.

That reimagining has begun — tentatively, unevenly, and against considerable institutional resistance. The numbers, for once, are genuinely exciting. Pakistan IT exports reached $3.8 billion in FY2024–25, with the momentum building sharply into the current fiscal year: $2.61 billion in IT and ICT exports were recorded between July and January of FY2025–26, a 19.78% increase year-on-year, according to data released by the Pakistan Software Export Board (PSEB). December 2025 delivered a record single-month figure of $437 million — the highest in the country’s history. These are not marginal gains. They are signals of structural potential.

The question this analysis addresses is whether Pakistan possesses the institutional architecture, policy coherence, and political will to convert those signals into doctrine — or whether it will allow a historic opportunity to dissolve into the familiar entropy of short-termism, infrastructure neglect, and regulatory dysfunction.

Pakistan’s Emerging Digital Base: A Foundation That Defies the Headlines

The pessimistic narrative about Pakistan — fiscal crisis, security fragility, political instability — dominates international discourse and obscures a digital demographic reality that is, by most comparative metrics, extraordinary. Pakistan now has 116 million internet users, with penetration reaching 45.7% in early 2025 and accelerating. The PBS Household Survey 2024–25 found that over 70% of households have at least one member online, with individual usage approaching 57% of the adult population. Against the baseline of five years ago, this represents a compression of the connectivity timeline that took wealthier economies a generation to traverse.

Mobile is the primary vector. Pakistan’s 190 million mobile connections and 142 million broadband subscribers — figures corroborated by GSMA’s State of Mobile Internet Connectivity — reflect a population that has leapfrogged fixed-line infrastructure entirely and gone straight to smartphone-mediated internet access. Smartphone ownership has surged with the proliferation of affordable Chinese handsets, democratising access in a way that no government programme could have engineered.

The identity infrastructure is strengthening in parallel. NADRA’s digital ID system now covers the vast majority of the adult population, providing the authentication backbone without which digital financial services, e-commerce, and government-to-citizen digital delivery cannot scale. The State Bank of Pakistan’s (SBP) digital payments architecture — including the Raast instant payment system — has facilitated a measurable shift in transaction behaviour, particularly among younger urban cohorts.

What Pakistan has, in other words, is a digital base: not yet a digital economy, but the preconditions for one. The distinction is critical. A digital base is necessary but not sufficient. Converting it into export-generating, job-creating, productivity-enhancing economic activity requires deliberate policy architecture — something Pakistan has so far delivered only in fragments.

Geography Is Being Rewritten: The Location Dividend

For most of economic history, geography was fate. A landlocked country, a country far from major shipping lanes, a country without navigable rivers or natural harbours faced structural disadvantages that compounded over centuries. Pakistan’s geographic position — bordering Afghanistan, Iran, India, and China, with access to the Arabian Sea — has historically been as much a source of strategic anxiety as economic opportunity.

The digital economy rewrites this calculus. In knowledge-intensive digital services, physical location is increasingly irrelevant to market access. A software engineer in Lahore can serve a fintech client in Frankfurt. A data scientist in Karachi can work for a healthcare analytics firm in Houston. A UX designer in Peshawar can deliver to a product team in Singapore. The barriers that historically constrained Pakistani talent to domestic labour markets — or forced emigration — are structurally dissolving.

This is the location dividend: the ability to monetise Pakistani human capital in global markets without the friction costs of physical migration. It is a form of comparative advantage that requires no natural resources, no preferential trade agreements, and no proximity to wealthy consumer markets. It requires only talent, connectivity, and institutional conditions that allow value to flow across borders.

Pakistan’s digital economy growth model, at its most ambitious, is predicated on precisely this arbitrage: world-class technical skill delivered at emerging-market cost, routed through digital platforms, and paid in foreign exchange. The macroeconomic implications — for the current account, for foreign reserves, for wage convergence — are profound. The World Bank’s Digital Pakistan: Economic Policy for Export Competitiveness report identifies this services export channel as among the most scalable dimensions of the country’s growth potential.

The geography dividend is real. The question is whether Pakistan can build the institutional infrastructure to fully claim it.

The Freelancer Paradox: Scale Without Structure

Perhaps nowhere is the tension between Pakistan’s digital potential and its institutional constraints more vividly illustrated than in its freelance economy. The headline numbers are startling. Pakistan’s 2.37 million freelancers — an estimate from the Asian Development Bank (ADB) — generate a scale of digital services exports that places the country consistently in the top three to four globally on platforms including Upwork, Fiverr, and Toptal. Freelance earnings in H1 FY2025–26 reached $557 million, a 58% year-on-year increase from $352 million — a growth rate that no traditional export sector can approach.

This is the “freelancer paradox Pakistan” faces: enormous revealed comparative advantage, operating almost entirely outside formal policy architecture. The vast majority of Pakistan’s freelancers work without contracts, without access to institutional credit, without social protection, and without the kind of professional certification or dispute resolution frameworks that would allow them to move up the value chain from commodity task completion to complex, high-margin engagements.

The income ceiling is real and consequential. A Pakistani freelancer completing logo designs or basic data entry tasks on Fiverr earns at the low end of the global digital labour market. The same talent, operating through a structured agency model, with portfolio development support, client management training, and access to premium platforms, could command rates three to five times higher. The gap between what Pakistan’s freelance workforce earns and what it could earn is, effectively, a measure of what institutional neglect costs.

The foreign exchange dimension compounds the problem. Payments routed through platforms like PayPal — where availability for Pakistani users remains restricted — or through informal hawala networks, often bypass the formal banking system entirely. The SBP has made progress in facilitating formal remittance channels, but significant friction remains. Pakistan freelance exports are growing despite the system, not because of it.

A comprehensive Pakistan digital economy doctrine must address the freelancer economy not as an afterthought but as a strategic asset requiring dedicated institutional support: access to formal banking, skills certification, contract facilitation, and platform-level advocacy.

Infrastructure Reliability as Export Competitiveness: The Invisible Tax

Ask any Pakistani software engineer working on an international client project what their single biggest operational constraint is, and the answer is rarely regulatory. It is the power cut that interrupted a client call. It is the bandwidth throttling that corrupted a code repository push. It is the VPN restriction that prevented access to a cloud development environment. These are not edge cases. They are the daily texture of doing business in Pakistan’s digital economy.

Infrastructure reliability is not a background variable. In digital services exports, it is export competitiveness. A Pakistani IT firm competing against Indian, Ukrainian, or Filipino counterparts is not merely selling talent — it is selling reliable, on-time, high-quality delivery. A single missed deadline caused by a grid outage can cost a client relationship worth hundreds of thousands of dollars. Cumulatively, infrastructure unreliability functions as an invisible tax on Pakistan’s digital exports Pakistan is uniquely ill-positioned to afford.

The electricity crisis is the most acute dimension of this problem. Pakistan’s circular debt overhang — exceeding Rs. 2.4 trillion — continues to produce load-shedding that falls hardest on small businesses and home-based workers, who constitute the backbone of the freelance and micro-enterprise digital economy. Large IT firms in tech parks have access to backup generation; individual freelancers in Multan or Faisalabad do not.

Broadband quality is the second constraint. Pakistan’s average fixed broadband speed, while improving, remains well below regional competitors. Mobile data costs have declined, but network congestion in urban cores during peak hours frequently degrades the quality of experience to levels incompatible with professional digital work. The GSMA has consistently highlighted last-mile connectivity gaps as the primary barrier to realising Pakistan’s mobile internet dividend.

A credible Pakistan digital economy doctrine must treat infrastructure investment — in power stability, fibre optic expansion, and spectrum management — not as a public works programme but as export infrastructure, directly analogous to port expansion for goods trade.

Cyber Risks and the Trust Deficit: The Hidden Vulnerability

Digital economies are only as robust as the trust that underpins them. Trust operates at multiple levels: consumer trust in digital financial services, business trust in cloud infrastructure, investor trust in data governance frameworks, and international partner trust in Pakistan’s regulatory environment. On all of these dimensions, Pakistan faces a significant trust deficit that constrains the Pakistan digital economy growth trajectory.

Cybersecurity incidents affecting Pakistani financial institutions have multiplied. The banking sector has faced card data breaches, phishing campaigns targeting mobile banking users, and SIM-swap fraud at scale. The Pakistan Telecommunication Authority’s (PTA) record of internet shutdowns and platform restrictions — including prolonged access restrictions to major social media platforms during periods of political tension — has created a perception among international digital businesses that Pakistan’s internet governance is unpredictable.

This unpredictability carries a direct economic cost. International clients contracting Pakistani firms for sensitive data processing work — healthcare records, financial data, personal information — conduct due diligence on the regulatory and security environment. A country with a history of arbitrary platform restrictions and limited data protection enforcement does not inspire confidence for high-value data contracts.

Pakistan’s Personal Data Protection Bill, in legislative limbo for several years, represents the most visible symptom of this institutional gap. Without a credible, enforced data protection framework, Pakistan cannot credibly bid for the categories of digital services work — cloud processing, AI training data, health informatics — where the highest margins and fastest growth lie. Closing this gap is not merely a legal formality; it is a prerequisite for moving up the digital value chain.

Institutional Constraints and Policy Incoherence: The Structural Brake

Pakistan’s digital economy governance is fragmented across a proliferation of bodies — the Ministry of IT and Telecom (MoITT), PSEB, PTA, the National Information Technology Board (NITB), provincial ICT authorities, and the Special Investment Facilitation Council (SIFC) — with overlapping mandates, inconsistent coordination, and chronic under-resourcing. This fragmentation is not accidental; it reflects the accumulation of institutional layering that characterises Pakistan’s economic governance more broadly.

The policy incoherence is manifested in contradictions that would be almost comic if they were not so economically costly. Pakistan simultaneously promotes itself as a top destination for IT outsourcing while maintaining VPN restrictions that its own IT workers require to access client systems. It celebrates freelance export earnings while allowing the forex payment infrastructure for those earnings to remain dysfunctional. It announces ambitious digital skills programmes while underfunding the higher education institutions that produce the graduates those programmes are supposed to train.

The Pakistan IT exports 2026 growth trajectory — impressive as it is — is occurring largely in spite of, rather than because of, this governance architecture. The question for policymakers is not whether the current momentum can continue; it can, for a time, on the basis of demographic dividend and individual entrepreneurial energy alone. The question is whether that momentum can be compounded into the kind of structural transformation that moves Pakistan from an exporter of digital labour to an exporter of digital products and platforms.

That transition requires a qualitatively different institutional environment: one capable of regulating without strangling, facilitating without distorting, and investing at the horizon of a decade rather than the cycle of a fiscal year.

Digital Sovereignty and Platform Dependency: The Strategic Dimension

Beneath the growth narrative lies a geopolitical and strategic question that Pakistan’s digital economy debate has been slow to engage: the question of digital sovereignty Pakistan must navigate. As Pakistani businesses and individual workers increasingly integrate into global digital platform ecosystems — Upwork, Fiverr, AWS, Google Cloud, Microsoft Azure — they gain access to markets, infrastructure, and tools that would be impossible to replicate domestically. They also incur structural dependencies that carry long-term risks.

Platform dependency is not a uniquely Pakistani problem. Every country that has embraced the global digital economy faces some version of this tension. But for Pakistan, the risks are heightened by the country’s limited regulatory leverage, its absence from the standard-setting bodies that govern international digital trade, and the concentration of critical digital infrastructure in the hands of a small number of US-headquartered technology corporations.

The practical implications are significant. When a major freelance platform adjusts its fee structure or payment policies, Pakistani freelancers — who have no collective bargaining mechanism, no government-backed alternative platform, and no domestic digital marketplace of comparable scale — absorb the consequences. When a cloud provider raises prices or discontinues a service, Pakistani startups that have built their infrastructure on that provider face switching costs that can be existential.

Digital sovereignty does not mean autarky. It means building sufficient domestic digital capacity — in cloud infrastructure, in payment systems, in data storage, in platform development — to maintain meaningful optionality. It means participating in the governance of the global digital economy rather than passively receiving its terms. It means developing the regulatory expertise to negotiate with platform giants on terms that protect Pakistani economic interests.

This is a long-game strategic agenda, not a short-cycle policy fix. But without it, Pakistan’s Pakistan digital economy growth risks being permanently extractive — generating value that is captured elsewhere.

Government as Digital Market Creator: The Enabling State

One of the most durable insights from the comparative study of digital economy development — South Korea, Estonia, Singapore, Rwanda — is that the private sector alone does not build digital economies. Governments create the conditions: the infrastructure, the standards, the skills pipeline, the procurement signals, and the regulatory certainty without which private investment cannot take root at scale.

Pakistan’s government has the opportunity — and, given the fiscal constraints, the obligation — to be a strategic market creator rather than a passive regulator. Government digitalisation is not merely an efficiency play; it is a demand-side signal to the domestic digital industry. When the government digitises land records, health systems, tax administration, and public procurement, it creates contract opportunities for Pakistani IT firms, validates the commercial viability of digital solutions, and builds the reference clients that domestic companies need to compete internationally.

The PSEB’s facilitation role — connecting international clients with Pakistani IT firms, providing export certification, and advocating for payment infrastructure improvements — represents the embryo of a more active industrial policy. The SIFC’s mandate, if properly operationalised for the digital sector, could provide the high-level coordination that has been missing. But these institutions need resources, autonomy, and political backing to function at the scale the opportunity demands.

The most immediate lever available is public digital procurement: a committed pipeline of government IT contracts awarded to domestic firms under transparent, merit-based processes. This single policy — properly designed and consistently executed — could do more to develop Pakistan’s digital industry than any number of incubator programmes or innovation fund announcements.

From Factor-Driven to Knowledge-Driven Economy Pakistan: The Structural Leap

Pakistan’s economic growth model has, for most of its history, been factor-driven: growth generated by deploying more labour, more land, more capital, in sectors with relatively low productivity — agriculture, low-complexity manufacturing, commodity exports. The digital economy represents the most credible pathway to a fundamentally different model: one in which growth is driven by increasing productivity, accumulating human capital, and generating returns from knowledge rather than from raw inputs.

The knowledge-driven economy Pakistan needs is not a distant aspiration. The ingredients exist, in nascent form: a young population with demonstrated aptitude for digital skills, universities producing engineers and computer scientists at scale, a diaspora with global networks and capital, and a domestic entrepreneurial ecosystem generating startups in fintech, healthtech, agritech, and edtech that are beginning to attract international venture investment.

The transition from factor-driven to knowledge-driven growth is not automatic or inevitable. It requires deliberate investment in research and development, in higher education quality, in intellectual property protection, and in the kind of long-term institutional stability that allows firms to make multi-year investment commitments. Pakistan’s R&D expenditure as a share of GDP remains among the lowest in Asia — a structural constraint that no amount of IT export promotion can overcome if sustained.

The ADB’s research on Pakistan freelancers earnings and digital service exports consistently emphasises that the earnings ceiling for task-based freelance work is far lower than for product-based or IP-based digital exports. Moving Pakistani digital workers up this value curve — from executing tasks to building products, from selling hours to licensing software — is the central challenge of knowledge economy transition.

Policy Priorities for a Digital Doctrine: What Must Be Done

A credible Pakistan digital economy doctrine for the period to 2030 requires six interlocking policy commitments, each necessary but none sufficient in isolation.

First, infrastructure as export policy. Pakistan must treat reliable electricity supply and high-quality broadband as preconditions for digital export competitiveness, not as welfare goods. This means prioritising digital economic zones with guaranteed power supply, accelerating fibre optic backbone expansion into secondary cities, and reducing spectrum costs for business-grade mobile broadband.

Second, the forex plumbing must be fixed. The SBP must complete the liberalisation of digital payment channels, enabling Pakistani freelancers and digital firms to receive, hold, and deploy foreign currency earnings without the friction that currently drives significant volumes into informal channels. Every dollar that flows through informal networks is a dollar that does not build Pakistan’s foreign reserves or generate formal tax revenue.

Third, data protection legislation must be enacted and enforced. The Personal Data Protection Bill must be passed in a form that meets international standards — not as a regulatory box-ticking exercise, but as a genuine market access instrument. Pakistan cannot compete for high-value data services contracts without credible data governance.

Fourth, skills investment must match ambition. Pakistan’s Pakistan IT exports 2026 targets require a quantum expansion of the technical skills pipeline — not through low-quality short courses, but through sustained investment in computer science education at the tertiary level, curriculum modernisation, and industry-academia partnerships that ensure graduates enter the workforce with market-relevant capabilities.

Fifth, institutional consolidation. The fragmented governance architecture for the digital economy must be rationalised. A single, adequately resourced Digital Economy Authority — with a clear mandate, cross-ministerial coordination powers, and direct accountability to the Prime Minister — would reduce the transaction costs of doing business in Pakistan’s digital sector by orders of magnitude.

Sixth, a digital sovereignty strategy. Pakistan needs a national cloud strategy, a digital platform policy, and active participation in international digital trade negotiations. These are not luxury items for a mature digital economy; they are foundational choices that, once deferred, become progressively more expensive to make.

Conclusion: A Decisive Economic Choice

Pakistan’s Pakistan digital economy moment is real, and it is now. The combination of demographic scale, demonstrated digital talent, accelerating connectivity, and record IT and freelance export earnings constitutes a rare convergence of factors that, in other economies, has served as the launching pad for durable structural transformation.

But potential is not destiny. History is littered with countries that glimpsed the digital transformation horizon and then allowed institutional inertia, political short-termism, and infrastructure neglect to ensure they never reached it.

The debate Pakistan is currently having about its digital economy is, at its deepest level, a debate about what kind of economic future the country chooses to construct. The old paradigm — commodity exports, remittances, periodic IMF bailouts, growth that barely keeps pace with population — has delivered recurrent crisis and chronic underinvestment in human capital. The digital paradigm offers something genuinely different: a pathway to prosperity grounded in the one resource Pakistan has in abundance, its people, and their capacity for knowledge work in a globally connected economy.

Digital sovereignty Pakistan must claim is not merely about technology. It is about economic agency — the ability to participate in the global economy on terms that capture value domestically rather than exporting it. Every reform deferred, every institutional bottleneck left unaddressed, every dollar that flows through informal channels rather than the formal banking system, is a cost Pakistan cannot afford.

The choice between a Pakistan whose digital economy remains a promising footnote and one whose Pakistan digital economy growth becomes the defining story of the coming decade is not a technical question. It is a political one. And it must be answered decisively — before the window that demographics, technology, and global market demand have opened begins, once again, to close.


Discover more from The Economy

Subscribe to get the latest posts sent to your email.

Continue Reading

Analysis

KOSPI Record Crash: South Korea’s Stock Market Suffers Its Worst Day in History as the US-Iran War Detonates a Global Sell-Off

Published

on

At 9:03 a.m. Korean Standard Time, the screens inside the Korea Exchange trading hall in Yeouido, Seoul, turned a uniform, searing red. Within minutes, the sell orders were not arriving in waves — they were arriving like a flood breaking through a dam. Algorithms fired. Margin calls cascaded. Retail investors, who only weeks ago were borrowing money to buy Samsung Electronics at record highs, watched years of gains dissolve in real time. By 9:17 a.m., trading had been suspended for twenty minutes: the circuit breaker, a mechanism designed for exactly this kind of controlled catastrophe, had triggered for just the seventh time in the KOSPI’s 43-year history.

By the closing bell, South Korea’s benchmark index had shed 12.06 percent — 698.37 points — to close at 5,093.54. It was the worst single day in the KOSPI’s recorded history, surpassing even the paralysing shock of September 11, 2001. The world’s hottest major stock market, up more than 40 percent in just two months, had just been broken — not by a domestic crisis, not by a company scandal, but by missiles fired 6,000 kilometres away in the Persian Gulf.

What Happened: A Minute-by-Minute Collapse

The trigger was a week in the making. On the morning of February 28, 2026, US and Israeli forces launched a coordinated series of airstrikes against Iran, an operation that reportedly included the assassination of Supreme Leader Ali Khamenei. Iran’s response was swift and economically calculated: the Islamic Revolutionary Guard Corps announced a closure of the Strait of Hormuz, the narrow chokepoint through which roughly 20 million barrels of crude oil transit daily — accounting for approximately 20 percent of global supply.

South Korean markets were closed on Monday, March 2, for Independence Movement Day. When trading reopened Tuesday morning, the pent-up global selling pressure — two full days of deteriorating sentiment compressed into a single session — hit simultaneously. The KOSPI fell 7.24 percent on Tuesday, closing at 5,791.91, its largest single-session point drop on record at that time.

Wednesday brought something far worse.

The timeline:

  • 09:00 KST — KOSPI opens at 5,592.29, already down sharply from Tuesday’s close.
  • 09:08 KST — Circuit breaker triggered on the KOSDAQ after losses exceed 8 percent; trading suspended 20 minutes.
  • 09:14 KST — KRX activates sidecar mechanism on the KOSPI as sell orders overwhelm buy-side liquidity.
  • 09:17 KST — KOSPI circuit breaker fires. At the time of the halt, the index is down 469.75 points — 8.11 percent — to 5,322.16.
  • 09:37 KST — Trading resumes. Selling immediately intensifies.
  • 11:20 KST — KOSPI reaches intraday low of 5,059.45, down 12.65 percent — the worst intraday reading in 25 years and 11 months.
  • 15:30 KST — Official close: 5,093.54, down 12.06 percent. Of the more than 800 stocks on the benchmark, just 10 finish in the green.

The KOSDAQ, South Korea’s technology-heavy secondary index, fared even worse, closing down 14 percent at 978.44 — its largest single-day decline since its founding in January 1997. The combined two-day equity wipeout erased an estimated $430 billion in market value.

Why South Korea Was Hit Hardest: The Anatomy of a Perfect Storm

Every major economy felt the tremor of the Iran conflict on March 4. But none — not Japan, not Taiwan, not China — fell anything close to what Seoul experienced. The gap is not coincidental. It is structural.

Energy dependence, extreme and existential. South Korea imports approximately 98 percent of its fossil fuels, with around 70 percent of its crude oil sourced from the Middle East, much of it transiting the Strait of Hormuz. According to the US Energy Information Administration, South Korea ranks among the top importers of Hormuz-transit crude globally. When Iran threatened to close — and partially did close — that chokepoint, the calculus for Korean manufacturers and energy utilities changed instantly. Higher oil does not merely raise input costs; it compresses margins across the entire export-driven economy, stokes inflation, and pressures the current account. Nomura estimates that South Korea’s net oil imports represent 2.7 percent of GDP — among the highest of any major economy and a stark vulnerability flag in any energy shock scenario.

Semiconductor concentration, a double-edged sword. The KOSPI’s extraordinary 2026 rally — up more than 40 percent in the first two months of the year, touching an all-time high above 6,347 in late February — was almost entirely the story of two companies: Samsung Electronics and SK Hynix. Together, the two memory chip giants account for close to 50 percent of the index by market capitalisation, according to Morningstar equity research. When sentiment turned, that concentration did not merely reflect the market’s decline — it amplified it. Samsung Electronics fell 11.74 percent to 172,200 won. SK Hynix dropped 9.58 percent to 849,000 won. Hyundai Motor collapsed 15.80 percent. Kia Corp shed 13.82 percent. Shipping stocks Pan Ocean, HMM, and KSS Line — directly exposed to Hormuz route disruption — plunged between 16 and 19 percent.

As Lorraine Tan, Asia director of equity research at Morningstar, noted, “The decline in the KOSPI can broadly be attributable to the single-name concentration that we see in Korean markets.” She added that the drop also implied growing concern that AI data-centre adoption could slow due to significantly higher energy costs — a double hit for chips stocks caught between geopolitical risk and demand uncertainty.

Margin debt: the accelerant. Before the conflict erupted, South Korean retail investors had borrowed heavily to ride the bull market. Margin debt and broker deposits had surged to record highs. When prices began to fall, those leveraged positions triggered forced liquidations, turning an orderly retreat into a rout. “There’s been a lot of buying on credit, especially in the heavyweight stocks,” Kim Dojoon, chief executive of Zian Investment Management, told Bloomberg. “If there’s another drop on Thursday, nobody will catch a falling knife.”

The holiday amplifier. Monday’s market closure meant that South Korean markets absorbed two full days of global deterioration in a single session on Tuesday — and then suffered a second cascading wave on Wednesday, with no circuit of relief between them.

Historical Benchmark: Into Uncharted Territory

To understand the magnitude of what happened in Seoul on March 4, 2026, consider the events it eclipses.

The KOSPI has recorded a decline of 10 percent or more in a single session on only four occasions in its 43-year history. According to the Korea Herald and historical KRX data, those occasions are:

DateEventKOSPI Decline
April 17, 2000Dot-com bubble peak-11.63%
September 12, 2001Post-9/11 shock-12.02%
October 24, 2008Global Financial Crisis-10.57%
March 4, 2026US-Iran War-12.06%

The September 12, 2001 session had stood for nearly 25 years as the single worst day in South Korean market history — a day when global commerce froze and the world reoriented around fear. Wednesday’s close eclipsed it by a margin of 0.04 percentage points. The intraday low — 12.65 percent — was the deepest since April 17, 2000.

The KOSDAQ’s 14 percent plunge, meanwhile, surpassed its previous worst session: the 11.71 percent rout of March 19, 2020, at the nadir of the COVID-19 pandemic panic. What happened this week in Seoul did not merely set a record. It rewrote the category entirely.

What makes the comparison to 2001 particularly sobering is context. On September 12, 2001, markets around the world fell together. In 2026, Wall Street is barely flinching: the S&P 500 fell approximately 1 percent overnight. The KOSPI’s collapse is not a global synchronised shock — it is something more targeted, and in some ways more alarming: a geopolitical vulnerability unique to South Korea’s economic structure being stress-tested in real time.

Global Contagion: Oil, Currencies, and the Hormuz Premium

Seoul was the epicentre, but the aftershocks radiated across the region and beyond.

Oil. Brent crude surged 10–13 percent in the days following the initial strikes, trading around $80–82 per barrel by March 2–4, according to energy analysts cited by Reuters. Analysts warned that if the Hormuz disruption proves sustained, prices could breach $100 per barrel — a level that would add an estimated 0.8 percentage points to global inflation, according to projections cited in the economic impact assessment published by Wikipedia. Natural gas prices in Europe surged 38 percent following reported attacks on Qatari LNG export facilities.

The Korean won. The currency markets told the same story in different decimal places. The won briefly pierced 1,500 per dollar on Wednesday — a level not seen since March 10, 2009, at the nadir of the global financial crisis. It was, psychologically, an enormous threshold. Yan Wang, chief of emerging markets at Alpine Macro, told the Korea Herald that the Korean won is historically “one of the most sensitive emerging market currencies to global risk sentiment,” while cautioning that fundamentals do not justify such weakness unless the conflict drags on significantly.

Asian markets. The contagion spread, though nowhere matched Seoul’s severity:

  • Japan Nikkei 225: -3.61% to 54,245.54
  • Taiwan TAIEX: -4.40% to 32,829
  • Hong Kong Hang Seng: -2.00% to 25,249.48
  • Shanghai Composite: -1.00% to 4,082.47

The asymmetry is instructive. China, a major oil importer, absorbed the shock with relative composure — partly due to its diversified energy sourcing and partially because domestic policy responses appeared pre-positioned. Japan and Taiwan, similarly dependent on Middle East energy, fell meaningfully but remained far above Korean levels, their indices lacking the same speculative leverage overhang.

Travel and supply chains. Iran’s airspace was closed to civilian aircraft following the initial strikes on February 28. Multiple carriers suspended Middle East routes, with knock-on effects for travel and tourism across the Gulf. Shipping insurance costs for Hormuz-transit tankers surged, with analysts suggesting the “war premium” could add $5–15 per barrel to delivered oil costs regardless of military escort arrangements — a persistent, structural cost increase for energy importers like South Korea.

Three Scenarios: What Comes Next

The trajectory of South Korea’s markets now depends almost entirely on one variable: how long the conflict lasts, and whether the Strait of Hormuz reopens to normal commercial traffic.

Scenario 1 — Rapid Resolution (probability: 30%) The US achieves its stated military objectives within four to five weeks, as President Trump publicly signalled. Iranian counter-retaliation is contained. Oil retreats to sub-$80. In this scenario, the structural case for Korean equities reasserts itself quickly — AI memory demand remains intact, Samsung and SK Hynix resume margin expansion, and the KOSPI, still up approximately 21 percent year-to-date even after the crash, stages a sharp technical rebound. Forced liquidations reverse. Analysts at Seoul-based brokerages place a 10 percent rebound in the first week post-ceasefire as the base case for this outcome.

Scenario 2 — Prolonged Stalemate (probability: 50%) The conflict extends beyond one month. The Strait of Hormuz remains partially disrupted. Oil stabilises in the $85–95 range. South Korea’s current account balance deteriorates. The Bank of Korea is forced to weigh currency intervention against inflation pressures — a familiar but painful dilemma for an open economy. The KOSPI finds a floor in the 4,800–5,000 range as earnings revisions bite. Recovery is slow, uneven, and dependent on semiconductor demand holding firm even as energy costs rise. Foreign investors remain cautious.

Scenario 3 — Full Energy Shock (probability: 20%) The conflict escalates into a sustained regional war. Hormuz closes effectively for multiple months. Crude reaches $100 or beyond. In this scenario, Hyundai Research Institute’s earlier estimate — that sustained $100 crude could shave 0.3 percentage points from South Korea’s 2026 GDP growth — becomes conservative. The KOSPI potentially tests 4,000. The Bank of Korea is forced into emergency rate decisions. The IMF revises Asian growth projections downward across the board. Global stagflation risks — higher energy prices coinciding with slower growth — re-enter the policy conversation for the first time since 2022.

Investor Playbook and Policy Response

What regulators and institutions are doing. The Bank of Korea issued a statement vowing to “respond to herd-like behaviour” in financial markets and pledged liquidity support measures if volatility persisted. The Korea Exchange activated circuit breakers and sidecar mechanisms as designed, but market participants noted that the tools slowed rather than stopped the cascade. Foreign investors, after dumping more than 12 trillion won in equities over the two-session period, ended Wednesday as modest net buyers — 231.2 billion won in net purchases — a tentative signal that some institutional money saw the dislocation as an entry point.

BofA’s take. “The sharp decline reflects the outsized leverage in long positions heading into February 28, 2026, when market sentiment was highly bullish on Korean tech due to the aggressive shortage of memory chips used in AI server production,” BofA strategist Chun Him Cheung told Investing.com. The implication: this was not a fundamental repricing of Korea’s economic future — it was a positioning purge, painful but potentially creating opportunity.

Where rational capital might look. For investors with a six-to-twelve-month horizon, the crash has produced a rare dislocation between price and fundamental value in high-quality names. Samsung Electronics and SK Hynix — despite their catastrophic session — retain structural leadership positions in AI-grade memory chips, a market with no near-term substitute suppliers. Analysts at IM Securities and Renaissance Asset Management both noted that if the conflict resolves within one month, a rebound toward 5,500–5,800 on the KOSPI is plausible. Defensive plays in South Korean energy utilities, domestic-demand retailers, and defence contractors — which have benefited from the same geopolitical tension that crushed the broader market — offer asymmetric positioning.

For retail investors caught in forced liquidations, the message is sobering but familiar: leverage borrowed at the peak of euphoria is the most reliable way to transform a geopolitical shock into a personal financial crisis.

Conclusion: The Price of Being the World’s Hottest Market

There is a painful irony at the heart of what happened to South Korea’s stock market this week. The KOSPI was, by virtually every measure, the world’s best-performing major equity index in early 2026. It rose on the back of genuine structural tailwinds — AI memory demand, corporate governance reforms, a re-rating of Korea’s innovation economy by global fund managers. The 40-percent rally in two months was not pure speculation; it was grounded in earnings.

But markets running that fast accumulate fragility. Leverage builds. Concentration intensifies. The margin for error narrows. When an external shock arrives — not a Korean shock, not a chip-sector shock, but a missile fired in the Persian Gulf — there is no buffer. The circuit breakers fired at 9:17 a.m. and could not stop what came afterward.

The KOSPI’s record-breaking crash is not, in isolation, a verdict on South Korea’s economic future. The structural case for its semiconductor giants remains intact. The reforms that re-rated the market over the past year have not been reversed. What has changed is the risk premium: an economy that earns its export surplus in silicon must pay for its energy in oil, and oil now carries a war premium that markets cannot price with confidence.

The Strait of Hormuz is 39 kilometres wide at its narrowest point. For South Korea, that passage has never felt smaller.

FAQs (FREQUENTLY ASKED QUESTIONS)

Q1: Why did South Korea’s stock market fall more than any other country’s during the US-Iran war? South Korea’s extreme vulnerability stems from three intersecting factors: it imports approximately 98 percent of its fossil fuels, with around 70 percent sourced from the Middle East via the Strait of Hormuz; its benchmark KOSPI index is heavily concentrated in semiconductor stocks (Samsung and SK Hynix account for close to half the index’s market cap) that had rallied more than 40 percent in early 2026 on margin debt; and a public holiday on Monday March 2 compressed two days of global selling into a single catastrophic Tuesday session.

Q2: How does the March 4, 2026 KOSPI crash compare to the September 11, 2001 drop? The KOSPI fell 12.06 percent on March 4, 2026, narrowly eclipsing the 12.02 percent decline recorded on September 12, 2001, the day after the 9/11 attacks. The intraday low of 12.65 percent was the deepest since April 17, 2000. It is now the worst single-day session in the KOSPI’s 43-year recorded history, surpassing four prior instances of 10-percent-plus declines including those during the dot-com bubble, 9/11, and the 2008 global financial crisis.

Q3: What happened to the Korean won during the KOSPI crash? The Korean won fell sharply during the two-day rout, briefly breaching 1,500 per dollar on Wednesday March 4 — a level not seen since March 2009 at the depth of the global financial crisis — before closing around 1,466 per dollar. The Bank of Korea vowed to respond to “herd-like behaviour” in currency markets and signalled readiness for intervention if volatility persisted.

Q4: Will South Korea’s stock market recover from the US-Iran war selloff? The outlook depends heavily on the duration of the conflict and whether the Strait of Hormuz reopens to normal commercial shipping. Most Seoul-based analysts see two primary scenarios: a quick resolution (within four to five weeks) that triggers a sharp technical rebound toward 5,500–5,800 on the KOSPI, or a prolonged stalemate that sees the index finding a floor near 4,800–5,000 as earnings are revised downward. The structural bull case — driven by AI memory chip demand and corporate governance improvements — has not been invalidated, but the energy-price risk premium has risen substantially.


Discover more from The Economy

Subscribe to get the latest posts sent to your email.

Continue Reading

Analysis

Top 10 Countries with the World’s Strongest Currencies in 2026 — Ranked & Analysed

Published

on

Discover the world’s strongest currencies in 2026 — ranked by exchange value, economic backing & purchasing power. From Kuwait’s $3.27 dinar to the Swiss franc’s unmatched stability, the definitive guide.

Where Money Is Worth More Than You Think

There is a question that unsettles most travellers the moment they land at an unfamiliar airport and squint at a currency board: how much, exactly, is this money worth? The instinct is to reach for the US dollar as a yardstick — to ask, almost reflexively, whether the local note in your hand represents more or less than a single greenback. That reflex is understandable. The dollar remains, by a vast margin, the most traded and most held reserve currency on the planet. But it is not the strongest.

That distinction belongs to a small Gulf emirate whose population would fit comfortably inside greater Manchester, and whose currency has quietly dominated every global ranking for more than two decades. It is joined on the podium by neighbours whose names rarely make mainstream financial headlines, and by a landlocked Alpine republic whose monetary tradition has become almost mythological in global finance circles.

Currency strength is, of course, a deceptively complicated concept. A high nominal exchange rate — the number of US dollars one unit of a foreign currency can buy — is the most intuitive measure, but it captures only part of the picture. Purchasing power parity (PPP), the stability of the issuing central bank, inflation history, current-account balances, and forex reserve depth all feed into a fuller assessment of monetary credibility. The rankings below attempt to honour that complexity: they are ordered primarily by nominal value against the USD as of early March 2026, but enriched with structural and macroeconomic context at every step.

For travellers, the implications are vivid and practical: a strong home currency means your holiday budget stretches further in weaker-currency markets. For investors, it signals where monetary policy is disciplined, inflation is tamed, and capital preservation is most plausible. For economists, it is a mirror of a nation’s fiscal choices — and occasionally its geological luck.

Here, then, is the definitive ranking of the world’s strongest currencies in 2026.

Methodology: How We Ranked the World’s Strongest Currencies

Ranking currencies by strength is not a single-variable exercise. Our methodology combines four weighted criteria:

1. Nominal exchange rate vs. USD (primary weight: 50%) — the most cited metric globally; how many US dollars one unit of the currency buys as of early March 2026.

2. Purchasing Power Parity (PPP) and domestic price stability (25%) — drawing on the IMF World Economic Outlook database and World Bank ICP data to assess what each currency actually buys at home.

3. Central bank credibility, forex reserves, and current-account balance (15%) — using BIS data, central bank publications, and IMF Article IV consultations.

4. Long-term inflation track record and monetary regime stability (10%) — a currency pegged rigidly to the dollar for decades earns credit for predictability; a currency that preserved purchasing power across multiple global crises earns even more.

Geographic territories whose currencies are pegged 1:1 to a sovereign currency (Gibraltar Pound, Falkland Islands Pound) are noted but not separately ranked; they effectively mirror their parent currency’s fundamentals.

The World’s Strongest Currencies in 2026: Comparative Table

RankCountry / TerritoryCurrencyCodeValue vs. USD (Mar 2026)1-Year ChangeExchange Regime
1KuwaitKuwaiti DinarKWD≈ $3.27Stable (±0.5%)Managed basket peg
2BahrainBahraini DinarBHD≈ $2.66Stable (fixed)Hard USD peg
3OmanOmani RialOMR≈ $2.60Stable (fixed)Hard USD peg
4JordanJordanian DinarJOD≈ $1.41Stable (fixed)Hard USD peg
5United KingdomPound SterlingGBP≈ $1.26−1.8%Free float
6Cayman IslandsCayman DollarKYD≈ $1.20Stable (fixed)Hard USD peg
7SwitzerlandSwiss FrancCHF≈ $1.13+2.1%Managed float
8European UnionEuroEUR≈ $1.05−1.2%Free float
9SingaporeSingapore DollarSGD≈ $0.75+1.4%NEER-managed
10United StatesUS DollarUSD$1.00BenchmarkFree float

Exchange rates are indicative mid-market values, early March 2026. Sources: Central Bank of Kuwait, Central Bank of Bahrain, Central Bank of Oman, Bloomberg, Reuters.

#10 — United States: The Dollar That Rules the World (Even When It Isn’t the Strongest)

USD/USD: 1.00 | Reserve share: ~56% of global FX reserves (IMF COFER, mid-2025)

It would be intellectually dishonest to construct any list of monetarily significant currencies without beginning — or in this case, ending — with the US dollar. Technically ranked tenth by nominal exchange rate, the dollar’s omission from any strong-currency discussion would be absurd. It is the global reserve currency, the denomination of roughly 90% of all international foreign-exchange transactions, and the standard against which every other currency on this list is measured.

The dollar’s structural power derives not from its face value but from the depth and liquidity of US capital markets, the legal enforceability of US-dollar-denominated contracts, and the unrivalled network effects that come from decades of institutional entrenchment. When the world is frightened — by a banking crisis, a pandemic, or a geopolitical rupture — capital flows into dollars, not away from them. That is the ultimate credential.

The Federal Reserve’s aggressive rate-hiking cycle of 2022–2023 temporarily turbocharged the greenback to multi-decade highs. Since then, a gradual easing cycle has modestly softened the dollar index (DXY), which hovered around the mid-100s range in early 2026. Yet its dominance in global trade invoicing and central bank reserves remains essentially unchallenged.

Travel angle: For American travellers abroad, the dollar’s reserve status means widespread acceptance and generally favourable conversion, particularly in emerging markets. The caveat: in the Gulf states above the dollar on this list, the local currencies are pegged to the dollar, so there is no exchange-rate advantage — the mathematics are already baked in.

#9 — Singapore: The Asian Precision Instrument

SGD/USD: ≈ 0.75 | Inflation: ~2.1% (MAS, 2025) | Current account: strong surplus

Singapore manages its currency with the kind of institutional exactitude one might expect from a city-state that has spent sixty years treating good governance as a competitive export. The Monetary Authority of Singapore (MAS) does not set interest rates in the conventional sense; it manages the Singapore dollar’s value against an undisclosed basket of currencies through a “nominal effective exchange rate” (NEER) policy band — a mechanism that gives it enormous flexibility to use currency appreciation as an anti-inflation tool.

The result is a currency that, while not high in nominal USD terms, has consistently outperformed peers in Asia on purchasing-power stability. Singapore’s AAA sovereign credit rating (Standard & Poor’s, Fitch), perennially current-account surplus, and status as Asia’s pre-eminent financial hub all feed into the SGD’s credibility premium. The SGD appreciated modestly against the dollar in 2025 as MAS maintained a slightly appreciating NEER slope — a deliberate policy response to residual imported inflation from elevated global commodity prices.

For investors, the Singapore dollar is one of very few Asian currencies worth holding as a diversification tool in a hard-currency portfolio. For travellers from weaker-currency nations, Singapore’s cost of living will feel punishing — this is, after all, consistently one of the world’s most expensive cities. But that high cost is the precise reflection of the currency’s strength.

#8 — The Euro: Collective Strength, Individual Tensions

EUR/USD: ≈ 1.05 | ECB deposit rate: 2.25% (as of Feb 2026) | Eurozone GDP growth: ~0.9% (IMF 2026 forecast)

The euro is the world’s second most traded currency and the reserve currency of choice after the dollar, held in roughly 20% of global central bank foreign exchange portfolios. It represents the collective monetary credibility of twenty nations — a fact that is simultaneously its greatest source of strength and its most persistent structural vulnerability.

The European Central Bank’s prolonged rate-hiking campaign of 2022–2024 was executed with more determination than many in financial markets expected, and it produced results: eurozone core inflation fell from its 2022 peak of above 5% to below 2% by mid-2025, a trajectory that restored considerable credibility to the ECB’s inflation-targeting framework. The subsequent easing cycle has been cautious; the deposit rate stood at approximately 2.25% in early 2026, a level the ECB’s governing council has characterised as still moderately restrictive.

The euro’s Achilles heel remains the fiscal divergence between its member states. Germany’s near-recessionary growth in 2024–2025, combined with France’s persistent budget deficit challenges and Italy’s elevated debt-to-GDP ratio (above 135%), keeps sovereign risk premia alive in bond markets and periodically unsettles the currency. Still, the Eurozone’s aggregate current-account position is in surplus, and the ECB’s “Transmission Protection Instrument” — its bond-buying backstop — has effectively capped the threat of another existential sovereign debt crisis for now.

Travel angle: For USD- or GBP-holders, the euro’s current rate around $1.05 represents a relatively modest barrier. Western European travel remains expensive not because of the exchange rate but because of local price levels — a function of high wages and robust social provision rather than currency manipulation.

#7 — Switzerland: The Safe-Haven That Earned Its Reputation

CHF/USD: ≈ 1.13 | SNB policy rate: 0.25% | Inflation: ~0.3% (SNB, Feb 2026) | Current account surplus: ~9% of GDP

If the Kuwaiti dinar wins on headline exchange rate, the Swiss franc wins on something arguably more impressive: institutional longevity. Switzerland has managed its monetary affairs with such consistent discipline that the franc has preserved real purchasing power across multiple global crises, two world wars (in which Switzerland remained neutral), the collapse of the Bretton Woods system, the 2008 global financial crisis, and the COVID-19 shock. That record of monetary continuity, spanning more than 175 years since the franc’s introduction in 1850, is essentially without parallel among modern fiat currencies.

The Swiss National Bank (SNB) operates with an independence and a long-termism that remains the envy of its peers. Its mandate — price stability, defined as annual CPI inflation of 0–2% — has been met with remarkable consistency. Swiss inflation in early 2026 stood at approximately 0.3%, one of the lowest in the developed world, and a reflection of the SNB’s willingness in previous years to tolerate the economic pain of a strong franc (which reduces import costs and anchors domestic prices) rather than engineer currency weakness for short-term competitiveness.

Switzerland’s current-account surplus, running at roughly 9% of GDP, reflects a country that consistently exports more value than it imports — in pharmaceuticals, precision machinery, financial services, and, of course, the world’s most trusted watches. That structural external surplus is a bedrock of franc credibility.

The SNB’s policy rate stood at 0.25% in early 2026 — low, because very low inflation means there is no need for restrictive policy. The franc’s strength is not conjured by high interest rates attracting hot capital; it is built on structural surpluses, institutional credibility, and a century and a half of monetary conservatism.

Investor angle: The CHF remains one of the most reliable safe-haven plays in global markets. When geopolitical risk flares — and it has consistently done so across 2024–2026 — capital rotates into the franc. Its appreciation during such episodes is the price of insurance.

#6 — Cayman Islands: Offshore Stronghold, Surprising Currency

KYD/USD: 1.20 (fixed since 1974) | Sector: International financial centre

The Cayman Islands may be small — approximately 65,000 residents across three Caribbean islands — but their currency punches well above its geographic weight. The Cayman Islands dollar has been pegged to the US dollar at a fixed rate of 1.20 since 1974, a peg that has held without interruption for over five decades.

The peg is sustainable because the Cayman Islands economy generates exceptional foreign currency inflows. As one of the world’s leading offshore financial centres, the Cayman Islands hosts thousands of hedge funds, private equity vehicles, structured finance vehicles, and the regional offices of major global banks. This financial infrastructure creates persistent capital inflows that underpin the peg’s credibility without recourse to the kind of oil revenues that sustain Gulf currencies.

The absence of direct taxation — no corporate tax, no income tax, no capital gains tax — also functions as a structural attractor for international capital, further reinforcing demand for the local currency.

For travellers, the Cayman Islands’ combination of strong currency and luxury resort economy makes it one of the Caribbean’s more expensive destinations. But that premium reflects something real: it is, genuinely, one of the most politically stable and financially sophisticated jurisdictions in the Western Hemisphere.

#5 — United Kingdom: History’s Most Enduring Major Currency

GBP/USD: ≈ 1.26 | Bank of England base rate: 4.25% (Feb 2026) | UK GDP growth forecast: 1.3% (IMF 2026)

The pound sterling has a plausible claim to being the world’s oldest currency still in active use. Predating the United States by more than a millennium in its earliest forms, sterling carries the weight of institutional memory — and the scars of historical crises, from the 1976 IMF bailout to Black Wednesday in 1992 to the post-Brexit adjustment of 2016. That the pound has navigated all of this and still trades above $1.25 says something significant about the resilience of UK monetary institutions.

The Bank of England, established in 1694, has been on a cautious easing path since mid-2024, reducing its base rate from the post-pandemic peak of 5.25% to 4.25% by early 2026 as UK inflation — which ran brutally hot in 2022–2023 — returned closer to the 2% target. Core CPI had moderated to approximately 2.7% by early 2026, still slightly elevated but no longer the acute political crisis it was.

The UK’s economic structure — highly service-oriented, with the City of London representing one of the world’s two or three most important financial centres — means sterling’s value has always been intimately connected to confidence in UK financial governance. Post-Brexit trade frictions have not destroyed that confidence, though they have permanently restructured some trade flows and depressed productivity estimates.

Travel angle: Sterling’s strength makes UK residents among the best-positioned travellers in the world, particularly when visiting North Africa, South-East Asia, or Eastern Europe, where exchange rate differentials translate into substantial purchasing power advantages. The pound buys significantly more in emerging markets today than it did five years ago.

#4 — Jordan: Strength Without Oil

JOD/USD: 1.41 (fixed peg) | Inflation: ~2.8% | IMF programme: Extended Fund Facility (ongoing)

Jordan’s presence in the top four is the most intellectually interesting entry on this list, because it is a standing refutation of the narrative that strong currencies require oil. Jordan has no significant hydrocarbon reserves. Its economy depends on phosphate exports, manufacturing, services, remittances from a large diaspora, foreign aid — primarily from the United States, Saudi Arabia, and the EU — and its strategic geopolitical position at the intersection of three continents and several of the region’s most complex political dynamics.

The Jordanian dinar has been pegged to the US dollar at a fixed rate of 0.709 JOD per dollar (implying approximately $1.41 per dinar) since 1995, a commitment the Central Bank of Jordan has maintained through multiple regional crises — the 2003 Iraq war, the 2011 Arab Spring, the Syrian refugee crisis (Jordan hosts one of the world’s largest refugee populations relative to its size), and the ongoing regional tensions of 2024–2025.

The peg’s credibility is purchased at a fiscal cost: Jordan must maintain sufficient foreign exchange reserves to defend it, which constrains domestic monetary flexibility and requires disciplined fiscal policy, often in collaboration with IMF structural adjustment programmes. That discipline — painful as it has periodically been — is precisely what makes the dinar’s high nominal value sustainable.

Investor angle: The JOD peg makes Jordan one of the more predictable currency environments in the Middle East, which partly explains why Amman has attracted meaningful foreign direct investment in logistics, technology, and pharmaceuticals in recent years.

#3 — Oman: The Prudent Gulf State

OMR/USD: 2.60 (fixed peg) | Oil production: ~1 mbpd | Moody’s rating: Ba1

The Omani rial’s fixed exchange rate of 2.6008 USD per rial has been unchanged for decades — a testament to the consistency of Oman’s monetary framework. Like its Gulf neighbours, Oman’s currency strength is anchored in hydrocarbon wealth, but the sultanate has pursued a more earnest diversification agenda than some of its neighbours, with meaningful investment in tourism, logistics, fisheries, and renewable energy under its Vision 2040 framework.

Oman’s fiscal position has improved markedly since the turbulence of the low-oil-price years of 2015–2016, when the country ran significant budget deficits and accumulated external debt. Higher oil prices in the early 2020s rebuilt fiscal buffers, and the government has since pursued subsidy reform and revenue diversification with greater determination than before. Moody’s upgraded Oman’s sovereign credit in 2023, reflecting improving balance-of-payment dynamics.

The Central Bank of Oman manages the currency through a currency board-style arrangement, holding sufficient USD reserves to back every rial in circulation at the fixed rate. This mechanistic commitment is what gives the OMR its enviable nominal stability — and what keeps it permanently ranked as the world’s third most valuable currency by exchange rate.

Travel angle: Oman’s strong currency, combined with its emergence as a luxury-eco-tourism destination, means it is not an especially cheap place to visit. But for holders of stronger currencies like the pound or the Swiss franc, the arithmetic is favourable — and Oman’s landscapes, from the Musandam fjords to the Wahiba Sands, make the cost worthwhile.

#2 — Bahrain: The Gulf’s Financial Hub

BHD/USD: 2.659 (fixed peg since 1980) | Financial sector: ~17% of GDP | Moody’s: B2

Bahrain’s dinar has been fixed to the US dollar at 0.376 BHD per dollar — implying approximately $2.66 per dinar — since 2001, maintaining an unchanged peg for a quarter century. That consistency, in a region not historically associated with monetary conservatism, is itself a form of credibility.

Bahrain’s economy is more diversified than Kuwait’s: the financial services sector contributes roughly 17% of GDP, making Manama one of the Gulf’s two dominant financial centres alongside Dubai. The country also has a more developed manufacturing base, including aluminium smelting, and has positioned itself as a regional hub for Islamic finance. This economic diversification is strategically significant because Bahrain has proportionally lower oil reserves than Kuwait or Saudi Arabia — the financial sector was, to some extent, a deliberate hedge against that exposure.

The BHD’s nominal strength is reinforced by Saudi Arabia’s implicit backstop role: the two countries share a causeway, a deep economic relationship, and a security alliance. Saudi Arabia’s vast financial resources have historically been seen as an informal guarantor of Bahraini monetary stability — a factor markets price into the risk premium attached to the dinar’s peg.

Investment angle: Bahrain’s status as a relatively open economy with few capital controls makes the BHD more accessible to international investors than most Gulf currencies. Its fintech regulatory sandbox and digital banking framework have drawn growing interest from global financial institutions in 2024–2025.

#1 — Kuwait: The Uncontested Crown

KWD/USD: ≈ 3.27 | Oil reserves: world’s 6th largest | Inflation: ~2.1% | FX reserves: > $45bn (CBK)

The Kuwaiti dinar is, by the most direct measure available — how many US dollars it takes to buy one unit — the strongest currency in the world. One dinar buys approximately $3.27 at current exchange rates, a premium that has been maintained, with only modest fluctuation, for decades.

Kuwait’s monetary position begins with geology. The country sits atop the world’s sixth-largest proven oil reserves, estimated at approximately 101 billion barrels — a figure that, relative to the country’s population of around 4.3 million citizens (and a total population of roughly 4.7 million including expatriates), represents extraordinary per-capita resource wealth. Oil and petroleum products account for more than 85% of government revenue and over 90% of export earnings. When oil prices are elevated — as they broadly have been across 2022–2025 — the fiscal arithmetic is essentially self-reinforcing.

The Central Bank of Kuwait manages the dinar through a managed peg to an undisclosed basket of international currencies, with the US dollar believed to constitute the largest single weight, given Kuwait’s oil revenues are denominated in dollars. This basket arrangement gives the CBK marginally more flexibility than a simple USD peg — it insulates the dinar slightly from bilateral dollar volatility.

Kuwait’s sovereign wealth fund, the Kuwait Investment Authority (KIA), is among the oldest and largest in the world, with assets variously estimated at over $900 billion. This vast stock of externally held financial wealth provides an additional buffer for the currency — in extremis, the KIA’s assets could theoretically be liquidated to defend the dinar. In practice, they have never needed to be. The combination of ongoing oil revenues, low domestic inflation (circa 2.1%), and conservative fiscal management has kept the dinar stable in nominal terms for as long as most investors can remember.

It is worth acknowledging the critique: Kuwait’s currency strength reflects resource rents and fiscal subsidies rather than diversified economic productivity. The dinar has not been “stress-tested” in the way the Swiss franc has, across multiple non-commodity-linked monetary regimes. A world permanently transitioning away from fossil fuels would eventually restructure the fiscal basis of KWD strength. But “eventually” is doing considerable work in that sentence. In March 2026, with global oil demand still running at near-record levels and the energy transition proceeding more slowly than many modelled, the Kuwaiti dinar remains — unchallenged — the most valuable currency on the planet by exchange rate.

Travel angle: For visitors holding stronger currencies (GBP, CHF, EUR), Kuwait is a genuinely affordable destination for what it offers — a sophisticated urban environment, world-class dining, and proximity to the rest of the Gulf. For those arriving with weaker currencies, the dinar’s strength can feel formidable at the exchange counter.

The Big Picture: What Strong Currencies Mean for Travel and Investment in 2026

The Travel Equation

Currency strength creates a purchasing-power asymmetry that sophisticated travellers have long exploited. Holding a strong currency — Kuwaiti dinar, British pound, Swiss franc, or euro — means that destinations with weaker currencies effectively go “on sale” from the holder’s perspective.

In 2026, the most compelling value gaps are between strong-currency nations and emerging markets where inflation has eroded local purchasing power without triggering proportionate currency depreciation. South-East Asia (Thailand, Vietnam, Indonesia), parts of Central and Eastern Europe, and much of Sub-Saharan Africa offer exceptional experiential value for travellers from the currencies on this list.

For travellers from weaker-currency nations visiting strong-currency countries — the United Kingdom, Switzerland, or the Gulf states — the inverse applies. The exchange rate headwind is real and material. Budget accordingly.

The Investment Case

Strong currencies are not automatically superior investment vehicles. A currency that is strong because it is pegged to the dollar (BHD, OMR, JOD, KYD) offers exchange-rate stability but does not offer upside appreciation. The Swiss franc and Singapore dollar — both managed floats — have historically appreciated in real terms over time, making them genuine long-term stores of value.

The broader investment signal from strong-currency nations is less about the currency itself and more about the policy environment it implies: low inflation, institutional independence, disciplined fiscal management, and rule of law. These are also the conditions most conducive to long-term capital preservation and, frequently, to strong equity market performance.

The Geopolitical Dimension

Several currencies on this list are exposed to geopolitical tail risks that their stable exchange rates do not fully price. Gulf currencies depend on continued hydrocarbon demand and regional stability. The pound is permanently sensitive to UK fiscal credibility and any resurgence of concerns about debt sustainability. The euro faces structural tensions that have been managed but not resolved.

The Swiss franc and Singapore dollar stand apart: their strength is built on institutional foundations that are largely independent of any single commodity price, political decision, or regional dynamic. In a world of elevated geopolitical uncertainty, that institutional bedrock commands a premium that is likely to persist.

Conclusion: Currency Strength as a Mirror of National Character

The currencies at the top of this ranking are not accidents. The Kuwaiti dinar is strong because Kuwait made conservative choices about how to manage extraordinary resource wealth — choices that not every resource-rich nation has made. The Swiss franc is strong because Switzerland has maintained institutional discipline across a century and three-quarters of monetary history. The pound retains its position because British financial markets have earned global trust over decades, even while political decisions have periodically tested it.

For travellers, the lesson is straightforward: when your home currency is strong, the world effectively gives you a discount on its experiences. For investors, the lesson is more nuanced: strength by nominal exchange rate and strength by structural monetary credibility are not the same thing — and in the long run, the latter matters more.

In 2026, the world’s currency hierarchy reflects, as it always has, the aggregate of every monetary policy decision, every fiscal choice, and every institutional investment that preceded it. The dinar, the franc, the pound, the rial — each is a ledger of its nation’s choices, settled daily on the world’s foreign exchange markets.

Frequently Asked Questions (FAQ Schema)

Q1: What is the strongest currency in the world in 2026?
The Kuwaiti Dinar (KWD) is the strongest currency in the world in 2026 by nominal exchange rate, trading at approximately $3.27 per dinar as of early March 2026. Its strength is underpinned by Kuwait’s vast oil reserves, conservative central bank management, and a managed basket peg that maintains extraordinary stability.

Q2: Which country has the strongest currency for travel in 2026?
For travellers, holding UK Pounds Sterling (GBP), Swiss Francs (CHF), or Euros (EUR) provides the most practical travel purchasing power advantage globally, as these currencies are widely accepted worldwide and deliver significant exchange-rate advantages in emerging markets across Asia, Africa, and Eastern Europe.

Q3: Why is the Kuwaiti Dinar so strong?
The Kuwaiti Dinar’s strength derives from Kuwait’s position as one of the world’s largest per-capita oil exporters, responsible fiscal management by the Central Bank of Kuwait, a managed currency peg to a basket of international currencies, low domestic inflation, and the backing of the Kuwait Investment Authority — one of the world’s largest sovereign wealth funds, with assets estimated at over $900 billion.

Q4: Is a strong currency good for a country’s economy?
A strong currency has both benefits and costs. Benefits include lower import costs (reducing inflation), greater purchasing power for citizens abroad, and stronger investor confidence. Costs include reduced export competitiveness, as locally produced goods become more expensive for foreign buyers, and potential pressure on manufacturing sectors. Countries like Switzerland and Singapore manage this tension deliberately through monetary policy.

Q5: What are the best currencies to hold as an investment in 2026?
For capital preservation, the Swiss Franc (CHF) and Singapore Dollar (SGD) have the strongest track records of long-term purchasing-power preservation among free-floating or managed-float currencies. For nominal stability, USD-pegged Gulf currencies (KWD, BHD, OMR) offer predictable exchange rates but limited upside appreciation. The US Dollar retains unparalleled liquidity and reserve-currency status. Diversification across multiple hard currencies remains the consensus recommendation from institutional investors.

Sources : Data sourced from Central Bank of Kuwait, Central Bank of Bahrain, Central Bank of Oman, Monetary Authority of Singapore, Swiss National Bank, Bank of England, European Central Bank, IMF World Economic Outlook (Oct 2025 / Jan 2026 update), World Bank International Comparison Programme, BIS Triennial Survey, Bloomberg FX data, and Reuters market data. Exchange rates are indicative mid-market values as of early March 2026 and are subject to market fluctuation.


Discover more from The Economy

Subscribe to get the latest posts sent to your email.

Continue Reading

Trending

Copyright © 2025 The Economy, Inc . All rights reserved .

Discover more from The Economy

Subscribe now to keep reading and get access to the full archive.

Continue reading