
Analysis
Pakistan’s Push for Climate-Resilient Budgeting Amid EU Carbon Pressures: A Path to Sustainable Exports?
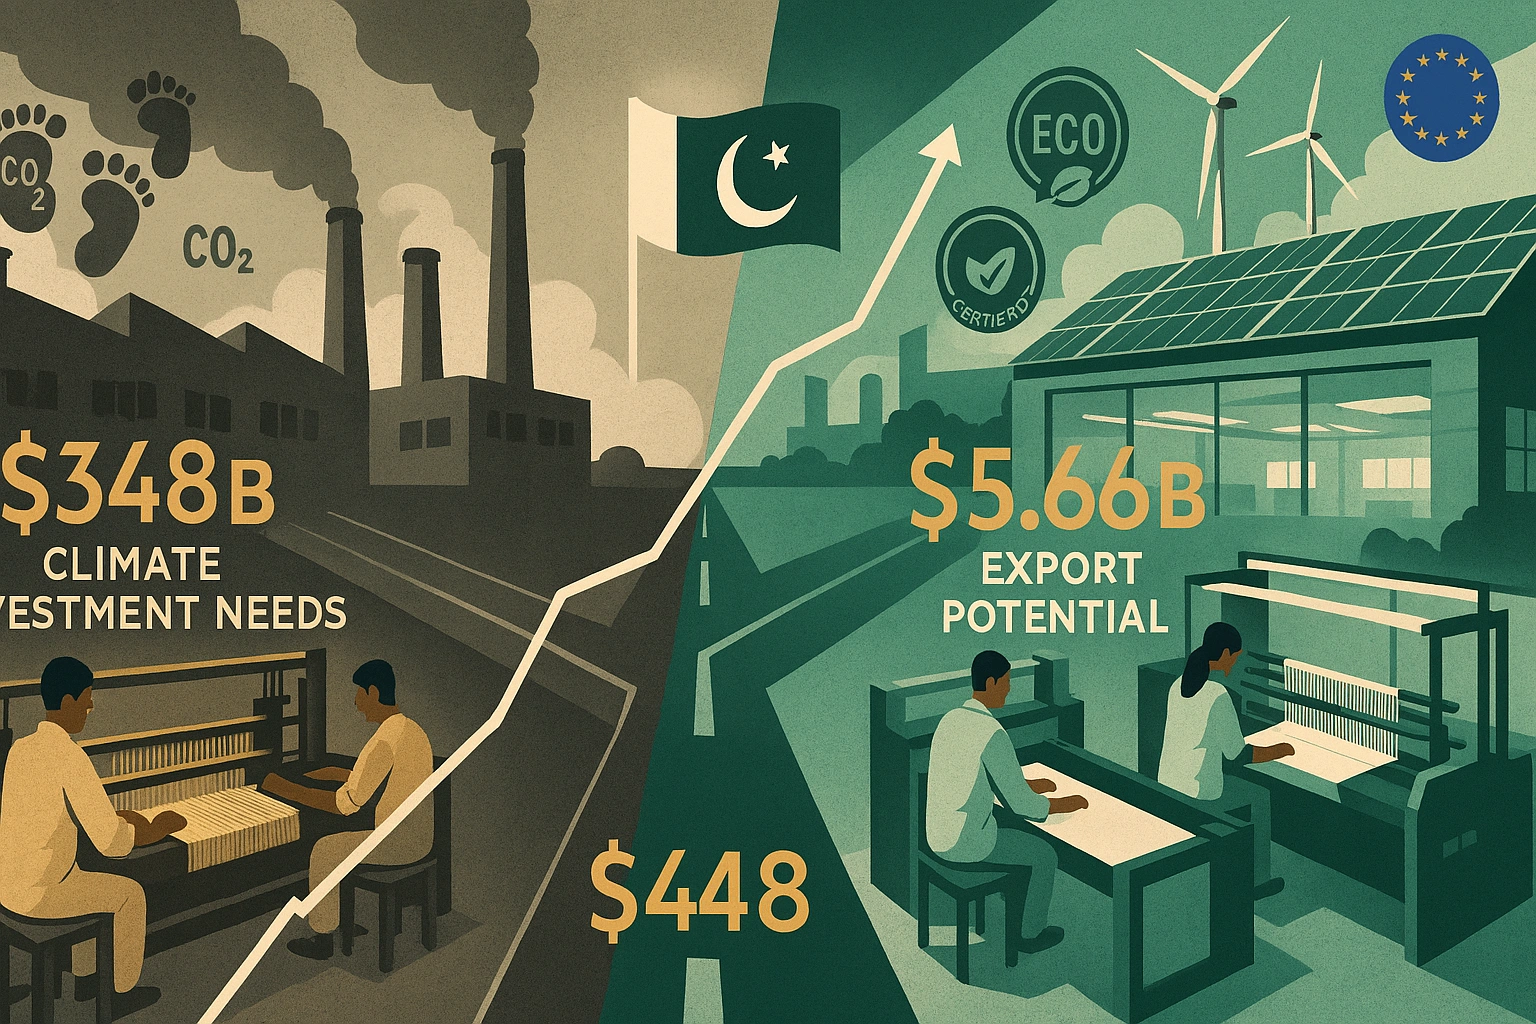
Professor Lubna Naz of Institute of Business Administration Karachi, delivered a warning that reverberated far beyond academic walls. “The European Union will bind Pakistan’s textile sector to carbon footprint thresholds by 2027-2030,” she told a January 2026 panel on decentralizing climate action. “If it happens, our major exports may suffer—and we’ll pay a heavy price.”
Her words cut to the heart of a dilemma now gripping Pakistan’s economic policymakers: how to reconcile surging climate vulnerabilities with trade realities that keep the nation afloat. Textiles account for approximately 60% of Pakistan’s exports, with the EU absorbing $9.0 billion worth of Pakistani goods in 2024 alone—making Pakistan the largest beneficiary of the EU’s GSP+ preferential trade scheme. Yet Europe’s Carbon Border Adjustment Mechanism (CBAM)—already targeting steel, cement, and fertilizers since October 2023—threatens to impose stringent carbon limits on textiles within the next four years, potentially offsetting the very trade benefits Pakistan has cultivated.
For the first time in history, Pakistan’s Finance Ministry has responded with an unprecedented directive: all federal ministries must submit pro-climate budget proposals for fiscal year 2026-27. Advisor to the Finance Minister Khurram Schehzad framed the move as existential, stating this marks “the first time” climate considerations will shape budget planning across government. But can green budgeting close a $348 billion climate investment gap by 2030—and save Pakistan’s textile lifeline in the process?
The EU’s Carbon Gauntlet: What CBAM Means for Pakistan’s Textile Dominance
The Carbon Border Adjustment Mechanism represents a fundamental shift in how the European Union approaches climate-linked trade policy. Launched in its transitional phase in October 2023, CBAM initially targets six carbon-intensive sectors: cement, iron and steel, aluminum, fertilizers, electricity, and hydrogen. By 2026, the mechanism enters its definitive regime, requiring EU importers to purchase carbon certificates reflecting the embedded emissions in their goods—certificates priced according to the EU’s Emissions Trading System allowances.
Currently, only 1.3% of Pakistan’s exports to the EU fall under CBAM’s scope, primarily steel and cement products. However, the European Commission has signaled its intention to expand the mechanism to cover additional sectors, including chemicals, polymers, and critically for Pakistan, textiles. As one recent analysis notes, “Beyond 2026, the EU has indicated that it intends to broaden CBAM to cover chemicals, polymers, and possibly textiles. For Pakistan, where textiles make up about 60 per cent of all exports and 28 per cent of trade with the EU, this is concerning.”
The threshold mechanism is particularly punishing: importers bringing more than 50 tons of covered goods annually into the EU must register as authorized CBAM declarants and purchase certificates matching their products’ carbon footprint. For Pakistan’s textile sector—characterized by high emission intensity due to reliance on fossil fuel-based energy and outdated machinery—this could translate into substantial cost increases that erode competitive advantages.
The timing couldn’t be worse. Pakistan’s textile exports have shown fragile recovery, growing just 0.93% to $16.655 billion in fiscal year 2023-24 after a steep 14.63% decline the previous year. Meanwhile, competitors like Bangladesh, Vietnam, and India are already implementing carbon pricing mechanisms and measurement, reporting, and verification (MRV) systems to prepare for CBAM compliance—moves that could position them favorably while Pakistan falls behind.
Pakistan Climate Change Budget FY2026-27: A Historic Fiscal Pivot
Against this backdrop, Pakistan’s Finance Division has issued its Budget Call Circular for FY2026-27, projecting 5.1% GDP growth and 6.5% inflation while introducing a groundbreaking climate dimension. For the first time, the budget incorporates Climate Budget Tagging (CBT), classifying over 5,000 cost centers across federal ministries under adaptation, mitigation, and supporting categories. This tagging has been integrated into the government’s Integrated Financial Management Information System (IFMIS), enabling real-time tracking of climate-sensitive expenditures.
The Pakistan green budgeting reforms extend beyond mere accounting. The government has introduced Form-III C screening mechanisms ensuring every federal subsidy aligns with national climate objectives before disbursement—a requirement also mandated under the IMF’s Extended Fund Facility program. Minimum thresholds now guarantee that at least 8% of current expenditures and 16% of Public Sector Development Program allocations are climate-tagged, representing a structural commitment to environmental accountability.
Pakistan’s first climate-focused budget allocates PKR 603 billion to mitigation efforts, targeting clean energy transitions, sustainable agriculture, and emission reductions across sectors. Yet the scale of the challenge dwarfs these initial commitments. According to UN analysis, Pakistan faces a climate finance gap of $40-50 billion annually—money needed for everything from flood protection infrastructure to renewable energy buildout. With climate-related disasters already costing the economy an estimated 1.03% of GDP per event without proper risk financing mechanisms, the urgency is palpable.
“The language is different,” explained Kashmala Kakakhel, an independent climate finance specialist, describing Pakistan’s steep learning curve in accessing international climate funds. “The way you curate the entire proposal is very different. The climate rationale is very different.” This procedural complexity helps explain why, despite the existence of a $2 trillion global climate finance market encompassing the Green Climate Fund, Global Environment Facility, and specialized facilities, Pakistan has struggled to mobilize resources at the scale required.
Pakistan Climate Finance Gap: Bridging the $348 Billion Chasm
The mathematics are sobering. Pakistan’s Nationally Determined Contributions outline $348 billion in climate investment needs through 2030—encompassing renewable energy infrastructure, climate-resilient agriculture, disaster preparedness systems, and green industrial transitions. Even with optimistic projections, domestic resource mobilization and traditional development finance cannot close this gap without innovative approaches.
Enter Islamic climate finance, a potentially transformative mechanism for a nation where faith-aligned financial instruments command broad public legitimacy. The Asian Development Bank’s analysis highlights how green sukuk (Islamic bonds) and climate-aligned Islamic financing structures could unlock billions in capital from regional Islamic financial institutions and sovereign wealth funds. WAPDA’s 2024 green euro bond issuance demonstrated proof of concept, though scaling such instruments requires robust regulatory frameworks and credible certification processes.
Yet institutional fragmentation hampers progress. “It’s just like a mismatch of jigsaw puzzle pieces,” observed Abid Qaiyum Suleri of the Sustainable Development Policy Institute, describing coordination challenges between federal and provincial authorities. “They will have their own projects. They will have their own priorities.” This siloed approach risks duplicating efforts, missing synergies, and failing to present coherent proposals to international climate funds that increasingly demand comprehensive national strategies.
The post-2022 flood period catalyzed some reforms. Pakistan launched its National Adaptation Plan in 2023 and published a National Climate Finance Strategy in 2024. The Planning Commission approved Climate Risk Screening Guidelines requiring all public investments to undergo climate-proofing assessments—critical steps toward the systematic integration Prof. Naz and others advocate. But implementation remains uneven, with technical capacity constraints particularly acute at provincial and district levels where climate impacts manifest most acutely.
EU Green Regulations Pakistan 2027: The Textile Sector at the Crossroads
For Pakistan’s textile manufacturers, carbon border adjustment Pakistan exports represents both an existential threat and a potential catalyst for long-overdue modernization. The sector’s emission intensity stems from multiple sources: coal and gas-fired power generation supplying energy-intensive processes, aging machinery operating below optimal efficiency, water-intensive dyeing and finishing operations, and limited adoption of circular economy principles in fiber sourcing.
Large conglomerates like Interloop Limited (which exported PKR 147 billion worth of textiles in FY2024), Style Textile, and Artistic Milliners have already begun sustainability transitions, investing in solar installations, water recycling systems, and certification programs meeting international environmental standards. However, these industry leaders represent a fraction of Pakistan’s textile ecosystem. Hundreds of small and medium enterprises operating with thin margins and limited access to capital face insurmountable barriers to rapid decarbonization without targeted support.
The GSP+ equation further complicates matters. Pakistan’s zero-tariff access to EU markets under the Generalized Scheme of Preferences Plus currently saves exporters billions in duties annually—a benefit that could be partially or entirely offset by CBAM certificate costs if textiles enter the mechanism’s scope as anticipated. One analysis suggests that inclusion of textiles in CBAM by 2027 would result in “carbon-related costs potentially neutralizing Pakistan’s preferential trade advantages,” forcing a fundamental reassessment of export competitiveness.
Professor Naz’s panel question resonates: what are the government’s accreditation plans? Without a national carbon registry, standardized emissions measurement protocols, and internationally recognized verification processes, Pakistani exporters cannot demonstrate compliance even if they invest in cleaner production. This creates a chicken-and-egg dilemma where investments in decarbonization may not yield market access if proper certification infrastructure doesn’t exist.
Carbon Border Adjustment Pakistan Exports: Risks, Opportunities, and Regional Responses
The risks are clear and quantifiable. Should CBAM extend to textiles at current emission intensities, Pakistan could face:
- Export revenue losses estimated in the billions as EU buyers shift to lower-carbon suppliers or domestic production
- Competitive disadvantage against regional rivals already implementing carbon pricing and building MRV capacity
- Investment flight as multinational brands recalibrate supply chains toward CBAM-compliant jurisdictions
- Employment shocks in a sector employing approximately 38% of Pakistan’s industrial workforce, predominantly lower-skilled workers with limited alternative opportunities
Yet crisis breeds opportunity. The same carbon pressures could accelerate Pakistan’s renewable energy transition, create new markets for eco-certified products, and position forward-thinking manufacturers as preferred partners for sustainability-conscious brands. Some potential pathways include:
Renewable Energy Scale-Up: Pakistan’s abundant solar and wind resources remain largely untapped for industrial use. Falling renewable costs now make distributed generation economically viable for textile clusters, offering both emissions reductions and energy security. The government’s recent focus on renewable energy in its NDC 3.0—incorporating specific targets for solar and wind capacity additions—provides policy support, though financing mechanisms and grid integration challenges require attention.
Technology Transfer and Innovation: The Diplomat’s analysis of climate-linked trade policy notes that “mechanisms to share emission reduction technology would be more effective” than punitive carbon tariffs alone. Pakistan could negotiate technology partnerships with European textile machinery manufacturers, potentially accessing cleaner production technologies at concessional terms through development finance institutions.
Green Premiums and Market Differentiation: A growing segment of EU consumers actively seeks sustainable products, willing to pay premiums for verified low-carbon textiles. Pakistani manufacturers achieving credible certification could capture this market segment, potentially offsetting CBAM costs through higher prices—though this requires investment in both production improvements and marketing.
Regional Learning: Competitor nations offer instructive examples. India recently expanded its carbon market to include petroleum refineries, petrochemicals, textiles, and secondary aluminum—explicitly building “CBAM Resilience” into industrial policy. Vietnam and Indonesia have launched national carbon pricing pilots. Even Turkey’s focus on electric arc furnaces in steel production demonstrates how sector-specific technological choices can dramatically reduce carbon intensity. Pakistan’s delayed response creates catching-up challenges but also allows learning from others’ successes and failures.
Policy Pathways Forward: What Pakistan Must Do Now
Transforming carbon constraints into competitive advantages requires coordinated action across multiple fronts. Based on international best practices and Pakistan’s specific circumstances, several priority interventions emerge:
Establish National Carbon Infrastructure: Pakistan needs a centralized carbon registry tracking emissions across industries, particularly export sectors. This registry should employ internationally standardized protocols (ISO 14064, GHG Protocol) ensuring EU recognition. The Planning Commission’s Climate Risk Screening Guidelines provide a foundation, but implementation must extend beyond project approval to operational monitoring.
Accelerate Sector-Specific Decarbonization Roadmaps: Rather than generic climate targets, Pakistan requires detailed transition plans for textiles, cement, steel, and other CBAM-vulnerable industries. These roadmaps should identify specific technological interventions (energy-efficient machinery, renewable power integration, process optimization), quantify costs and emission reductions, and sequence investments strategically. The National Climate Change Policy’s regular review mechanism provides an institutional home for such planning.
Mobilize Blended Climate Finance: Closing the $40-50 billion annual gap demands innovative financing combining public resources, development finance, green bonds, Islamic climate instruments, and private capital. Pakistan’s recent approval for a $1.4 billion IMF climate resilience facility represents a start, but scaling requires strengthening institutional capacity to design fundable projects meeting international climate fund criteria.
Build SME Capacity for Compliance: Large textile exporters can afford carbon audits, emissions monitoring, and certification—small enterprises cannot. Government-sponsored technical assistance programs, perhaps partnered with industry associations and international development agencies, could provide subsidized carbon accounting services, technology assessments, and compliance roadmaps for SMEs. Without such support, CBAM risks becoming a regressive mechanism favoring large players while eliminating smaller competitors.
Strengthen EU-Pakistan Climate Dialogue: Rather than viewing CBAM purely as an external imposition, Pakistan should engage proactively in EU climate policy discussions. The European Commission’s textiles strategy acknowledges supporting developing countries in green transitions. Pakistan could negotiate technical assistance, preferential access to EU climate technology, and potentially transitional measures recognizing countries making good-faith decarbonization efforts even if absolute emission levels remain elevated.
Integrate Climate into Trade Negotiations: Future trade agreements should explicitly incorporate climate provisions—not as barriers but as frameworks for mutual support. Pakistan’s trade offices, currently focused on traditional market access issues, need climate expertise to navigate this evolving landscape where environmental performance increasingly determines commercial access.
Turning Carbon Constraints into Export Resilience
Pakistan stands at a crossroads that Professor Naz articulated so starkly in Karachi. The convergence of climate vulnerabilities and carbon-linked trade regulations creates genuine risks to an export sector that remains the economy’s lifeblood. Yet this same pressure could catalyze the modernization, innovation, and sustainability transitions that Pakistan’s textile industry has deferred for decades.
The Pakistan climate change budget FY2026-27 represents a historic first step—acknowledgment that fiscal policy and climate action are inseparable in an era of European Green Deals and carbon border adjustments. Climate Budget Tagging, ministerial mandates for pro-climate proposals, and integration of environmental screening into subsidy allocation all signal genuine political commitment. But ambition must meet execution.
The $348 billion question—whether Pakistan can mobilize the investment required for climate resilience while maintaining export competitiveness—has no easy answer. It demands governmental coordination that transcends bureaucratic silos, private sector investment despite uncertain returns, international partnerships balancing support with accountability, and public understanding that short-term costs yield long-term sustainability.
For Pakistan’s textile exporters eyeing European markets nervously as 2027 approaches, the message is clear: adaptation is not optional. The only choice is whether to scramble reactively when CBAM expansion hits or to invest proactively in the cleaner, more efficient, climate-resilient production systems that increasingly define global competitiveness.
As Khurram Schehzad’s unprecedented budget directive demonstrates, Pakistan’s government has recognized the stakes. Now comes the harder work: translating recognition into action, climate tags into tangible emissions reductions, and constraint into catalyst. The path from carbon vulnerability to export resilience exists—but the window to walk it is narrowing with each passing fiscal year.
For more information on Pakistan’s climate adaptation efforts and financing challenges, see Dawn’s coverage of the climate funding gap and Business Recorder’s analysis of CBAM implications.
Discover more from The Economy
Subscribe to get the latest posts sent to your email.


The Monetary Authority of Singapore nudged its exchange-rate-based policy stance slightly tighter in its July review, a modest but notable shift after the city-state’s economy grew a stronger-than-expected 5.7% year-on-year in the second quarter, powered by an AI-driven manufacturing boom that is increasingly reshaping the country’s growth mix.
Growth Beats Expectations Again
Singapore’s economy expanded 5.7% year-on-year in the second quarter of 2026, according to advance estimates from the Ministry of Trade and Industry released 14 July, moderating only slightly from an upwardly revised 6.3% in the first quarter, according to MAS’s own July policy statement. On a quarter-on-quarter seasonally adjusted basis, GDP rose 1.1%, continuing an unbroken run of above-trend expansion. Manufacturing has been the standout performer, posting 12.2% year-on-year growth in the second quarter — up from 8.0% in the first — driven by the electronics and precision engineering clusters riding the global AI capital expenditure wave, according to data reported by Indiplomacy.
The strength has prompted a wave of forecast upgrades. UOB Global Economics and Markets Research lifted its 2026 GDP growth forecast to 4.8% from 4%, while S&P Global Market Intelligence matched that upgrade, and Nomura flagged upside risk to its own 4.6% forecast, according to Xinhua — all comfortably above the Ministry of Trade and Industry’s official 2.0–4.0% guidance range.
MAS Leans Against Rising Core Inflation
The growth surprise has not been without cost. MAS Core Inflation, which excludes accommodation and private transport costs, rose to 1.5% year-on-year in the second quarter, up from 1.2% in the January–February period before the Middle East conflict began, according to the central bank’s own policy statement. Fuel-price surges have pushed up point-to-point transport and non-cooked food inflation, while retail goods prices have climbed on higher import costs and a tobacco tax increase.
In response, MAS increased the slope of the Singapore dollar nominal effective exchange rate (S$NEER) policy band slightly in its July review — a modest tightening move that builds on an April 2026 tightening step, according to the bank’s Macroeconomic Review. Singapore uses its exchange rate, rather than interest rates, as its primary monetary policy tool, managing the currency’s path within an undisclosed band against a basket of trading partner currencies.
The Positive Output Gap Is Widening
Perhaps the most telling technical signal in MAS’s July statement is its acknowledgment that Singapore’s positive output gap — the extent to which the economy is running above its estimated potential — is now forecast to widen further in 2026, rather than narrow as previously expected. That reflects both the stronger-than-anticipated first-half growth data and MAS’s expectation that GDP will be sustained at elevated levels near-term, powered by continued AI-related capital expenditure, a robust construction pipeline, and steady credit-driven expansion in the financial sector.
Singapore’s central bank, MAS, slightly tightened its S$NEER exchange-rate policy band in July 2026 after GDP grew 5.7% year-on-year in Q2, driven by AI-linked manufacturing growth of 12.2%. Core inflation rose to 1.5%, prompting the modest policy shift even as growth forecasts were upgraded to as high as 4.8%.
Why This Matters Beyond Singapore
As a bellwether for Asian trade and technology cycles, Singapore’s data offers one of the clearest real-time signals of how durable the global AI infrastructure buildout has become, even as broader Asian growth forecasts have been trimmed elsewhere in the region due to Middle East-driven energy costs. For global investors, the combination of resilient growth and rising core inflation puts MAS in a position other regional central banks may soon face: managing an AI-driven boom that is proving inflationary in ways that are only loosely connected to traditional demand-side overheating.
What to Watch
MAS’s next scheduled policy review will be closely watched for whether the central bank continues its gradual tightening path or judges that easing global energy costs — following the partial reopening of the Strait of Hormuz — have done enough of the disinflationary work on their own. Singapore’s full second-quarter economic survey, due after the advance estimate, will offer a fuller sectoral breakdown of where the AI-driven strength is concentrated.
Discover more from The Economy
Subscribe to get the latest posts sent to your email.

Indonesia has taken its first concrete legislative step toward building a financial centre intended to compete with Singapore, Hong Kong, and Dubai, as President Prabowo Subianto pushes an ambitious plan to draw foreign capital into Southeast Asia’s largest economy and lift growth toward 8% by the end of his term in 2029.
Parliament Passes Enabling Legislation
Indonesia’s parliament passed the enabling legislation for the new financial hub, laying its legal foundation, according to reporting by the South China Morning Post. The milestone marks the most tangible progress yet on a project analysts say is projected to attract billions of dollars in investment — though they caution that crucial details on tax incentives, investor eligibility requirements, and regulatory safeguards still need to be finalised before the centre can credibly compete with established regional players.
The ambition is unmistakable: a financial centre capable of pulling capital away from Singapore’s deep, established markets, Hong Kong’s China-gateway status, and Dubai’s fast-growing wealth-management ecosystem is a tall order, and observers note that persuading global institutional investors to relocate meaningful operations to a new jurisdiction is a multi-year undertaking that has only just begun in earnest.
Indonesia’s parliament passed enabling legislation in July 2026 for a new financial hub designed to rival Singapore, Hong Kong, and Dubai, as President Prabowo Subianto targets 8% GDP growth by 2029. Singapore remains Indonesia’s top foreign investor at $8.8 billion in H1 2026, ahead of Hong Kong and China.
A Broader Investment Story Already Taking Shape
The financial-hub push arrives alongside signs that Indonesia is already deepening its role as a regional investment destination. Singapore remained Indonesia’s largest foreign investor in the first half of 2026, contributing $8.8 billion, followed by Hong Kong at $7.8 billion, China at $3.9 billion, Japan at $1.9 billion, and the United States at $1.7 billion, according to investment data reported by the New Straits Times. Malaysia ranked fifth, contributing $700 million in the second quarter alone, as Indonesia’s total realised investment reached Rp511.8 trillion.
Indonesian Investment Minister Rosan Roeslani has pointed to regulatory reform — including Government Regulation No. 28, introduced last October, which he said has provided greater licensing certainty — as a key driver of investor interest, while explicitly acknowledging that neighbouring economies are reforming in parallel, requiring Indonesia to keep pace.
Growth Outlook Holds Steady Amid Regional Headwinds
The financial-hub push comes as Indonesia’s broader macroeconomic backdrop remains comparatively resilient. The Asian Development Bank’s July 2026 outlook kept Indonesia’s growth forecast unchanged at 5.2% for both 2026 and 2027, even as the bank lowered its overall developing Asia and Pacific growth projection to 4.9% amid Middle East-driven energy cost pressures. That stability stands in contrast to Malaysia, whose 2026 growth forecast was revised only marginally higher to 2%, according to the same ADB report — even as Maybank Investment Banking Group separately upgraded its own Malaysia forecast more aggressively, to 4.9%, citing strong regional investor interest at July’s Invest ASEAN conference in Singapore, which drew 200 institutional investors managing a combined $23 trillion in assets.
Rice Diplomacy as a Parallel Economic Thread
Indonesia’s regional economic engagement extends beyond high finance. State logistics agency Bulog is continuing negotiations with Malaysia and Singapore over proposed rice export deals, with pricing and commercial terms still under discussion as of mid-July, according to The Star. The talks illustrate the breadth of Indonesia’s economic diplomacy push across ASEAN even as its flagship financial-hub ambitions dominate headlines.
What It Means for Global Investors
For asset managers and multinationals weighing where to locate Southeast Asian operations, Indonesia’s financial-hub legislation is a signal of intent rather than an immediate call to relocate. The real test will come as tax-incentive structures, licensing rules, and investor-protection frameworks are finalised over the coming months — details that will determine whether Jakarta can credibly compete with Singapore’s decades-long regulatory head start, or whether the hub instead becomes a complementary gateway focused on domestic Indonesian capital markets and Belt-and-Road-adjacent regional flows.
Discover more from The Economy
Subscribe to get the latest posts sent to your email.
China’s leadership used its closely watched late-July Politburo meeting to strike a more supportive tone on the economy without committing to the kind of sweeping stimulus package investors had hoped might follow a sharp second-quarter slowdown, reinforcing Beijing’s preference for targeted, precision-guided policy support over broad-based easing.
Growth Slows Below Beijing’s Own Target Range
China’s economy expanded 4.3% year-on-year in the second quarter of 2026, a marked deceleration from the 5.0% pace recorded in the first quarter and a figure that sits below the lower bound of Beijing’s own 4.5–5% full-year growth target — the lowest such target range Beijing has set since the early 1990s, according to CryptoBriefing’s analysis of the data. Consumer demand has remained persistently weak, and deflationary pressure has now been a recurring theme in the Chinese economy for several consecutive quarters.
A Reuters poll of economists ahead of the meeting found growth for 2026 as a whole is expected to cool to around 4.6%, before easing further to roughly 4.4% in 2027, as weak domestic demand offsets the boost from resilient exports recorded during a global oil-price shock earlier this year.
Fiscal Firepower Exists — But Beijing Is Choosing Restraint
Perhaps the most consequential signal from analysts previewing the meeting was not about new money, but about unused capacity. China retains roughly RMB 6.8 trillion of this year’s approved government bond issuance quota still undeployed as of the end of June, alongside an RMB 800 billion quasi-policy financing instrument and an estimated RMB 1.8 trillion in unused bond quota carried over from prior years, according to analysis published on Substack’s macro research platform. The implication: Beijing does not lack tools, it is choosing to prioritise faster execution of existing plans over announcing a new headline package.
Standard Chartered economists have argued the meeting was likely to emphasise accelerating fiscal execution in the second half rather than expanding the overall scope of policy support, with monetary policy relegated to a supplementary role. That reading is consistent with the People’s Bank of China’s approach since May 2025, when it last adjusted policy rates or reserve requirements, opting instead for short-term liquidity operations.
China’s July 2026 Politburo meeting signalled stronger support language without a large new stimulus package, after Q2 GDP growth slowed to 4.3% — below Beijing’s 4.5–5% target. With RMB 6.8 trillion in unused bond quota available, policymakers are prioritising faster fiscal execution over broad-based monetary or fiscal easing.
Property Downturn and Overcapacity Remain the Structural Drag
Beneath the headline growth numbers lies a widening bifurcation. New growth drivers — high-end manufacturing, the digital economy, and modern services — accounted for more than 40% of growth in the first half, with high-tech manufacturing value-added up 13.3%. Yet retail sales grew just 1.3% year-on-year in the same period, and fixed-asset investment fell 5.7%, according to detailed policy analysis from independent China economy newsletter Fred Gao. That divergence — a resilient “new economy” propping up an ailing “old economy” — is precisely the dynamic policymakers appear determined not to paper over with indiscriminate stimulus that could derail the structural transition central to the 15th Five-Year Plan’s opening year.
Markets Should Watch Implementation, Not Rhetoric
The consistent message from economists across Citi, Standard Chartered, and independent research houses ahead of the meeting was that markets should discount policy language and instead track fiscal execution data in the coming months — the pace of local government bond issuance, infrastructure project approvals, and any loosening of housing-related restrictions in major cities. Beijing’s playbook, as one analyst close to policymaking circles put it, increasingly resembles precision-guided support rather than the credit-fuelled stimulus waves of 2008–09 or 2015–16.
What It Means for Investors
For global investors positioned in Chinese equities, the yuan, or commodities exposed to Chinese infrastructure demand, the takeaway is one of managed disappointment: meaningful policy support is coming, but gradually, and calibrated to avoid reigniting the property-sector excesses Beijing spent years trying to unwind. A weaker yuan remains the most likely near-term consequence of any incremental stimulus, while a sharper-than-expected growth slowdown in the third quarter remains the primary catalyst that could force Beijing’s hand toward broader action.
Discover more from The Economy
Subscribe to get the latest posts sent to your email.

Singapore MAS Tightens Policy as GDP Growth Hits 5.7%

Fed Holds Rates Under Warsh as Trump Rolls Out New Tariffs

Indonesia Financial Hub 2026: Can It Rival Singapore, Dubai?

Russia Fuel Shortages 2026: Inside a Cracking War Economy

China Politburo July 2026: Stimulus Signals Explained

Andy Burnham, UK Gilts and Mortgages: July 2026 Explainer

Pakistan’s 2026 Monsoon Floods Threaten Fragile Economic Recovery as Inflation Nears 9%

Pakistan Gulf Investment Outflows 2026: Peace Deal Stakes Explained

Canada Trade Diversification 2026: China, Indonesia, UAE Deals Explained

US Forced-Labour Tariffs on 60 Countries: The Hidden Trade Shock of 2026

Global Central Banks 2026: Fed, BoE and BoJ Decisions Could Reshape Markets

Gulf Capital Retreat From Pakistan 2026: UAE Loan Freeze & What It Means

Pakistan’s Most Reliable Export Is Its People: Remittances Hit $41.6 Billion, Overtaking Total Exports

Indonesia’s Confidence Problem: Record Investment, a Sinking Rupiah, and a Widening Credibility Gap

Carry Trade Unwind 2026: How the Yen’s Snapback Triggered a Global Margin Call

AI Bubble Warning 2026: Why BIS, IMF and Bank of England Fear a Market Crash

BRICS De‑Dollarization Strategy Takes Shape with $15 Billion Local‑Currency Push

The AI Super Bubble Is Ready to Burst

Russia Bans Diesel Exports 2026: Global Fuel Market Impact Explained

Strait of Hormuz Blockade 2026: Oil Prices Surge 9% as US-Iran Conflict Reignites

Private Credit Warning: Most BDCs Turn Unprofitable in 2026, Reuters Finds

Bitcoin $150k Milestone Achieved as US Sovereign Crypto Pivot Looms

IMF Cuts Pakistan Growth Forecast, Raises Inflation to 8.4%
Gulf Capital Retreat From Pakistan 2026: UAE Loan Freeze & What It Means

India Economic Rise 2026: How the Subcontinent Toppled Japan

Strait of Hormuz 2026: Why Markets Still Don’t Trust It’s Open

China Housing Market Turnaround: White‑List Model Stabilises Prices

Gold Price Forecast 2026: Fed’s July 29 Decision and Record Central Bank Buying Explained
-

 Markets & Finance7 months ago
Top 15 Stocks for Investment in 2026 in PSX: Your Complete Guide to Pakistan’s Best Investment Opportunities
-

 Analysis5 months ago
Johor’s Investment Boom: The Hidden Costs Behind Malaysia’s Most Ambitious Economic Surge
-

 Analysis5 months ago
Top 10 Stocks for Investment in PSX for Quick Returns in 2026
-

 Analysis6 months ago
Brazil’s Rare Earth Race: US, EU, and China Compete for Critical Minerals as Tensions Rise
-

 Banks6 months ago
Best Investments in Pakistan 2026: Top 10 Low-Price Shares and Long-Term Picks for the PSX
-

 Investment7 months ago
Top 10 Mutual Fund Managers in Pakistan for Investment in 2026: A Comprehensive Guide for Optimal Returns
-

 Global Economy7 months ago
15 Most Lucrative Sectors for Investment in Pakistan: A 2025 Data-Driven Analysis
-

 Global Economy7 months ago
Pakistan’s Export Goldmine: 10 Game-Changing Markets Where Pakistani Businesses Are Winning Big in 2025