
Auto
BYD’s Ambitious 24% Export Growth Target for 2026: Can New Models and Global Showrooms Defy a Slowing China EV Market?

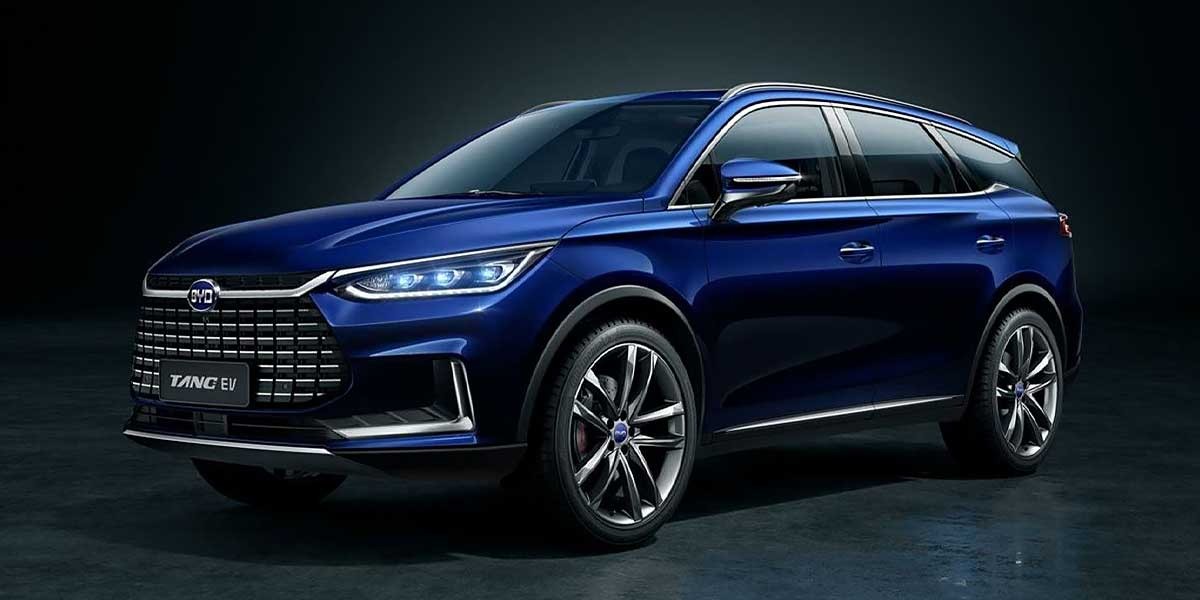
BYD’s auditorium at Shenzhen headquarters that crystallizes the strategic pivot of the world’s largest electric vehicle maker: 1.3 million. This is BYD’s target for overseas sales in 2026, a 24.3% jump from the previous year, as announced by branding chief Li Yunfei in a January media briefing. This figure is more than a goal; it is a declaration. With China’s domestic EV market showing unmistakable signs of saturation and ferocious price wars eroding margins, BYD’s relentless growth engine now depends on its ability to replicate its monumental domestic success on foreign shores. The question echoing through global automotive boardrooms is whether its expanded lineup—including the premium Denza brand—and a rapidly unfurling network of international showrooms can overcome rising geopolitical headwinds and entrenched competition.
The Meteoric Ascent: How BYD Built a Colossus
To understand the magnitude of the 2026 export target, one must first appreciate the velocity of BYD’s ascent. The company, which began as a battery manufacturer, has executed one of the most stunning industrial transformations of the 21st century. In 2025, BYD sold approximately 4.6 million New Energy Vehicles (NEVs), cementing its position as the undisputed volume leader. Crucially, within that figure lay a milestone that shifted the global order: ~2.26 million Battery Electric Vehicles (BEVs), officially surpassing Tesla’s global deliveries and seizing the BEV crown Reuters.
The foundation of this dominance is vertical integration. BYD controls its own battery supply (the acclaimed Blade Battery), semiconductors, and even mines key raw materials. This mastery over the supply chain provided a critical buffer during global disruptions and allows for aggressive cost control. However, the domestic market that fueled this rise is changing. After years of hyper-growth, supported by generous government subsidies, China’s EV adoption curve is maturing. The result is an intensely competitive landscape where over 100 brands are locked in a profit-eroding price war Bloomberg.
BYD’s 2026 Export Blueprint: From 1.05 Million to 1.3 Million
BYD’s overseas strategy is not a tentative experiment but a full-scale offensive, backed by precise tactical moves. The 2025 export base of approximately 1.04-1.05 million vehicles—representing a staggering 145-200% year-on-year surge—provides a formidable launchpad. The 2026 plan, aiming for 1.3 million units, is built on two articulated pillars: product diversification and network densification.
1. New Models and the Premium Denza Push: Li Yunfei explicitly stated the launch of “more new models in some lucrative markets,” which will include Denza-branded vehicles. Denza, BYD’s joint venture with Mercedes-Benz, represents its attack on the premium segment. Launching models like the Denza N9 SUV in Europe and other high-margin markets is a direct challenge to German OEMs and Tesla’s Model X. This move upmarket is essential for improving brand perception and profitability beyond the volume-oriented Seal and Atto 3 (known as Yuan Plus in China) Financial Times.
2. Dealer Network Expansion: The brute-force expansion of physical presence is key. BYD is moving beyond reliance on importers to establishing dedicated dealerships and partnerships with large, reputable auto retail groups in key regions. This provides localized customer service, builds brand trust, and significantly increases touchpoints for consumers. In 2025 alone, BYD expanded its European dealer network by over 40% CNBC.
The Domestic Imperative: Why Overseas Growth is Non-Negotiable
BYD’s export push is as much about necessity as ambition. The Chinese market, while still the world’s largest, is entering a new phase.
- Market Saturation in Major Cities: First-tier cities are approaching saturation points for NEV penetration, pushing growth into lower-tier cities and rural areas where consumer appetite and charging infrastructure are less developed.
- The Relentless Price War: With legacy automakers like Volkswagen and GM fighting for share and nimble startups like Nio and Xpeng launching competitive models, discounting has become endemic. This pressures margins for all players, even the cost-leading BYD The Wall Street Journal.
- Plateauing Growth Rates: After years of doubling, NEV sales growth in China is expected to slow to the 20-30% range in 2026, a dramatic deceleration from the breakneck pace of the early 2020s.
Consequently, overseas markets—with their higher average selling prices and less crowded competition—represent the most viable path for maintaining BYD’s growth trajectory and satisfying investor expectations.
The Global Chessboard: BYD vs. Tesla and the Chinese Cohort
BYD’s international expansion does not occur in a vacuum. It faces a multi-front competitive battle.
vs. Tesla: The rivalry is now global. While BYD surpassed Tesla in BEV volumes in 2025, Tesla retains significant advantages in brand cachet, software (FSD), and supercharging network density in critical markets like North America and Europe. Tesla’s response, including its own cheaper next-generation model, will test BYD’s value proposition abroad The Economist.
vs. Chinese Export Rivals: BYD is not the only Chinese automaker looking overseas. A look at 2025 export volumes reveals a cohort in hot pursuit:
- SAIC Motor (MG): The historic leader in Chinese EV exports, leveraging the MG brand’s European heritage.
- Chery: Aggressive in Russia, Latin America, and emerging markets.
- Geely (Zeekr, Polestar, Volvo): A sophisticated multi-brand approach targeting premium segments globally.
While BYD currently leads in total NEV exports, its rivals are carving out strong regional niches, making global growth a contested space Reuters.
Geopolitical Speed Bumps and Localization as the Antidote
The single greatest risk to BYD’s 2026 export target is not competition, but politics. Tariffs have become the primary tool for Western governments seeking to shield their auto industries.
- European Union: Provisional tariffs on Chinese EVs, varying by manufacturer based on cooperation with the EU’s investigation, add significant cost. BYD’s rate, while lower than some rivals, still impacts pricing.
- United States: The 100% tariff on Chinese EVs effectively locks BYD out of the world’s second-largest car market for the foreseeable future.
BYD’s counter-strategy is localization. By building vehicles where they are sold, it can circumvent tariffs, create local jobs, and soften its political image. Its global factory footprint is expanding rapidly:
- Thailand: A new plant operational in 2024, making it a hub for ASEAN right-hand-drive markets.
- Hungary: A strategically chosen factory within the EU, set to come online in 2025-2026, to supply the European market tariff-free.
- Brazil: A major complex announced, targeting Latin America and leveraging regional trade agreements.
This “build locally” strategy requires massive capital expenditure but is essential for sustainable long-term growth in protected markets Bloomberg.
Risks and the Road Ahead: Brand, Quality, and Culture
Beyond tariffs, BYD faces subtler challenges. Brand perception in mature markets remains a work in progress; shifting from being seen as a “cheap Chinese import” to a trusted, desirable marque takes time and consistent quality. While its cars score well on initial quality surveys, long-term reliability and durability data in diverse climates is still being accumulated.
Furthermore, managing a truly global workforce, supply chain, and product portfolio tailored to regional tastes (e.g., European preferences for stiffer suspension and different infotainment systems) is a complex operational leap from being a predominantly domestic champion.
Conclusion: A Calculated Gamble on a Global Stage
BYD’s 24% export growth target for 2026 is ambitious yet calculated. It is underpinned by a formidable cost structure, a rapidly diversifying product portfolio, and a pragmatic shift to local production. The slowing domestic market leaves it little choice but to pursue this path aggressively.
The coming year will be a critical test of whether its engineering prowess and operational efficiency can translate into brand strength and customer loyalty across cultures. Success is not guaranteed—geopolitical friction is increasing, and competitors are not standing still. However, BYD has repeatedly defied expectations. Its 2026 export campaign is more than a sales target; it is the next chapter in the most consequential story in the global automotive industry this decade—the determined rise of Chinese automakers from domestic leaders to dominant global players. The world’s roads are about to become the proving ground.
Discover more from The Economy
Subscribe to get the latest posts sent to your email.


Nvidia CEO Jensen Huang called it the “ChatGPT moment for physical AI” at CES in early 2026 — and by September, the capital markets have taken the claim seriously. Physical AI robotics has moved decisively from research demo to commercial deployment: PepsiCo is running 35 driverless trucks on public Arizona highways, Tesla has committed $20 billion in capital expenditure to convert Model S/X production lines into Optimus humanoid robot manufacturing, and venture capital poured $47.4 billion into physical AI startups across 521 deals in just the first half of 2026. This is not a speculative technology narrative anymore — it is an industrial IoT and supply chain automation software buildout with real revenue, real deployed hardware, and a credible multi-trillion-dollar addressable market.
Key Takeaways
- The global physical AI market was valued at $81.4 billion in 2025 and is projected to reach roughly $1.145 trillion by 2035 (33.5% CAGR), with some more conservative estimates putting the narrower AI-robotics segment at $15.24 billion by 2032.
- Humanoid robot shipments in China were revised sharply upward by Morgan Stanley — from 14,000 units at the start of 2026 to a projected 50,000 units by year-end, following Tesla’s own Optimus Gen 3 production ramp.
- Autonomous trucking has crossed from pilot to paid commercial operation: Gatik has completed 60,000 driverless orders incident-free with $600 million in contracted revenue, and Volvo plans to remove safety drivers entirely on U.S. highways by Q1 2027.
- Full trucking automation could save the U.S. economy an estimated $300 billion annually in labor costs, with $100–125 billion in net savings after accounting for technology costs.
- Roland Berger projects the humanoid robot industry alone could reach $750 billion by 2035 and $4 trillion by 2050 — a scale comparable to today’s global automotive industry.
From Pilot to Production: The 2026 Inflection Point
For years, physical AI robotics and driverless tech lived in the same category as flying cars — perpetually five years away. That changed in mid-2026, when a cluster of commercial milestones landed within days of each other. PepsiCo became the first major U.S. consumer-goods company to disclose large-scale autonomous truck use on public roads, running driverless vehicles between bottling plants, storage facilities, and retail customers including Walmart and Dollar General. Simultaneously, Einride completed its business combination and began trading on Nasdaq, and multiple autonomous trucking developers — Aurora, PlusAI, Waabi, Kodiak Robotics — began preparing factory-built, driver-out trucks for mass production rather than retrofitted pilot vehicles.
| Milestone | Company | 2026 Status |
|---|---|---|
| Driverless highway trucking at scale | PepsiCo / Aurora | 35 trucks operating in Arizona |
| Fully driver-out commercial deliveries | Gatik | 60,000 orders completed, $600M contracted revenue |
| 1,000-mile validated driverless lane | Aurora Innovation | Fort Worth–Phoenix, 250,000+ driverless miles, zero system-attributed collisions |
| Long-haul paid delivery with no human in cab | Bot Auto | Houston–Dallas (230 miles) completed |
| Full safety-driver removal target | Volvo Autonomous Solutions | Q1 2027, U.S. Sunbelt corridor, 300+ trucks by end of 2027 |
| Humanoid production scale-up | Tesla Optimus | $20B capex; Gen 3 with 22 degrees of freedom, 50 actuators |
The Regulatory Map Is Catching Up
Autonomous freight is no longer operating in a legal gray zone in its core markets. Over half of U.S. states now have autonomous truck testing or operation rules, and 24+ states explicitly permit self-driving trucks, led by Texas, Arizona, Florida, Arkansas, and Nebraska — where the majority of current commercial operations run. Both Aurora and Gatik briefed the FMCSA and NHTSA ahead of launching driverless operations, establishing a federal engagement pattern other operators are now following. Internationally, Japan is targeting Level 4 autonomous trucks in 2026, UN regulatory harmonization for autonomous vehicles is expected by mid-2026, and Dubai has launched Apollo Go robotaxis via Uber with an explicit goal of 25% autonomous transportation by 2030.
The Humanoid Robot Market: From Demonstrators to Factory Floors
The industrial IoT story of 2026 isn’t just wheels — it’s hands. Hyundai Motor Group debuted its Atlas humanoid robot for production settings at CES 2026, and BMW Group is deploying Figure AI’s Figure 02 humanoid to improve productivity, safety, and consistency in automotive operations. Tesla’s Optimus Gen 3, now in production at the Fremont facility, features 22 degrees of freedom and 50 actuators — a meaningful dexterity leap that is the underlying justification for Tesla’s unprecedented $20 billion capex commitment to convert core vehicle production lines toward robot manufacturing, the single largest physical-AI capital investment made by any automotive OEM to date.
| Market Sizing Estimate | 2025/2026 Baseline | Long-Term Projection | Source Methodology |
|---|---|---|---|
| Broad physical AI market | $81.4B (2025) | $1.145T by 2035 (33.5% CAGR) | Kaiso Research |
| Narrower AI-robotics component | $0.89B (2025) | $15.24B by 2032 (47.2% CAGR) | Edge AI/perception-focused definition |
| Humanoid robotics specifically | ~$4.2B (2026) | $40.5B by 2033 (38.2% CAGR) | Industrial + service applications |
| Humanoid industry (long-run) | — | $750B by 2035 / $4T by 2050 | Roland Berger |
The variance across these estimates — spanning more than a factor of three — reflects genuine definitional disagreement in the industry: some trackers count only AI-native perception/planning software, others include the full hardware, sensor, and actuator supply chain. What’s consistent across every methodology is the direction and steepness of the growth curve, not the exact terminal number.
Where the Capital Is Actually Flowing
Investment in supply chain automation software and industrial IoT is concentrated in a few clear categories:
- Logistics and warehousing — the single largest application vertical by 2026 market share, spanning autonomous forklifts, pick-and-pack robotics, and warehouse fleet orchestration software.
- Automotive manufacturing — both as a deployment site (BMW, Hyundai) and as a capital source (Tesla’s Optimus pivot).
- Long-haul freight — Aurora, Gatik, Kodiak, Waabi, Bot Auto, and Volvo Autonomous Solutions collectively represent the most commercially mature driverless segment.
- Compute infrastructure — Nvidia’s Isaac GR00T and Cosmos models underpin a large share of the perception and planning stack across multiple manufacturers, making Nvidia a structural beneficiary regardless of which individual robotics vendor wins.
Amazon, notably, already operates over 1 million robots handling roughly 75% of its global fulfillment volume, illustrating that at true hyperscale, physical AI has already moved well past the pilot stage into core operational infrastructure — a preview of where the broader industrial economy is heading.
Risk Factors Every Investor and Operator Should Price In
| Risk Category | Detail |
|---|---|
| Deployment pace overstatement | IFR (International Federation of Robotics) takes a more conservative view than industry vendors, noting real-world humanoid deployment remains largely limited to demonstrators/pilots, with true commercialization sitting later in China’s 2026–2030 plan period |
| Battery and power limitations | Cited as a persistent technical constraint on humanoid endurance and continuous operation |
| Labor market disruption framing | Industry voices like Gatik’s VP of Government Relations argue automation is complementing, not replacing, the existing truck-driver workforce — a narrative distinction with real policy implications |
| Capital concentration risk | A small number of players (Tesla, Nvidia, Amazon, Figure AI, Aurora) account for a disproportionate share of both funding and deployed units |
| Cybersecurity and compliance readiness | Analysts now cite this as mandatory for global and regional market access, not an optional add-on |
FAQ
How large is the physical AI market expected to become? Estimates vary by methodology, but the most-cited long-run figures point to roughly $1.1–1.15 trillion by 2035 for the broad physical AI market, with the humanoid robotics segment alone potentially reaching $750 billion by 2035 and $4 trillion by 2050.
Are driverless trucks actually operating commercially today, or is this still a pilot technology? Both, depending on the operator. Companies like Gatik and Aurora have moved beyond pilots into paid, driver-out commercial operations with real contracted revenue, while others are still in supervised testing phases. Volvo has publicly committed to full driverless highway operations by Q1 2027.
Which industries are adopting physical AI robotics fastest? Logistics and warehousing hold the largest current market share, followed closely by automotive manufacturing and long-haul freight. Amazon’s fulfillment network, handling roughly 75% of its volume via over 1 million robots, represents the most mature large-scale deployment today.
What is the biggest risk to the physical AI investment thesis? Deployment-pace overstatement is the most commonly cited risk — more conservative industry bodies like the IFR note that real-world humanoid deployment remains largely limited to demonstrators and pilots, with full commercialization likely later in the decade than some vendor projections suggest.
Discover more from The Economy
Subscribe to get the latest posts sent to your email.
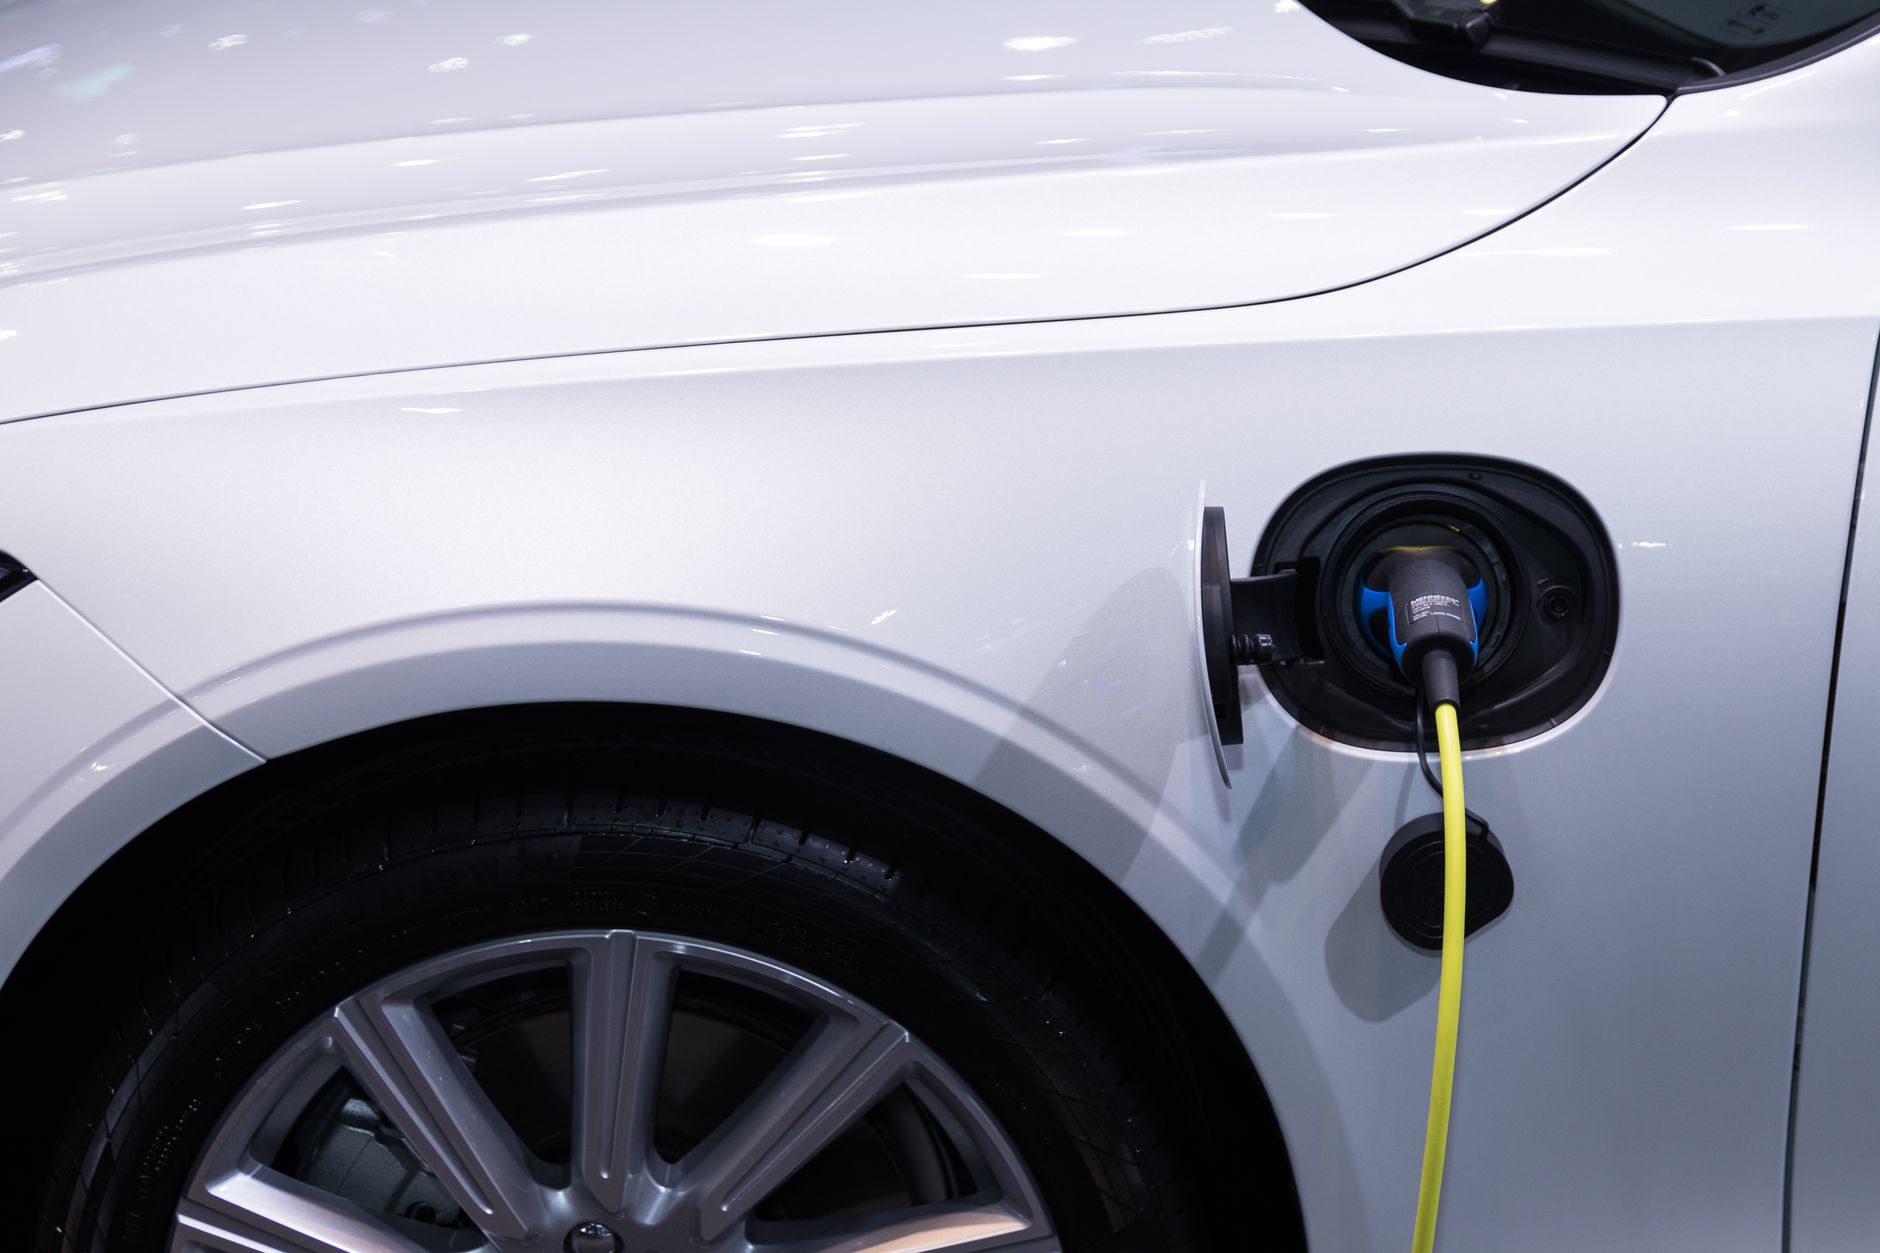
The electric vehicle pitch has always rested on a simple financial promise: fewer moving parts, lower fuel costs, and reduced routine maintenance. That promise is largely holding up in 2026 — but it obscures a second, less-discussed cost center that has grown more expensive, not less: insurance. For buyers and financing professionals evaluating total cost of ownership in 2026, the real story is a financial trade-off between genuine maintenance savings and a meaningfully higher insurance burden driven by battery economics.
Key Takeaways
- EVs cost about $330 less per year in routine maintenance than gas-powered vehicles, averaging roughly $949 annually versus higher combustion-engine upkeep, according to AAA driving-cost research — the “fewer moving parts” savings claim holds up in the data.
- EV insurance premiums run 15–42% higher than comparable gas vehicles, with 2026 estimates from Insurify putting average monthly EV insurance at $263 versus $185 for gas-engine cars.
- Battery pack replacement costs range from $4,000 to $22,000 depending on model and pack size, typically representing 30–40% of a vehicle’s total value — the single largest driver of elevated comprehensive and collision premiums.
- The average new EV cost $55,300 as of February 2026, per Cox Automotive — about $6,532 more than the average new gas vehicle — while used EVs have narrowed to just $1,334 above used gas-vehicle pricing.
- Car insurance rates broadly are projected to rise in 32 US states by the end of 2026, meaning EV owners face a double pressure: category-specific EV premiums layered on top of a generally rising rate environment.
The Maintenance Savings Case: Still Real, Still Meaningful
The mechanical simplicity argument for EVs remains well-supported by 2026 data. Electric vehicles have no oil changes, no transmission fluid service, no timing belt replacement, and no exhaust system — eliminating an entire category of scheduled maintenance that combustion vehicles require throughout their ownership life. AAA’s driving-cost research puts the resulting savings at roughly $330 per year, with average annual EV maintenance costs near $949.
This savings is real and durable, but it is smaller in absolute dollar terms than many buyers assume, and — critically for total-cost-of-ownership modeling — it is frequently outweighed by the insurance side of the ledger for higher-value EV models.
The Insurance Cost Reality: Where the Math Shifts
Where the EV financial story gets more complicated is insurance. Multiple 2026 data sources converge on a consistent range: EVs cost between 15% and 42% more to insure than comparable gas-powered vehicles, depending on the specific models compared and the data provider’s methodology. Insurify’s 2026 figures put the average monthly premium for a gas-engine vehicle at $185, versus roughly $263 for an EV — a 42% premium gap. Full-coverage annual premiums across a range of EV models span more than $8,000, from around $1,947 for a Chevrolet Silverado EV up to $10,402 for a higher-end model like the Audi SQ8 e-tron.
Why EV Insurance Costs More
- Higher replacement value. EVs generally carry a higher purchase price than comparable gas vehicles, which insurers translate directly into higher comprehensive and collision exposure.
- Proprietary parts and limited aftermarket competition. Many EV manufacturers — Tesla being the most cited example, alongside Rivian and Lucid — rely on proprietary components with no aftermarket alternative, keeping repair costs elevated and uncompetitive.
- Specialized labor scarcity. EV repairs require technicians trained on high-voltage systems and advanced driver-assistance technology; the limited pool of qualified shops reduces price competition on labor.
- Sensor and ADAS recalibration costs. A minor collision can cost roughly twice as much to repair on some EVs compared to an equivalent gas vehicle, due to the sensor recalibration required after even minor bodywork.
Battery Replacement: The Core Financial Risk
The battery pack is the single most consequential cost variable in EV ownership economics. Replacement costs in 2026 range from approximately $4,000 to $22,000 depending on the vehicle and pack size, and this single component typically represents 30% to 40% of a vehicle’s total value — a concentration of risk that has no real analog in combustion-engine vehicles, where no single component approaches that share of total vehicle value.
This concentration explains why insurers price EV comprehensive and collision coverage more conservatively: a covered loss involving battery damage exposes the insurer to a claim that can represent a third or more of the vehicle’s insured value in a single event.
Battery Risk Exposure Framework
A useful way to frame the uninsured risk gap for financing and insurance planning:
Annual Uninsured Risk = Battery Replacement Cost ÷ Remaining Warranty Years
Example: a $16,000 battery replacement cost against 4 remaining warranty years implies $4,000 in annual uninsured risk exposure once the manufacturer warranty lapses — a figure that should directly inform decisions around extended mechanical breakdown insurance (MBI) and battery-specific coverage riders.
What Standard Policies Actually Cover
Standard auto policies generally cover EV battery damage caused by a covered event — collision, fire, vandalism, or storm damage — under standard collision or comprehensive coverage, minus the policy deductible. However, normal battery wear and gradual capacity degradation are typically excluded from auto insurance entirely and fall instead under the manufacturer’s warranty or an extended service plan — a gap that becomes financially material as vehicles age past the typical 8-year/100,000-mile battery warranty window common across the industry.
Total Cost of Ownership: Running the Numbers
| Cost Category | EV (2026 average) | Gas Vehicle (2026 average) |
|---|---|---|
| Average new vehicle price | $55,300 | ~$48,768 |
| Average annual maintenance | ~$949 | ~$1,279 |
| Average monthly insurance premium | ~$263 | ~$185 |
| Battery/engine catastrophic replacement risk | $4,000–$22,000 (30–40% of vehicle value) | Comparatively lower, more distributed |
Even accounting for roughly $1,850–$2,800 in annual net advantage that some EV-focused ownership models calculate once fuel savings, amortized tax incentives, and maintenance savings are weighed against the insurance premium gap, the insurance line item alone can erase a meaningful share of the EV’s headline savings case for buyers who do not shop insurance carefully.
Financing and Insurance Strategies for 2026 EV Buyers
- Shop EV-specific insurance discounts explicitly. Green-vehicle or EV-specific rate reductions exist at many carriers but are frequently not advertised — buyers should ask directly rather than assume a standard quote reflects the best available EV rate.
- Evaluate usage-based/telematics insurance. EV owners with shorter commutes and predominantly home charging are strong candidates for pay-per-mile or telematics-based policies, which can meaningfully offset the base-rate premium gap.
- Model mechanical breakdown insurance against the battery risk formula above. For most EVs on the market in 2026, the annual uninsured risk from a post-warranty battery failure exceeds ten times the cost of a typical MBI premium — a favorable risk-transfer trade for most buyers.
- Weigh used EV pricing carefully. With used EV pricing now only about $1,334 above comparable used gas vehicles, the total-cost-of-ownership case for used EVs has improved meaningfully relative to new EVs, where the price premium remains over $6,500.
Frequently Asked Questions
Are EVs cheaper to maintain than gas cars in 2026?
Yes for routine maintenance — EVs save owners roughly $330 per year on average by eliminating oil changes and other combustion-specific servicing — but this saving is frequently offset by higher insurance premiums.
Why is EV insurance more expensive than gas car insurance?
EV insurance runs 15–42% higher due to higher vehicle replacement values, expensive proprietary battery and sensor components, limited aftermarket parts competition, and a smaller pool of specialized repair technicians.
How much does an EV battery replacement cost in 2026?
Battery replacement costs range from approximately $4,000 to $22,000 depending on the vehicle and battery pack size, typically representing 30–40% of the vehicle’s total value.
Conclusion
The EV total-cost-of-ownership picture in 2026 is more nuanced than either enthusiasts or skeptics typically present: the maintenance-savings case remains genuinely true, but it is a smaller number than most buyers expect, while the insurance cost gap — driven overwhelmingly by battery economics — has grown into a comparably sized, and in some cases larger, financial factor. Buyers, financing professionals, and insurers evaluating EVs in 2026 need a total-cost model that weighs both sides of this ledger explicitly, rather than relying on the maintenance-savings narrative alone.
Discover more from The Economy
Subscribe to get the latest posts sent to your email.
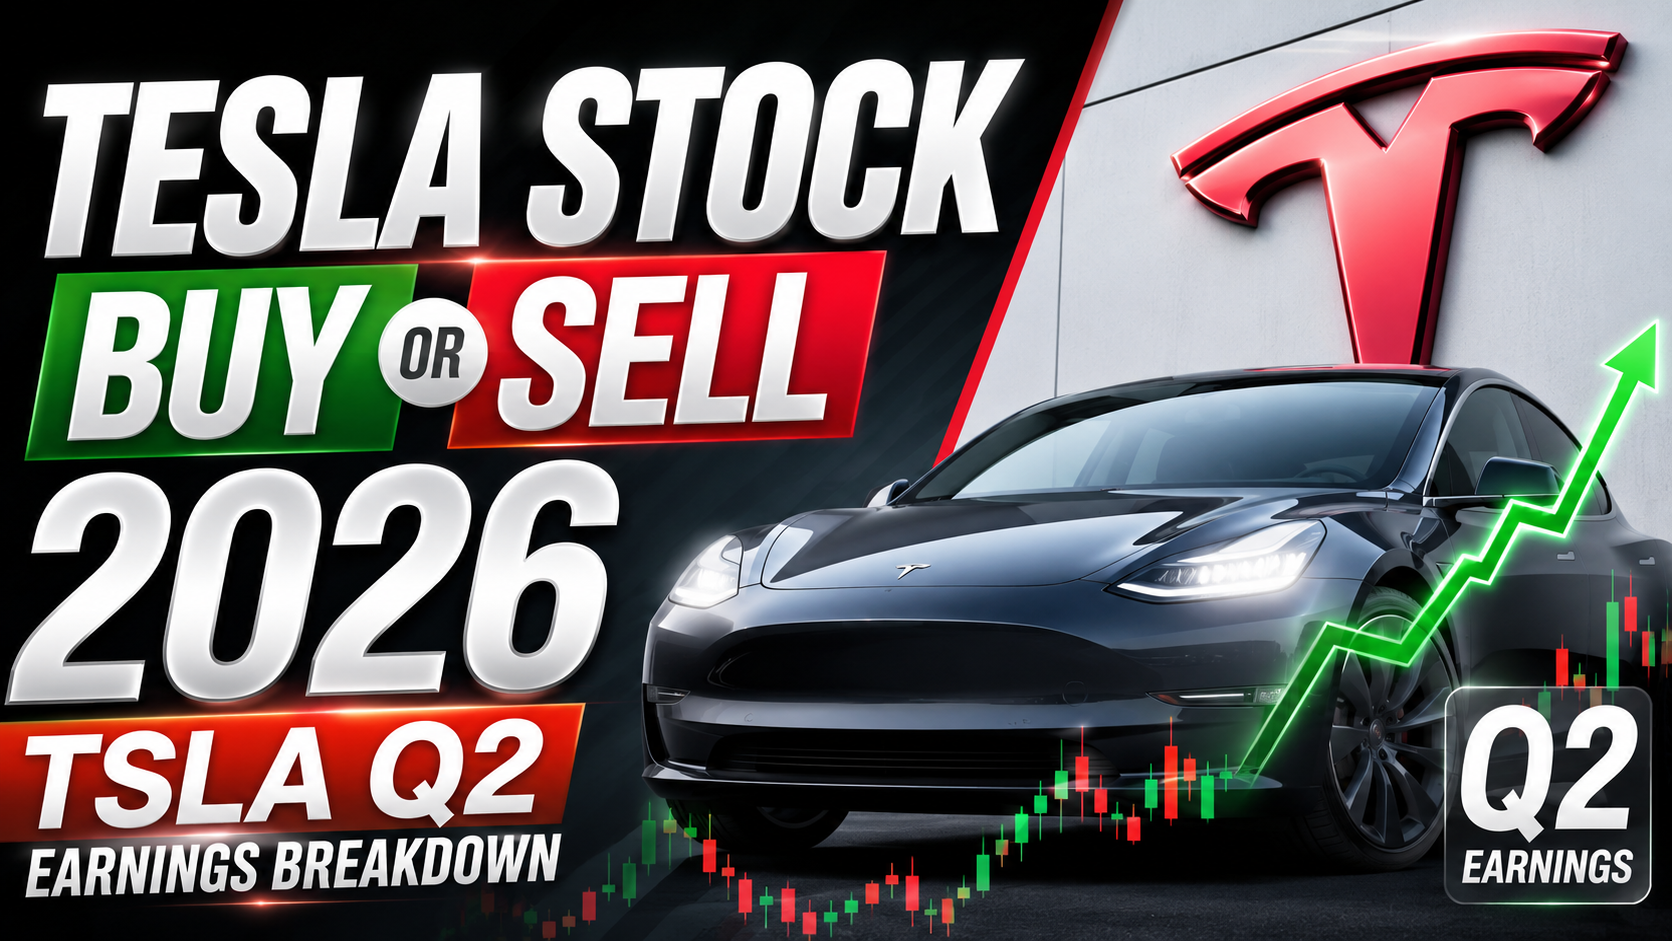
Tesla posted record Q2 2026 revenue of $28.24 billion — beating consensus estimates by roughly 7–10% — while operating margin collapsed to just 1.4% from 4.1% a year earlier and free cash flow turned negative, a split result that has left analysts divided on whether TSLA is a car company absorbing an AI investment binge or an AI company that happens to still sell cars.
The Headline Numbers: A Beat and a Miss in the Same Report
Tesla’s second-quarter 2026 results, released July 22, delivered a genuine top-line surprise alongside a clear profitability disappointment:
- Revenue: $28.24 billion, beating the consensus estimate of roughly $25.5–26.4 billion by 6.8–10.5%, and pushing trailing-twelve-month revenue above $100 billion for the first time in company history.
- Adjusted EPS: $0.33, missing consensus estimates that ranged from $0.49 to $0.54 depending on the source — a shortfall of 32–38%.
- Deliveries: A record 480,126 vehicles, up 25% year-over-year.
- Operating margin: Fell to 1.4% from 4.1% a year earlier, with operating income down approximately 57% year-over-year to $398 million.
- Automotive gross margin: 16.3%, excluding regulatory credits.
- Free cash flow: Negative $1.09 billion for the quarter.
- Operating expenses: Climbed 47% year-over-year to $4.35 billion, driven largely by AI, robotics, and manufacturing investment.
CFO Vaibhav Taneja guided full-year 2026 capital expenditures to exceed $25 billion, with further growth expected over the following two to three years — a scale of spending that explains most of the margin compression investors are reacting to.
Understanding Tesla as Three Separate Businesses
One widely cited framework for interpreting Tesla’s earnings volatility treats the company as three distinct businesses running on different timelines, each of which needs to be evaluated separately rather than blended into a single “TSLA earnings” narrative:
The Auto Clock ticks every quarter and is about deliveries, pricing, and per-vehicle margins — the segment most exposed to the loss of the U.S. federal EV tax credit and intensifying Chinese competition eating into unit economics.
The Energy Clock also reports quarterly but receives far less attention despite arguably stronger underlying economics; energy storage deployments reached 13.5 GWh in Q2 2026, and the Services and Energy segment posted record profitability and margin for the quarter.
The Robot Clock — covering Robotaxi and Optimus — doesn’t operate on a quarterly cadence at all, and is the segment driving most of the bull case and most of the valuation debate, since its economics remain largely speculative rather than reported.
Robotaxi: Genuine Progress, Genuine Scale Gap
Tesla’s Robotaxi service expanded meaningfully during the quarter, launching in three additional Florida cities — Miami, Orlando, and Tampa — bringing the service to seven major U.S. metros in total, including Austin, Dallas, and Houston. Cumulative unsupervised Robotaxi miles exceeded 380,000 across two states with what VP of AI Ashok Elluswamy described as zero notable safety incidents, and cumulative paid Robotaxi miles grew from minimal levels in mid-2025 to approximately 2.25 million miles by June 2026.
However, the scale gap versus established competitors remains stark. One analysis noted Tesla’s entire Texas Robotaxi fleet numbered around 42 vehicles, compared to Waymo’s 577 registered vehicles in the same state — and Waymo already delivers roughly 500,000 paid rides per week across ten U.S. cities. The comparison matters because it separates geographic footprint (where Tesla’s map coverage looks broad) from actual operating capacity (where the fleet remains small relative to leading competitors). Tesla also faces a newly approved competitor in Amazon’s Zoox, which received federal approval to deploy vehicles lacking a steering wheel or pedal controls entirely — a regulatory milestone Tesla’s own Cybercab has not yet reached, with the company proceeding cautiously given the reputational risk of any high-profile accident.
FSD Adoption Is Accelerating Faster Than the Headline Numbers Suggest
Full Self-Driving (Supervised) — Tesla’s driver-assistance product that still requires a human ready to steer or brake at all times — showed strong underlying momentum. Active FSD subscriptions rose 56% year-over-year to 1.48 million total subscribers, and in North America approximately 55% of Q2 deliveries had an FSD subscription enabled at time of delivery. CEO Elon Musk characterized this trend on the earnings call by noting that for a meaningful share of buyers, “they’re actually buying Tesla Full Self-Driving with a car attached, as opposed to a car” — a framing that underscores how central software monetization has become to Tesla’s long-term margin story, even as the underlying auto business absorbs near-term pricing pressure.
Valuation: The Bull Case Requires Believing in the Robot Clock
By early August 2026, TSLA traded in the $320s–$330s, well off its 52-week high of $498.83 and closer to (though still above) its 52-week low of $297.38. At that price range, some analysts pegged the stock at roughly 360 times trailing earnings — an extraordinarily high multiple by conventional valuation standards that only makes sense if a substantial share of the current price reflects expected future value from Robotaxi and Optimus, rather than the auto business’s current 1.4% operating margin.
| Segment | Current State (Q2 2026) | Investment Thesis Implication |
|---|---|---|
| Auto | 480,126 deliveries, 16.3% gross margin ex-credits, pricing pressure from EV credit loss and China competition | Near-term earnings driver, currently under margin pressure |
| Energy | 13.5 GWh deployed, record segment profitability | Underappreciated, steadily growing profit contributor |
| Robotaxi/Optimus | 7 metros live, ~2.25M cumulative paid miles, fleet scale far behind Waymo | Long-duration bet; largely unpriced by current fundamentals, core to bull valuation case |
The Investment Decision Framework
For investors weighing whether TSLA is a buy or sell heading into the back half of 2026, the decision essentially reduces to a single question: how much weight should be placed on the Robot Clock relative to the Auto Clock? Investors bullish on Tesla’s autonomous-driving and robotics ambitions can point to genuine operational progress — expanding Robotaxi coverage, rapidly growing FSD subscriptions, and heavy AI infrastructure investment funded by a still-massive auto and energy revenue base. Skeptics point to compressed near-term margins, negative free cash flow, a fleet scale still far behind established robotaxi competitors, and a valuation multiple that assumes years of future execution most companies never achieve on schedule.
Key Takeaways
- Tesla’s Q2 2026 revenue of $28.24 billion beat estimates, but adjusted EPS of $0.33 missed consensus by roughly a third, and operating margin fell to 1.4% from 4.1% a year earlier.
- Heavy AI, robotics, and manufacturing capex (guided above $25 billion for full-year 2026) is the primary driver of margin compression and negative free cash flow.
- Robotaxi expanded to seven U.S. metros with 380,000+ unsupervised miles, but Tesla’s fleet scale remains far smaller than Waymo’s in comparable markets.
- FSD subscriptions rose 56% year-over-year to 1.48 million, with roughly 55% of North American Q2 deliveries including an active FSD subscription.
- TSLA’s valuation, near 360x trailing earnings in early August 2026, depends heavily on investors’ confidence in the long-term autonomous vehicle and robotics business rather than current auto margins.
Frequently Asked Questions
Why did Tesla stock react negatively to a revenue beat?
Because profitability metrics — adjusted EPS, operating margin, and free cash flow — all missed expectations or turned negative, overshadowing the top-line beat and record delivery numbers.
How big is Tesla’s Robotaxi business compared to Waymo?
Tesla’s Robotaxi fleet remains significantly smaller; one analysis found roughly 42 vehicles in Texas compared to Waymo’s 577 registered vehicles in the same state, with Waymo delivering about 500,000 weekly paid rides across ten cities.
Is Tesla’s high valuation justified?
It depends on whether an investor believes Tesla’s Robotaxi and Optimus robotics businesses will scale successfully; at roughly 360x trailing earnings, the stock’s valuation is difficult to justify based on current auto and energy segment profitability alone.
Discover more from The Economy
Subscribe to get the latest posts sent to your email.

Balance of Payments (BOP)

The Falkland Islands Dispute: Sovereign Wealth, Offshore Drilling, and Market Impacts

Gross Domestic Product (GDP): Nominal vs. Real

What is Inflation and the Consumer Price Index (CPI)?

US-China Trade Competition 2026: Supply Chain Relocation Guide

Oil Prices Break $100 in 2026: Middle East Conflict & Energy Markets

South-South Trade Expansion: Digital Integration and Emerging Market Growth

$166B Tariff Refund Tapering Fast: Is Your Business Missing Out?

Stock Market Today: Dow Climbs 500 Points as Markets Shake Off Inflation Jitters

14th WTO Conference 2026: Tariffs & Global Supply Chain Impact

Swish Secures $24M Funding to Disrupt India’s $100B Food Market

Physical AI and Driverless Tech: The Next Trillion-Dollar Industrial Revolution

Enterprise AI Platforms Disrupting B2B SaaS in 2026: Full Analysis

Crypto vs. Safe Haven Assets 2026: Where Institutions Are Hedging

State Farm’s $5B Dividend 2026: Who Qualifies & Payout Dates

US-China Relations in Q3 2026: Trade Tariffs and Supply Chain Risks

Gold’s Wild 2026: From a Record $5,600 Peak to a 24% Crash and Back Toward $4,500

Oil Surges as Strait of Hormuz Traffic Collapses Again

The Rocket That Won’t Quit: Inside SpaceX’s Falcon 9 Launch Machine

Bank of England Set to Hold Rates Through Year-End, Reuters Poll Shows

SpaceX Starship Flight 14: First Orbital Attempt & Starlink V3 Launch Explained

The 2026 Crypto Regulatory Shift: What It Means for Institutional Investors

AI Chip Stocks 2026: The Best Semiconductor Investments Beyond Marvell

Retail Earnings Week: What Home Depot, Target & Walmart Reveal

AI-Powered Training: The Next Multi-Billion Dollar Ecosystem in Fitness

Russia’s Black Sea Oil Exports Fall for a Fifth Straight Week

Global Chip Selloff Deepens: What’s Driving the Aug. 19 Semiconductor Rout

Tween Back-to-School Trends 2026: What’s Driving the $85B Season
-

 Markets & Finance8 months ago
Top 15 Stocks for Investment in 2026 in PSX: Your Complete Guide to Pakistan’s Best Investment Opportunities
-

 Analysis7 months ago
Johor’s Investment Boom: The Hidden Costs Behind Malaysia’s Most Ambitious Economic Surge
-

 Analysis7 months ago
Top 10 Stocks for Investment in PSX for Quick Returns in 2026
-

 Analysis7 months ago
Brazil’s Rare Earth Race: US, EU, and China Compete for Critical Minerals as Tensions Rise
-

 Banks8 months ago
Best Investments in Pakistan 2026: Top 10 Low-Price Shares and Long-Term Picks for the PSX
-

 Investment8 months ago
Top 10 Mutual Fund Managers in Pakistan for Investment in 2026: A Comprehensive Guide for Optimal Returns
-

 Global Economy9 months ago
15 Most Lucrative Sectors for Investment in Pakistan: A 2025 Data-Driven Analysis
-

 Global Economy9 months ago
Pakistan’s Export Goldmine: 10 Game-Changing Markets Where Pakistani Businesses Are Winning Big in 2025