
Opinion
Are America’s Tariffs Here to Stay? One Year Into Trump’s Second Term
One year into President Donald Trump’s second term, the landscape of global trade has undergone a profound transformation. The United States, long the steward of the post-1945 liberal economic order, has pivoted decisively toward a protectionist stance. Tariffs—once deployed selectively—have become a central instrument of economic statecraft, applied broadly to adversaries and allies alike. Average effective tariff rates have risen to levels not seen in over a century, generating substantial federal revenue while prompting retaliatory measures, supply-chain reconfiguration, and heightened geopolitical friction.
Policymakers, researchers, and think tank analysts now confront a pivotal question: are Trump tariffs permanent, or do they represent negotiable leverage that could recede with shifting political or economic pressures? As of mid-January 2026, the evidence points toward entrenchment, though important caveats remain.
Are America’s Tariffs Here to Stay? A Preliminary Assessment
The short answer is yes, in substantial part—with meaningful qualifications. Indicators strongly suggest that many of Trump’s second-term tariffs are likely to endure beyond the current administration:
- Fiscal entrenchment — Tariff revenue has emerged as a significant budgetary resource, with collections exceeding $133 billion under IEEPA-based measures alone through late 2025 .
- Bipartisan acceptance of China-specific measures — Restrictions on Chinese imports enjoy broad support across the U.S. political spectrum and are increasingly viewed as permanent features of national security policy .
- Legal and institutional path dependence — Once imposed under executive authorities like the International Emergency Economic Powers Act (IEEPA), tariffs create domestic constituencies—protected industries and revenue-dependent programs—that resist rollback .
- Geopolitical recalibration — The tariffs signal a lasting shift toward “America First” realism, prioritizing bilateral deals over multilateral rules .
Countervailing risks include ongoing Supreme Court litigation over IEEPA’s scope . What’s striking is how quickly tariffs have moved from campaign rhetoric to structural reality.

The Evolution of Tariffs in Trump’s Second Term
Trump’s second-term trade policy builds on—but dramatically expands—first-term actions. Where Section 301 and Section 232 authorities dominated previously, the administration has leaned heavily on IEEPA to justify sweeping measures .
Legal Foundations and IEEPA Expansion
In early 2025, President Trump invoked IEEPA to declare national emergencies tied to trade deficits, fentanyl inflows, and unfair practices, enabling broad tariff implementation .
Key Tariff Actions by Country and Issue
The administration has calibrated tariffs variably:
| Trading Partner/Issue | Initial Rate (2025) | Current Rate (Jan 2026) | Rationale & Status |
|---|---|---|---|
| China | Up to 60-145% on many goods | High rates persist with some adjustments | National security, fentanyl, trade practices; partial deals in place |
| Canada & Mexico | 25% on select goods | Largely moderated after negotiations | Migration and fentanyl; most trade under USMCA exemptions |
| European Union | Reciprocal + additional layers | Reduced in some sectors post-talks | Trade imbalances |
| Countries trading with Iran | 25% additional | Active secondary measures | Pressure on Iran |
| Global baseline | 10-20% universal/reciprocal | Partial exemptions remain | Persistent deficits |
These actions reflect a strategic blend of punishment and leverage .
Economic Impacts: Revenue Gains Versus Broader Costs
The most immediate outcome has been revenue. Customs duties have reached historic highs, with projections of sustained hundreds of billions annually .
Revenue Projections (Selected Estimates)
Yet costs are nontrivial. Economists note higher consumer prices and regressive impacts .
Geopolitical Consequences: Reshaping Alliances and Global Order
The tariffs have accelerated fragmentation of the rules-based system. Allies are diversifying ties, while adversaries adapt .
The Iran-related secondary tariffs exemplify broader economic coercion .
Key Indicators of Permanence
Several factors favor longevity:
- Revenue dependence — Hard to forgo sustained fiscal inflows .
- National security framing — Especially versus China .
- Domestic winners — Protected sectors investing in capacity .
- Precedent — Fallback authorities beyond IEEPA .
Potential Counterforces and Risks
Challenges include Supreme Court review .
Implications for the Global Economic Order
Permanent elevated tariffs would cement fragmentation, with higher costs and bifurcated chains .
Policy Recommendations for Stakeholders
- U.S. policymakers — Complement tariffs with industrial incentives.
- Allied governments — Accelerate diversification .
- Corporations — Build resilience.
- Researchers — Study long-term distributional and comparative effects.
In conclusion, while adjustments are likely, the core of Trump’s second-term tariffs appears structurally entrenched. This economic nationalism offers fiscal and strategic payoffs—but substantial risks. Navigating it will shape global governance for decades.
References
Brookings Institution. (n.d.). Back to the brink: North American trade in the 2nd Trump administration. https://www.brookings.edu/articles/back-to-the-brink-north-american-trade-in-the-2nd-trump-administration
Brookings Institution. (n.d.). Key takeaways on Trump’s reciprocal tariffs from recent Brookings event. https://www.brookings.edu/articles/key-takeaways-on-trumps-reciprocal-tariffs-from-recent-brookings-event
Brookings Institution. (n.d.). Recent tariffs threaten residential construction. https://www.brookings.edu/articles/recent-tariffs-threaten-residential-construction
Brookings Institution. (n.d.). Tariffs are a particularly bad way to raise revenue. https://www.brookings.edu/articles/tariffs-are-a-particularly-bad-way-raise-revenue
Brookings Institution. (n.d.). Trump’s 25% tariffs on Canada and Mexico will be a blow to all 3 economies. https://www.brookings.edu/articles/trumps-25-tariffs-on-canada-and-mexico-will-be-a-blow-to-all-3-economies
Council on Foreign Relations. (n.d.). National security costs of Trump’s tariffs. https://www.cfr.org/article/national-security-costs-trumps-tariffs
Council on Foreign Relations. (n.d.). Tariffs on trading partners: What can the president actually do? https://www.cfr.org/report/tariffs-trading-partners-can-president-actually-do
Council on Foreign Relations. (n.d.). Trade trends to watch 2026. https://www.cfr.org/article/trade-trends-watch-2026
Council on Foreign Relations. (n.d.). Trump imposes new Iran tariffs. https://www.cfr.org/article/trump-imposes-new-iran-tariffs
Council on Foreign Relations. (n.d.). Trump’s new tariff announcements. https://www.cfr.org/article/trumps-new-tariff-announcements
Foreign Affairs. (n.d.). America needs economic warriors. https://www.foreignaffairs.com/united-states/america-needs-economic-warriors
Foreign Affairs. (n.d.). The case for a grand bargain between America and China. https://www.foreignaffairs.com/united-states/case-grand-bargain-between-america-and-china
Foreign Affairs. (n.d.). How Europe lost. https://www.foreignaffairs.com/united-states/how-europe-lost-matthijs-tocci
Foreign Affairs. (n.d.). How multilateralism can survive. https://www.foreignaffairs.com/south-america/how-multilateralism-can-survive
Foreign Affairs. (n.d.). The new supply chain insecurity. https://www.foreignaffairs.com/united-states/new-supply-chain-insecurity-shannon-oneil
Reuters. (2026, January 6). U.S. tariffs that are at risk of court-ordered refunds exceed $133.5 billion. https://www.reuters.com/world/us/us-tariffs-that-are-risk-court-ordered-refunds-exceed-1335-billion-2026-01-06
Reuters. (2026, January 8). Importers brace for $150 billion tariff refund fight if Trump loses Supreme Court. https://www.reuters.com/legal/government/importers-brace-150-billion-tariff-refund-fight-if-trump-loses-supreme-court-2026-01-08
Reuters. (2026, January 8). Market risk mounts as Supreme Court weighs Trump’s emergency tariff powers. https://www.reuters.com/legal/government/market-risk-mounts-supreme-court-weighs-trumps-emergency-tariff-powers-2026-01-08
Tax Foundation. (n.d.). IEEPA tariff revenue, Trump, debt, economy. https://taxfoundation.org/blog/ieepa-tariff-revenue-trump-debt-economy
Tax Foundation. (n.d.). Trump tariffs revenue estimates. https://taxfoundation.org/blog/trump-tariffs-revenue-estimates
Tax Foundation. (n.d.). Trump tariffs: The economic impact of the Trump trade war. https://taxfoundation.org/research/all/federal/trump-tariffs-trade-war
Tax Foundation. (n.d.). Universal tariff revenue estimates. https://taxfoundation.org/research/all/federal/universal-tariff-revenue-estimates
The Economist. (2025, November 12). America is going through a big economic experiment. https://www.economist.com/the-world-ahead/2025/11/12/america-is-going-through-a-big-economic-experiment
The Economist. (2025, November 12). Global trade will continue but will become more complex. https://www.economist.com/the-world-ahead/2025/11/12/global-trade-will-continue-but-will-become-more-complex
The Economist. (2026, January 6). America’s missing manufacturing renaissance. https://www.economist.com/finance-and-economics/2026/01/06/americas-missing-manufacturing-renaissance
The Economist. (2026, January 8). Do not mistake a resilient global economy for populist success. https://www.economist.com/leaders/2026/01/08/do-not-mistake-a-resilient-global-economy-for-populist-success
The Economist. (n.d.). Are America’s tariffs here to stay? https://www.economist.com/insider/inside-geopolitics/are-americas-tariffs-here-to-stay
The New York Times. (2026, January 3). Trump tariffs prices impact. https://www.nytimes.com/2026/01/03/business/economy/trump-tariffs-prices-impact.html
The New York Times. (2026, January 13). China trade surplus exports. https://www.nytimes.com/2026/01/13/business/china-trade-surplus-exports.html
The New York Times. (2026, January 13). Trump Iran tariffs trade. https://www.nytimes.com/2026/01/13/world/middleeast/trump-iran-tariffs-trade.html
The New York Times. (2026, January 14). Trump tariffs economists. https://www.nytimes.com/2026/01/14/us/politics/trump-tariffs-economists.html
The Wall Street Journal. (n.d.). Trump predicts strong economic growth in 2026 during speech in Detroit. https://www.wsj.com/politics/policy/trump-predicts-strong-economic-growth-in-2026-during-speech-in-detroit-71a5a19d
The Wall Street Journal. (n.d.). What to know about Trump’s latest tariff policy moves. https://www.wsj.com/economy/trade/what-to-know-about-trumps-latest-tariff-policy-moves-8d9f8b37
BBC News. (n.d.). Article on Trump tariffs and global trade. https://www.bbc.com/news/articles/cwynx4rerpzo
BBC News. (n.d.). Article on Trump tariffs economic effects. https://www.bbc.com/news/articles/czejp3gep63o
Discover more from The Economy
Subscribe to get the latest posts sent to your email.


Pakistan’s finance minister Mohammad Aurangzeb presented a budget of Rs 18.77 trillion to the National Assembly on June 12, 2026 with claims that it was a people friendly budget . While the Motorcycle-rickshaw drivers in Sohrab Goth, Karachi, a few kilometers distant, were doing more straightforward math: petrol was now priced at Rs 377.81 per litre, up from Rs 266.17 prior to February, against prices that hadn’t changed in four months. Pakistan’s inflation crisis, lit by a war 1,800 kilometres to the west, had already cost commuters and small traders more than any tax bracket Aurangzeb was about to unveil.
The headline numbers explain the mood.
The data from Pakistan Bureau of Statistics shows that the consumer prices increased 11.7% year over year in May 2026, the highest level since June 2024. Inflation was only 3.5% in the same month last year. Geopolitics is a vast ocean removed from the immediate cause. The war that ensued after the United States and Israel attacked Iranian military and nuclear-related targets on February 28, 2026, closed the Strait of Hormuz to the majority of tanker traffic and sent Brent crude above $100 a barrel for the first time in over three years. With Tehran retaliating against Gulf states and US Central Command attacking Iranian sites on June 11, merchants were preparing for a protracted period of grinding uncertainty rather than a swift conclusion. For an economy that imports nearly all of its crude, the arithmetic was brutal and immediate.
Pakistan’s inflation crisis is, at its core, an energy crisis wearing a grocery bill. Petrol stood at Rs 266.17 a litre on February 1, 2026. By March 7, the government had raised it by Rs 55 in a single notification — the largest one-off increase on record — taking it to Rs 321.17. Three weeks later, with Brent trading above $115 a barrel and the Strait of Hormuz effectively closed, petrol jumped a further 42.7% to Rs 458.40 a litre and diesel rose 54.9% to Rs 520.35, the steepest two-month run-up the country has recorded. Petroleum Minister Ali Pervaiz Malik said at the time that with no resolution to the war in sight, the government could no longer sustain a blanket subsidy.
Five fortnightly cuts followed as Brent eased back from its peak, but the relief has been partial. Petrol and diesel remain roughly 40% above their February 1 baseline even after those reductions. LPG, the cylinder fuel that millions of households use for cooking where piped gas doesn’t reach, sits at Rs 308.76 per kilogram — every adjustment here lands directly on a family’s stove.
The knock-on effect runs through the entire consumption basket. Pakistan’s freight fleet runs almost entirely on diesel, so every increase at the pump arrives a second time at the vegetable stall, the flour mill and the cement yard. In May 2026, the Sensitive Price Indicator, which measures the weekly cost of necessities for lower-income households, increased 12% year over year. This is quicker than the headline CPI and indicates that the burden is falling most heavily on those with the least capacity to absorb it. In response to the deteriorating data, the State Bank’s Monetary Policy Committee raised its policy rate by 100 basis points to 11.50% in April. This was a hawkish indication that the rate reduction that had provided borrowers with some respite during the preceding two years are now off the table for the foreseeable future.Three years ago, in FY2023, headline inflation reached 30.77%; this spike is smaller in percentage terms but is landing on a price level that had already climbed sharply since then, leaving real incomes nowhere close to recovery.
Budget 2026-27 and Pakistan’s Salaried Class: Relief on Paper, Pressure in Practice
Inflation is running high because a war-driven oil shock hit an economy with almost no fiscal cushion. The US-Israel-Iran conflict pushed global energy prices sharply higher just as Pakistan’s IMF programme required it to pass those costs straight through to consumers via fuel, electricity and gas tariffs, with no room for new subsidies under a primary-surplus target.
On paper, the Rs 18.77 trillion budget Aurangzeb presented does try to soften the blow for one group. The salaried class, whose members paid Rs 605 billion in income tax during FY2024–2025—a 55% year-over-year increase driven solely by withholding that provides no opportunity to conceal income—gets four updated slabs and the elimination of the 9% surcharge that had been imposed on higher earnings. The rate decreases from 23% to 20% for those who earn between Rs 2.2 million and Rs 3.2 million per year, and from 30% to 25% for those who earn between Rs 3.2 million and Rs 4.1 million. The minimum wage increases by 10% to Rs 40,700 per month, while government salaries and pensions increase by 7%.
Set against an FBR revenue target of Rs 15.267 trillion — roughly Rs 1.84 trillion, or 14%, higher than the revised FY26 collection — the relief looks smaller. That gap has to be closed somewhere, and general sales tax applies whether a household earns Rs 40,700 or Rs 4 million a month. Meanwhile, the same budget abolished super tax entirely for businesses with annual sales between Rs 15 crore and Rs 50 crore, and cut the rate from 10% to 8% for firms above that threshold — relief that, unlike the salaried class’s slab adjustments, applies regardless of how the broader cost-of-living squeeze plays out at the till.
The energy side compounds the squeeze rather than offsetting it. As part of the same IMF Extended Fund Facility review, Islamabad has assured the Fund that electricity and gas tariffs will keep rising for all but “protected” consumers, with quarterly tariff adjustments and monthly fuel-charge revisions continuing without delay. NEPRA had already layered an additional Rs 3.82-per-unit surcharge onto bills between March and June 2026 — nearly nine times the Rs 0.43 surcharge it replaced — and a further increase to the basic tariff is scheduled for January 2027. The Central Power Purchasing Agency, meanwhile, has recommended a national power-purchase price for FY27 of between Rs 25.69 and Rs 26.69 per unit, a figure that flows almost directly into household bills if NEPRA approves it. Pakistan’s circular debt — the gap between what distribution companies bill and what they actually collect — had already crossed Rs 2.7 trillion before this round of adjustments, and the programme’s preferred fix runs through tariffs rather than through the theft, line losses and collection failures that built the debt in the first place.
The squeeze isn’t confined to fuel and food. Budget 2026-27 layers a new Environmental Levy onto vehicles above 2,000cc — 10% for engines between 2001cc and 3000cc, and 19.5% beyond that — alongside a Federal Excise Duty revision that pushes the Toyota Corolla’s top variant toward Rs 8 million. Electric vehicles were supposed to be the escape route. Instead, with exemptions under the Automotive Industry Development and Export Policy 2021-26 expiring on June 30, imported EVs face sales tax of up to 25%, even as locally assembled units retain a narrower concession — a distinction that means little to a buyer choosing between a used Civic and an EV that, for most households, remains aspirational.
Smartphones tell a similar story. A proposal to cut the PTA’s regulatory duty on premium imported phones from 25% to 18% — championed publicly by IT Minister Shaza Fatima Khawaja, who raised placards on the floor of the National Assembly — was dropped from the final budget after pushback from domestic assembly plants. The total effective tax burden on a $700 smartphone in Pakistan now exceeds 50%, among the highest of any market in the region.
Then there’s solar, the one technology that let households partially opt out of an unreliable and expensive grid. Budget 2026-27 proposes an 18% general sales tax on imported solar panels, reversing years of exemptions that had driven a boom in rooftop installations. The timing compounds an earlier blow: in February 2026, NEPRA replaced unit-for-unit net metering with “net billing,” cutting the buy-back rate for surplus solar power from roughly Rs 26-27 per unit to Rs 10-11, and adding a Rs 1,000-per-kilowatt connection fee for new on-grid systems. For middle-class families who borrowed to install panels specifically to escape Karachi’s Rs 65-per-unit K-Electric tariff and routine 12-hour load-shedding, the rules changed after the investment was already made.
The contrast with the region sharpens the picture. Between February and May 2026, Pakistan’s petrol price rose 64%, even as India kept retail fuel prices frozen and cut its own fuel duties — slashing the petrol levy from Rs 13 to Rs 3 per litre and scrapping the diesel duty altogether — while Bangladesh limited itself to a single roughly 16% increase in April before freezing rates again. Of Pakistan’s immediate neighbours, none absorbed the shock as directly as Islamabad did.
Against that backdrop, the growth numbers look modest. The government’s own FY27 target is 4% GDP growth, itself a step down from the 4.2% goal set for the year now ending — a target the economy missed, expanding by 3.7% instead. The Asian Development Bank projects 4.5% growth for FY27, but notes that downside risks remain significant — language that, with an active regional war still unresolved, may understate the exposure.
The government’s defence rests on a genuine turnaround. The State Bank’s policy rate decreased from 22.5% to 11% over about two years; foreign exchange reserves surpassed $17 billion, up nearly 50% year over year; Pakistan reported a primary surplus equal to 3.2% of GDP in the first three quarters of FY26; and inflation, which peaked near 38% in 2023, had dropped to single digits prior to this year’s shock. throughout the budget presentation, Prime Minister Shehbaz Sharif thanked the public for their patience throughout years of high prices while bluntly acknowledging the cost and informing his cabinet that the new measures will bring challenges and hardship for the average person.
That acknowledgement is precisely what critics seize on. As one analysis weighing the budget against the preceding Economic Survey put it, stabilisation does not equate to development, it merely removes an impediment. Economists note that much of FY26’s fiscal improvement came from a one-off Rs 2,428 billion profit transfer from the State Bank, not from a broadened tax base — meaning the structural problem persists even as headline numbers improve. Salaried workers are taxed at source down to the rupee, while large segments of retail, wholesale and real-estate income remain lightly documented. Indirect taxes such as GST apply uniformly regardless of income, which means a rupee of relief in the withholding tables can be erased many times over by a single increase in the price of flour, fuel or electricity. For the motorcycle-rickshaw drivers of Sohrab Goth, the distinction between cyclical stabilisation and structural reform is academic. What they know is that the fare hasn’t moved and the pump price has.
Pakistan’s 2026 numbers support two honest readings at once. The macro story — reserves rebuilt, a primary surplus posted, a regional war absorbed without a balance-of-payments crisis — is real, and represents progress that looked close to impossible only a few years ago. The household story — an 11.7% inflation print, a fuel bill still roughly 40% above its February baseline, electricity surcharges layered on by IMF design, and now a solar tax that closes off one of the few workarounds millions of families had found — is equally real. The honest path forward runs through the parts of the economy this budget left largely untouched: a tax base still anchored to salaried withholding and indirect levies while retail and property income stay lightly taxed, and an energy sector where “cost recovery” has so far meant recovery from consumers rather than from the circular debt, line losses and IPP arrears that created the bill in the first place. Until that changes, every fiscal year risks becoming an exercise in grinding flour that was already ground.
Discover more from The Economy
Subscribe to get the latest posts sent to your email.
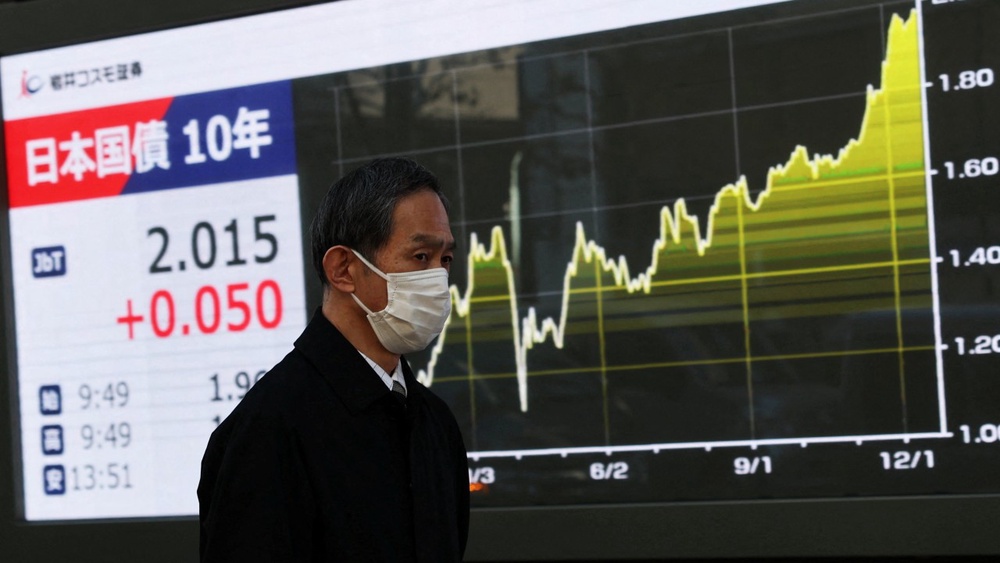
The Bank of Japan has raised its benchmark policy rate to 1%, the highest level since September 1995, in a decision that marks one of the most consequential shifts in global monetary policy in a generation. The move — a 25-basis-point increase from 0.75% — was approved by a 7–1 vote at the conclusion of the central bank’s two-day policy meeting on Tuesday. It was not a surprise. Markets had priced in the hike with near-certainty for weeks. What made it historic was everything surrounding it: a governor absent from his own boardroom, a Middle East energy shock feeding Japan’s worst inflation in years, and the unmistakable signal that the era of essentially free money in the world’s fourth-largest economy is over.
To understand what 1% means for Japan, you have to understand what came before it. For most of the past three decades, the Bank of Japan was fighting a different enemy: deflation. Consumer prices stagnated, wages barely moved, and the central bank responded by holding interest rates at or near zero — and eventually below — for years at a stretch. The BOJ became the last major central bank still practicing the monetary policy of the post-2008 crisis era long after the Federal Reserve, the European Central Bank, and the Bank of England had tightened aggressively.
That era formally ended in March 2024, when the BOJ exited negative interest rates for the first time in eight years. Tuesday’s decision to push rates to 1% is the fifth hike in that normalisation cycle. The Bank of Japan’s policy statement noted that underlying inflation could accelerate above its 2% target amid rising energy costs — a marked change in tone from the cautious, conditional language that had characterised earlier communications.
Japan’s producer prices rose 6.3% year-on-year in May, driven almost entirely by energy costs, according to data cited by Reuters and Bloomberg. That figure — the fastest pace in more than three years — gave the board little room to wait.
The vote was 7–1. Board member Toichiro Asada dissented, arguing that downside risks to production and employment outweighed the upside risks to prices — a minority view that nonetheless reflects a genuine tension within the institution about the pace of tightening.
The decision itself was almost overshadowed by its circumstances. Governor Kazuo Ueda, 74, was hospitalised on June 10 with an infected liver cyst and missed the meeting entirely — the first time in his tenure that he has been absent from a policy decision. Deputy Governor Ryozo Himino chaired the meeting in his place, while Deputy Governor Shinichi Uchida conducted the post-decision press conference. Ueda, working remotely from hospital, expressed his policy stance through a written statement but did not vote.
The symbolism was not lost on markets. The BOJ’s most significant tightening decision in 31 years was delivered without its chief architect in the room. Yet the institutional machinery held: there was no confusion about the outcome, no disorderly communication. Takeshi Minami, chief economist at Norinchukin Research Institute, had said ahead of the meeting that “Ueda’s health issue will not affect monetary policy execution. The rate decision itself is already largely determined.”
He was right. The yen strengthened marginally to 160.22 against the dollar after the announcement. The Nikkei 225 edged up 0.46%. Yields on 10-year Japanese Government Bonds climbed 3 basis points to 2.615%. The reaction was measured — the market had already done its digesting.
Still, the forward guidance question remains open. Mari Iwashita, executive rates strategist at Nomura Securities, told Reuters that the BOJ may avoid sending clear signals on the future rate path given uncertainty around Ueda’s recovery timeline. “It’s also becoming more unclear on whether the BOJ would hike again this year,” she said.
The BOJ confirmed it will continue reducing its monthly bond purchases by ¥200 billion per quarter, with a plan to stabilise purchases at approximately ¥2 trillion per month from April 2027.
Why the BOJ Raised Rates to 1%: The Analytical Layer
What is actually driving Japanese inflation right now?
The short answer is energy, and the mechanism behind it is the yen. Japan imports virtually all of its energy. When the yen is weak — as it has been, trading around 160 to the dollar — import costs rise in yen terms, even if global commodity prices hold steady. The ongoing conflict in the Middle East, and its effect on oil markets via the Strait of Hormuz, has compounded this by pushing energy prices higher in dollar terms as well. The result is a double whammy: higher prices in the currency that Japan pays for goods, and higher prices for the goods themselves.
H3: Why did the Bank of Japan raise rates to 1%?
The Bank of Japan raised rates to 1% in June 2026 to prevent war-driven energy inflation from embedding in broader consumer prices. With producer prices up 6.3% year-on-year in May and the yen weakening past 160 per dollar, policymakers judged that the cost of waiting outweighed the risk of tightening into a fragile recovery.
That 40-word answer captures the mechanism. But the picture is more complicated than a simple inflation-fighting move. The BOJ is simultaneously managing the yen’s structural weakness, running down a bloated balance sheet accumulated through years of bond purchases, and trying not to rattle global financial markets that have borrowed heavily in yen.
A higher policy rate does several things at once: it narrows the interest rate differential that makes yen-funded carry trades attractive; it signals that the BOJ is no longer behind the curve; and it offers some support to yen-denominated household purchasing power at a moment when rising import costs are squeezing consumers.
The board’s own language was pointed. It warned that underlying inflation “could accelerate above 2%” — a phrase that, for an institution historically reluctant to make conditional projections, carries real weight.
What 1% Means for Markets and Households
The most closely watched downstream consequence of this decision is the yen carry trade. For decades, investors borrowed cheaply in yen, converted the proceeds into higher-yielding currencies or assets, and pocketed the difference. The trade became a structural feature of global capital markets — a quiet subsidy to risk appetite funded by Japanese monetary policy.
As rates rise, the arithmetic of that trade deteriorates. In August 2024, a previous BOJ rate hike triggered a partial unwind that sent ripples through global equities and crypto markets. That episode — brief but brutal — is fresh in the memory of institutional risk desks. With yen short positions reportedly at multi-year extremes, another disorderly unwind remains a tail risk.
Yet Tuesday’s reaction suggested markets are managing the transition more smoothly this time. The Nikkei rose rather than fell. The yen strengthened only modestly. That relative calm reflects the degree to which the hike was telegraphed — market-implied probability exceeded 99% ahead of the decision — and the fact that the BOJ has been careful to sequence tightening gradually.
For Japanese households and small businesses, the picture is mixed. Borrowers — particularly those with variable-rate mortgages — will face higher monthly payments. The Japan Times has reported that household energy bill subsidies from the government have so far cushioned consumers from the worst of the energy-driven price rises, but those buffers have limits.
For savers, the direction of travel is welcome, if belated. Japanese depositors have endured decades of near-zero returns. A 1% policy rate won’t transform savings economics overnight, but it marks the beginning of a structural normalisation that, if sustained, eventually flows through to deposit rates.
The bond market deserves close attention. Ten-year JGB yields hit 2.8% in May — the highest since 1996, according to Bloomberg — before easing slightly. The BOJ’s continued tapering of bond purchases means it is gradually withdrawing a buyer that had, at its peak, been absorbing roughly ¥6 trillion per month. As that support fades, yields may continue to drift higher, with consequences for Japan’s government debt servicing costs and the global fixed income landscape.
What the Dissenters Argue
It would be a mistake to read Tuesday’s vote as a moment of institutional unanimity. Toichiro Asada’s dissent was not mere procedural notation — it reflects a serious argument about the risks of tightening into an uncertain global environment.
Japan’s economic recovery remains uneven. Real wages, while recovering, have not kept pace with inflation — meaning that higher interest rates risk squeezing consumption at precisely the moment households are already under pressure from rising import costs. Asada’s position, that downside risks to production and employment are greater than upside inflation risks, echoes a concern shared by some external economists: that the BOJ may be importing a hawkish consensus from Western central banks into an economy that still has distinct vulnerabilities.
There is also the question of what happens if the global picture deteriorates. The US-Iran ceasefire and the Strait of Hormuz reopening have, as of this writing, eased some of the most acute energy market pressures. If geopolitical conditions improve and oil prices fall, Japan’s inflation impetus could soften faster than the BOJ’s current projections suggest — leaving the bank having hiked into a disinflationary turn.
The IMF, in its April 2026 World Economic Outlook, cautioned that central banks should avoid premature tightening in economies where the inflation impulse is primarily supply-side and external. Japan fits that description more closely than most. The argument is not that 1% is wrong, but that the pace of subsequent moves must be calibrated with care.
That said, the counterargument is powerful. Real interest rates in Japan remain deeply negative — which means policy is still, by most measures, highly accommodative. The BOJ is not slamming on the brakes; it is easing off the accelerator.
A Turning Point Thirty Years in the Making
For most of the past three decades, Japan was the world’s monetary anomaly — the country where money was essentially free, where the central bank bought bonds to suppress yields, where the yen served as a global funding currency precisely because borrowing in it cost almost nothing. That structure shaped not just Japanese finance but global capital markets in ways that are difficult to fully map.
Tuesday’s decision will not unwind all of that overnight. A policy rate of 1% still leaves Japan far behind the interest rate levels seen elsewhere, and the normalisation path forward remains genuinely uncertain — shaped by Governor Ueda’s recovery, the trajectory of Middle East tensions, and whether the inflation that has finally arrived in Japan proves as durable as policymakers now appear to believe.
What is clear is that the direction has changed. For the first time since 1995, the Bank of Japan is raising rates above 1%. The architecture of global monetary policy — built on the assumption of Japanese cheapness — is being quietly, persistently, and consequentially dismantled.
Discover more from The Economy
Subscribe to get the latest posts sent to your email.

The era of the verbose central banker may be nearing its end, if a growing faction of monetary conservatives has its way. For the better part of two decades, the Federal Reserve has operated under a simple, seemingly unassailable premise: more transparency equals less market volatility. The institution transitioned from the cryptic briefcase-watching days of the Alan Greenspan era to a modern regime of dot plots, forward guidance, and post-meeting press conferences that parse every syllable of economic data. Yet, former Federal Reserve governor Kevin Warsh has emerged as the loudest voice calling for a radical reversal. His prescription for the central bank is startling in its simplicity. He wants them to stop explaining everything.
What follows, however, is not a call for renewed secrecy, but a structural critique of how monetary policy transparency has inadvertently cornered the world’s most powerful financial institution. Since the 2008 financial crisis, the volume of central bank communication has exploded. The average length of an FOMC post-meeting statement grew from roughly 130 words in 1999 to over 800 words by the early 2020s, a symptom of an institution desperately trying to script the future. Warsh, currently a visiting fellow at the Hoover Institution, argues that this hyper-communication has transformed the Fed from a reactive stabiliser into an anxious market manager. By pre-committing to future policy paths through extensive forward guidance, the central bank has severely limited its own optionality when macroeconomic conditions inevitably change.
The core of the argument surrounding Kevin Warsh Fed communication reforms rests on the idea that the central bank has become a prisoner of its own forward guidance. In the post-Bernanke era, the Federal Reserve adopted the philosophy that explaining future policy intentions would smooth out market reactions and anchor yield curves. Warsh contends this approach has fundamentally backfired. Instead of calming markets, hyper-transparency has created a brittle financial system highly reactive to minor shifts in the Fed’s linguistic tone.
When the Fed attempts to narrate the economic future, it invites Wall Street to trade the narrative rather than the underlying economic reality. Warsh has repeatedly warned that central banks are not omniscient forecasting agencies. When policymakers issue detailed dot plots projecting interest rates three years into the future, they project a false certainty. If inflation spikes or employment drops unexpectedly, the Fed is forced into a humiliating retreat, damaging its institutional credibility. A report by the Bank for International Settlements recently highlighted that over-reliance on forward guidance during periods of high inflation actually delayed necessary policy tightening, as central banks hesitated to break their own public promises.
By retreating from the microphone, Warsh suggests the Federal Reserve can reclaim its tactical flexibility. If markets are given less explicit guidance, they must revert to doing their own price discovery based on incoming data, rather than waiting to be spoon-fed by Jerome Powell. This forces market participants to price in risk more accurately. The current regime, Warsh argues, acts as a psychological subsidy to financial markets, encouraging risk-taking because traders believe the Fed has broadcast its entire playbook in advance.
To understand the mechanics of this critique, one must examine the specific tools the Fed uses to broadcast its intentions. The most controversial is the Summary of Economic Projections, colloquially known as the dot plot. Introduced in 2012, the dot plot was designed to provide a visual representation of where each FOMC member expects interest rates to be in the coming years. Warsh views the dot plot not as a tool of clarity, but as an engine of confusion that central bank forward guidance relies on too heavily.
What is forward guidance in monetary policy? Forward guidance is a communication tool used by central banks to signal the future path of interest rates to the public and financial markets. By clearly stating their long-term policy intentions, central banks aim to influence current financial conditions, lower long-term borrowing costs, and stimulate or cool economic activity.
When 19 different Fed officials publish 19 different interest rate trajectories, the result is often chaotic. Markets fixate on the median dot, treating it as a blood oath rather than a fleeting estimate. If a single official alters their projection, the median shifts, triggering billions of dollars in algorithmic trading volume. This creates a feedback loop where the Fed is constantly managing market reactions to its own theoretical forecasts. According to research published by the International Monetary Fund, central bank communications that provide excessively narrow path projections often result in higher bond market volatility when those paths inevitably change.
Warsh’s proposed alternative is a return to an older, quieter style of central banking. The Fed should state what it is doing today, provide a brief rationale based on current data, and remain largely silent on what it might do six months from now. This approach acknowledges the inherent unpredictability of the global macroeconomy. It shifts the burden of forecasting back to private markets, where it belongs. The Federal Reserve, in this model, speaks through its actions—its rate adjustments and balance sheet mechanics—rather than its press releases.
If the Federal Reserve were to adopt this doctrine of strategic silence, the immediate downstream consequence would be a structural repricing of risk across global markets. For the past 15 years, a vast ecosystem of analysts, commentators, and algorithmic trading models has been built entirely around parsing Fed rhetoric. A sudden reduction in central bank forward guidance would strip away the guardrails that equity and bond markets have come to rely on.
In the short term, this shift would almost certainly spike the VIX and drive up bond yields, as investors demand a higher premium for the uncertainty of an unscripted Fed. Traders would no longer have the luxury of perfectly timed rate cut expectations. Instead, they would be forced to closely monitor real-time economic indicators—wage growth, supply chain bottlenecks, and capital expenditure trends—to anticipate monetary policy adjustments. This represents a return to fundamental investing. As noted by The Economist in a recent briefing, stripping away the Fed’s vocal safety net could ultimately create a more resilient financial system, one less prone to the speculative bubbles that form when borrowing costs are transparently guaranteed.
For policymakers, adopting Warsh’s approach would require immense institutional discipline. Central bankers are naturally inclined to manage expectations. Stepping back to the podium and saying less during a crisis runs contrary to modern political instincts. Yet, for businesses and citizens, a quieter Fed might actually be a more effective one. When the central bank constantly shifts its rhetoric to manage daily market sentiment, it risks losing the public’s trust. A Fed that speaks rarely, but acts decisively, projects a far greater sense of authority than one that issues a 3,000-word justification for every 25-basis-point move.
The push for a quieter Federal Reserve is not without its fierce detractors. Many prominent economists and former policymakers argue that retreating from the current communication framework would be a catastrophic step backward. The modern era of monetary policy transparency was hard-won, largely driven by Ben Bernanke’s desire to democratise the institution and prevent the kind of market panic that occurs when investors are caught entirely off guard.
Defenders of the status quo argue that forward guidance is not just a communication strategy; it is an active monetary policy tool. When short-term interest rates hit zero, as they did after 2008 and again in 2020, the Fed’s only remaining lever to stimulate the economy was the promise to keep rates low for a prolonged period. Abandoning this tool deprives the central bank of crucial ammunition during a severe downturn. A working paper from the Brookings Institution defends the dot plot, noting that while it is imperfect, it successfully lowers long-term bond yields during crises by anchoring public expectations.
Furthermore, critics of Warsh note that financial markets are vastly more complex and interconnected today than they were in the 1990s. The idea that markets will efficiently discover prices without central bank guidance ignores the reality of modern algorithmic trading, which can trigger cascading liquidity crises in the absence of clear institutional signals. From this perspective, the Fed’s verbose explanations are a necessary public utility, preventing systemic shocks by ensuring all market participants have equal access to the central bank’s baseline assumptions.
The debate over the Federal Reserve’s communication strategy is ultimately a debate about the limits of economic forecasting and institutional humility. Warsh’s critique cuts to the heart of a modern technocratic fallacy: the belief that if you simply explain a complex system in enough detail, you can control its outcome. The reality of the past few years—marked by transitory inflation narratives that proved dramatically wrong—suggests that excessive transparency can sometimes resemble institutional hubris.
By pre-committing to future actions, the Fed has traded long-term credibility for short-term market placation. Whether the institution will willingly surrender the microphone remains to be seen. But the argument for doing so is gaining traction among those who remember a time when central banks commanded respect not by forecasting the future, but by acting decisively when the future arrived. Silence, in the realm of central banking, may soon be a premium asset.
Discover more from The Economy
Subscribe to get the latest posts sent to your email.

Goldman Sachs: “The Circulatory System Is Not Working”

Why the U.S. Budget Airline Model Is Running Out of Runway

China’s Oil Shock Absorber: How Beijing Kept Crude Prices Half of What Analysts Predicted

CRH Nears Biggest-Ever Deal to Acquire Arcosa

U.S. Inflation at a Three-Year High: How the Iran War Turned an Economic Recovery Into a Stagflation Risk

IPO Summer 2026: Anthropic, OpenAI, and the Race to Price Artificial Intelligence on Public Markets

Strait of Hormuz Crisis 2026: How a Waterway War Broke Global Oil Markets

Kevin Warsh’s Fed Debut: Rate Hikes Now on the Table as U.S. Monetary Policy Enters a New Era

SpaceX IPO 2026: Inside the $85.7 Billion Listing That Made Elon Musk the World’s First Trillionaire

PSX KSE-100 Up 500+ Points: The Geopolitical Impact on Stocks

Did Anthropic Talk Its Way Into an AI Export Ban?

Big Bonuses for South Korea’s Chip Workers Put Central Bank on Inflation Alert

Easing Iran Tensions Push Mortgage Rates Lower — But a Potential Fed Hike Clouds the Outlook

Paramount’s $111 Billion Warner Bros. Discovery Merger Clears DOJ, But Faces New Hurdles

China Overhauls the World’s Biggest Surveillance Network with Advanced AI

How AI Is Forcing McKinsey and Its Peers to Rethink Pricing

SpaceX IPO: Inside the $2 Trillion Market Debut

KPMG Australia CEO Resigns After Whistleblower Claims Exposed Investigation Failures

PwC China Partner Payouts Cut Amid Evergrande Audit Fraud

Broadcom Market Value Loss: Revenue Forecast Disappoints

The Guardrails Are Down: How Meta and Google’s AI Models Fold Under Pressure

Pakistan Budget FY 2026-27: Relief, Prospects, and the Tightrope Walk

Benefitbay Raises $18M to Build the Plumbing for America’s ICHRA Shift

Nasdaq Tumbles 4% as Chip and Memory Stocks Sink: A $1.2 Trillion Wipeout

Here’s How Much It’ll Cost You to Be Part of SpaceX’s Record-Breaking $75 Billion IPO

Japanese Mid-Sized Firms Flock to Southeast Asia for Growth

Singapore Puts a Clock on Wealth: MAS Orders Banks to Halve Account-Opening Times

Can Exxon Build the World’s Biggest Carbon Capture Business?
-

 Markets & Finance6 months ago
Top 15 Stocks for Investment in 2026 in PSX: Your Complete Guide to Pakistan’s Best Investment Opportunities
-

 Analysis4 months ago
Top 10 Stocks for Investment in PSX for Quick Returns in 2026
-

 Analysis5 months ago
Brazil’s Rare Earth Race: US, EU, and China Compete for Critical Minerals as Tensions Rise
-

 Analysis4 months ago
Johor’s Investment Boom: The Hidden Costs Behind Malaysia’s Most Ambitious Economic Surge
-

 Banks5 months ago
Best Investments in Pakistan 2026: Top 10 Low-Price Shares and Long-Term Picks for the PSX
-

 Investment5 months ago
Top 10 Mutual Fund Managers in Pakistan for Investment in 2026: A Comprehensive Guide for Optimal Returns
-

 Global Economy6 months ago
15 Most Lucrative Sectors for Investment in Pakistan: A 2025 Data-Driven Analysis
-

 Global Economy6 months ago
Pakistan’s Export Goldmine: 10 Game-Changing Markets Where Pakistani Businesses Are Winning Big in 2025