
Global Economy
Unlocking the Future of IT Exports: AI Surge as the Blueprint for Economic Growth
Introduction
The global economy is at a crossroads. Traditional growth engines—manufacturing, agriculture, and extractive industries—are struggling to keep pace with the demands of a hyper-connected world. Meanwhile, the digital economy has emerged as the most dynamic frontier, reshaping trade flows, labor markets, and national competitiveness. For developing nations, the stakes are particularly high: either embrace digital transformation or risk being left behind in a rapidly evolving global order.
At the heart of this transformation lies Artificial Intelligence (AI). Once confined to research labs and niche applications, AI has now entered the mainstream. Tools like Google Gemini and AI Studio are no longer curiosities for tech enthusiasts; they are becoming everyday instruments for productivity, creativity, and commerce. This surge in adoption is not merely a technological trend—it is an economic revolution in motion.
The thesis of this article is bold yet urgent: AI adoption is the single most potent, overlooked policy lever for transforming national economies, bridging trade deficits, and creating globally competitive IT export powerhouses. If policymakers act decisively, AI can become the cornerstone of export-led growth, particularly in developing nations where the future of IT exports could redefine economic destiny.
But this transformation will not happen automatically. It requires a policy roadmap for AI adoption in SMEs, infrastructure reform, and a deliberate strategy to bridge the digital divide in developing economies. Without these interventions, the promise of AI risks being squandered, leaving nations trapped in cycles of underdevelopment.
The AI Surge: From Silicon Valley to the National Economy
The Tipping Point of Tools
The story of AI’s rise is not just about algorithms—it is about accessibility. For decades, AI was the preserve of elite institutions and tech giants. Today, however, platforms like Google Gemini and AI Studio have democratized access. A freelance designer in Karachi, a small business in Nairobi, or a startup in Dhaka can now harness AI for tasks ranging from content creation to predictive analytics.
This tipping point of tools matters profoundly for economic policy. Why? Because mass adoption transforms AI from a niche innovation into a general-purpose technology—akin to electricity or the internet. When electricity became widespread, it powered factories, homes, and offices, catalyzing industrial revolutions. Similarly, AI’s mainstreaming is poised to catalyze a digital transformation vs. traditional economic growth debate.
Consider the following examples:
- Google Gemini enables real-time language translation, bridging communication gaps for export-oriented firms.
- AI Studio allows SMEs to automate marketing campaigns, reducing costs and expanding reach.
- Freelancers leveraging AI tools can deliver services at global standards, contributing to the freelance economy’s role in boosting national revenue.
For policymakers, the lesson is clear: AI is not just about innovation—it is about economic productivity. By leveraging Google Gemini for economic productivity, nations can unlock efficiencies that ripple across industries, from IT exports to agriculture supply chains.
The Policy Blueprint for Export Revenue: $10 Billion and Beyond
If AI adoption is the lever, policy is the fulcrum. Without deliberate intervention, the potential of AI will remain underutilized. To translate adoption into export revenue, governments must craft a policy blueprint that aligns incentives, infrastructure, and regulation.
Here are the critical pillars of such a blueprint:
- Tax Incentives for AI-driven firms: Offer tax breaks to SMEs and startups that integrate AI into their operations, encouraging rapid adoption.
- Regulatory Sandboxes: Create controlled environments where firms can experiment with AI applications without fear of punitive regulation.
- Digital Infrastructure Investment: Prioritize broadband expansion, cloud computing facilities, and reliable energy grids to support AI scalability.
- Export Promotion Programs: Establish dedicated funds to help firms market AI-enabled services abroad, positioning them as competitive players in global IT markets.
- Human Capital Development: Launch AI-focused training programs to equip workers with skills that match global demand.
The future of IT exports in developing nations hinges on these interventions. Imagine a scenario where a country like Pakistan or Bangladesh channels AI adoption into IT services exports. With the right blueprint, export revenues could surge past $10 billion annually, bridging trade deficits and strengthening foreign reserves.
This is not speculative optimism—it is grounded in precedent. Nations that invested in digital infrastructure and policy alignment (e.g., Estonia, Singapore) transformed themselves into IT export hubs. Developing nations can replicate this trajectory by treating AI adoption as a national economic strategy, not just a technological experiment.
“
Unlocking the SME Engine: AI’s Humanized Impact on the Ground
While policymakers debate macroeconomic strategies, the real transformation happens at the grassroots. Small and Medium Enterprises (SMEs) are the forgotten backbone of most economies, contributing up to 60% of employment and nearly 40% of GDP in many developing nations. Yet SMEs often struggle with limited resources, outdated practices, and restricted access to global markets.
Here is where AI becomes a humanized disruptor. By integrating AI tools, SMEs can achieve operational efficiency at a fraction of the cost. Consider the following impacts:
- Operational Efficiency: AI-powered inventory management reduces waste and optimizes supply chains.
- Marketing Automation: Tools like AI Studio allow SMEs to run targeted campaigns, reaching customers beyond local boundaries.
- Financial Inclusion: AI-driven fintech platforms provide SMEs with access to microcredit and digital payments, bridging liquidity gaps.
- Global Reach: AI-enabled translation and content creation empower SMEs to market products internationally, contributing to IT exports.
This is the policy roadmap for AI adoption in SMEs:
- Provide subsidies for AI tool subscriptions.
- Establish AI training hubs in industrial clusters.
- Facilitate partnerships between SMEs and global tech firms.
- Ensure affordable cloud access for small businesses.
The impact is not abstract—it is deeply human. A textile SME in Lahore using AI to predict fashion trends can compete with global brands. A farmer cooperative in Kenya using AI for crop yield predictions can access export markets. These stories illustrate how AI adoption is not just about numbers—it is about empowering people and communities.
The Digital Chasm: Analyzing Constraints and Mitigating Risks
No transformation is without challenges. The promise of AI is immense, but so are the risks. Developing nations face a digital chasm that must be bridged to sustain growth.
Key constraints include:
- Data Privacy Concerns: Without robust frameworks, AI adoption risks exposing sensitive information.
- Energy Costs: AI infrastructure is energy-intensive, posing challenges for nations with unstable grids.
- Infrastructure Stability: Broadband gaps and unreliable connectivity hinder scalability.
- Skill Gaps: Human capital development lags behind technological progress, creating mismatches in labor markets.
To address these, policymakers must prioritize sustaining IT sector growth through infrastructure reform. Concrete strategies include:
- Data Governance Frameworks: Establish national data protection laws aligned with global standards.
- Green Energy Integration: Invest in renewable energy to power AI infrastructure sustainably.
- Public-Private Partnerships: Collaborate with telecom firms to expand broadband access.
- Skill Development Programs: Launch AI literacy campaigns and vocational training to close the skill gap.
The digital transformation vs. traditional economic growth debate is not about choosing one over the other—it is about integration. Traditional sectors can be revitalized through AI, while digital sectors can drive exports. The challenge is to ensure inclusivity, so that bridging the digital divide in developing economies becomes a reality, not a slogan.
Conclusion
The surge of AI adoption is not a passing trend—it is the defining economic lever of our time. Tools like Google Gemini and AI Studio symbolize a broader shift: from niche innovation to mainstream productivity. For developing nations, this shift offers a once-in-a-generation opportunity to bridge trade deficits, boost IT exports, and create globally competitive economies.
But opportunity without action is wasted potential. Policymakers must craft a policy blueprint, empower SMEs, and reform infrastructure to sustain growth. The freelance economy’s role in boosting national revenue must be recognized, and the digital divide must be bridged.
The call to action is clear: act now, or risk being left behind. AI adoption is not just about technology—it is about national destiny. Developing nations that seize this lever will not only survive the digital age—they will thrive, becoming IT export powerhouses in a global economy hungry for innovation.
Discover more from The Economy
Subscribe to get the latest posts sent to your email.


In the autumn of 1956, British Prime Minister Anthony Eden received a phone call that ended an empire. The military operation in Egypt had succeeded. The Suez Canal was under Anglo-French control. And Washington told London to stop.
The United States, alarmed by Soviet threats of intervention and unwilling to see its Cold War allies destabilize the Middle East, forced Britain and France to withdraw. Within a decade, the British Empire was in managed retreat. The pound sterling—for over a century the world’s reserve currency—began its long slide. It took thirty years for the cycle to complete: George Soros finally drove the final stake through the Bank of England in 1992.
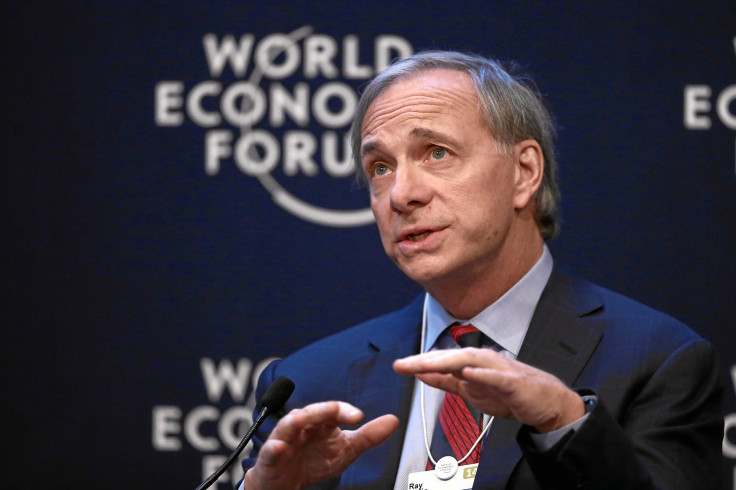
Ray Dalio did not write that history as a lesson about Britain. He wrote it as a warning about the United States in March 2026. And this week, Fortune published his most comprehensive articulation yet of why he believes America has just lived through its own version of that afternoon.
The Hormuz Parallel
The Bridgewater Associates founder has spent decades mapping what he calls the Big Debt Cycle—the rise and fall of reserve-currency empires over five centuries of financial history. The pattern, he argues, is consistent across cases: a dominant power overextends militarily over a critical trade route, suffers a loss of geopolitical face despite tactical success, and watches allies and creditors quietly recalibrate their confidence.
The 2026 U.S.-led bombing campaign against Iran fits that template, Dalio contends. The strikes degraded Iranian military capacity but did not topple the regime. The Strait of Hormuz—through which roughly a fifth of the world’s daily oil supply moves—was disrupted for weeks, sending energy prices surging and triggering a global inflation shock. Negotiations produced a stalemate rather than a decisive resolution.
“It all comes down to who controls the Strait of Hormuz,” Dalio wrote on X. The motivational asymmetry, he argued, was stark: for Iran’s leadership, the conflict was existential. For American voters, it was gas prices and midterm politics.
The Debt Foundation Is Already Cracked
What makes Dalio’s warning more than historical analogy is the fiscal backdrop against which the Hormuz crisis played out. U.S. federal debt crossed $39 trillion on March 18, 2026, with the latest trillion accumulating in record time—driven by tax reductions that eroded revenues and war expenditures that accelerated spending. All three major credit ratings agencies have now downgraded U.S. sovereign debt: S&P in 2011, Fitch in 2023, and Moody’s in May 2025.
The dollar’s share of global foreign exchange reserves has fallen to 56.9%, its lowest level since 1995 and down from a peak of 72% in 2001. Capital and technology spending by the top five U.S. mega-cap technology companies now represent roughly 30% of the entire S&P 500—a concentration of financial weight last seen half a century ago.
NVIDIA alone has surpassed a $5 trillion market capitalization, making it worth more than the entire GDP of most nations. Microsoft, Alphabet, Amazon, and Meta are projected to spend between $660 billion and $700 billion on AI infrastructure in 2026 alone. Dalio sees this as a dangerous divergence: financial markets increasingly levitating above an economy where households are under acute pressure, real wages have declined because of energy shock, and consumption—which accounts for 67% of U.S. GDP—faces structural headwinds.
The Dollar Isn’t Collapsing—Yet
Dalio is careful about what he is and is not claiming. Britain’s sterling did not collapse at Suez. It bled for three decades before the final break. The dollar today is still, as Wall Street analysts say, the “cleanest dirty shirt” in the global monetary wardrobe. No alternative reserve currency exists at anything close to the scale that would be required to replace it.
But the trajectory, Dalio argues, is what matters—not the current position. He draws a direct structural comparison: allies stopped deferring to London after Suez; creditors quietly reassessed British debt; the currency’s global role eroded steadily even as the British economy remained functional and respected. The analogy, he acknowledges, has limits. He frames this as contingent possibility, not inevitability.
Asian leaders Dalio has spoken with recently—he described spending a month in Asia, including ten days in China, in early 2026—have reached a collective conclusion that the U.S. can no longer credibly project military force across multiple theaters simultaneously. “It’s clear that the United States cannot fight a war,” he told Bloomberg Television in early June, citing public unwillingness to absorb casualties. He flagged Taiwan as the most acute potential flashpoint, noting that Beijing could trigger a global market crash by signaling a semiconductor blockade without firing a single shot.
What to Watch—and What to Hold
Dalio is not prescribing specific trades, but the historical pattern points in a consistent direction. In prior empire-transition periods, the indicators to monitor are: allies and creditors losing confidence, erosion of reserve currency status, selling of sovereign debt assets, and currency weakness—especially against gold.
Gold has already tracked that roadmap. Prices surged approximately 60% in the twelve months through March 2026. Goldman Sachs has revised its year-end 2026 gold price target to $4,900 per troy ounce—down from an earlier $5,400 forecast, reflecting the expectation that the Fed will not cut rates this year—but remains constructive on the long-term outlook.
“People don’t have, typically, an adequate amount of gold in their portfolio,” Dalio told CNBC in a February 2025 interview. “When bad times come, gold is a very effective diversifier.”
Dalio has identified the window between the 2026 U.S. midterm elections and the 2028 presidential election as a period of particular vulnerability, when debt pressures and intensifying political conflict over taxes and spending will converge. The outcome is not predetermined. Empires do extend their lives through what Dalio calls “life-extending” measures: prudent debt management, inflation control, and national unity. But with U.S. interest payments alone projected to exceed $1 trillion annually, those measures feel increasingly aspirational.
Discover more from The Economy
Subscribe to get the latest posts sent to your email.
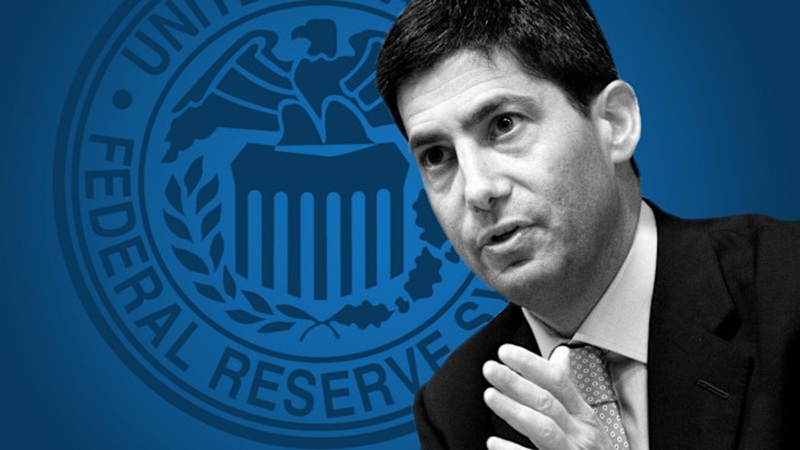
New Fed Chair Kevin Warsh surprised markets with a hawkish stance at his first FOMC press conference. Here’s how his rate-hike signals are rippling through stocks, bonds, mortgages, and gold. The Federal Reserve’s first policy meeting under new Chair Kevin Warsh sent shockwaves through global financial markets on June 17, 2026—not because policymakers moved rates, but because of what nine of them signaled they might do next.
Warsh, appointed by President Trump after months of public attacks on his predecessor Jerome Powell, arrived in Washington carrying expectations of a dovish turn. He had championed rate reductions while angling for the chairmanship, and the White House broadly supported looser monetary conditions. What markets got instead was a coldly hawkish institution that spent the better part of two hours dismantling those assumptions in real time.
The Meeting That Changed the Calculus
The Federal Open Market Committee held the federal funds rate unchanged at its existing range, but nine of 18 committee members penciled in at least one rate hike before year-end in the central bank’s updated Summary of Economic Projections—the dot plot. Six of those nine indicated support for two quarter-point increases. The shift represented a dramatic departure from the March projections, in which no policymaker had envisioned a hike, and the committee as a whole had forecast one cut.
The Dow Jones Industrial Average fell 507 points, or 0.98%, in the session. The S&P 500 lost 1.21% and the Nasdaq Composite dropped 1.34%. Two-year Treasury yields—the instrument most sensitive to near-term rate expectations—jumped 16 basis points to 4.21%, their highest reading in more than a year. Traders scrambled to reprice Fed futures, with CME FedWatch data showing the probability of a September hike jumping to 49% from 27% the previous session.
Warsh’s Statement Was Deliberately Brief—and Deliberately Alarming
The published FOMC statement was unusually short. Warsh stripped language that had previously signaled the Fed’s next move would be a cut and replaced it with a blunt acknowledgment that inflation remains “elevated”—a legacy partly of energy “supply shocks” stemming from the conflict in the Middle East.
“We’ve missed on inflation for five years and we’re going to fix that,” Warsh told reporters. “When we deliver on our price stability objectives—which we will—the American people will feel as though the hardships they’ve been living through are in the rear-view mirror.”
U.S. inflation hit 4.2%—double the Fed’s 2% target and its highest level in three years—leaving the committee little political room to stay passive. Warsh declined to submit a personal rate forecast to the dot plot, an unusual act of institutional reticence that some analysts read as an attempt to preserve maximum flexibility.
Bank of America Changes Its Forecast
Within days, Bank of America overhauled its rate outlook. Analysts at the bank predicted the Fed would raise the benchmark rate by a quarter point three times in 2026, lifting it from the current 3.5%–3.75% range to 4.25%–4.5%. The bank’s prior base case had been for rates to hold steady all year.
“The risk that they might need to raise rates has clearly risen,” said Matthew Luzzetti, chief U.S. economist at Deutsche Bank. BofA analysts acknowledged that Warsh could still be “strategically hawkish”—gaining anti-inflation credibility while actually buying time to cut later—but said the door to that interpretation was closing as incoming data showed persistent price pressure.
The hawkish turn unfolded against an unusual institutional backdrop. Warsh became the first new Fed chairman in more than 70 years to inherit an active predecessor on the governing board. Powell, whose term as chair Warsh replaced, remained as a board governor and voted at the June meeting—a fact that gives every subsequent public utterance from the former chair a level of market weight that Warsh’s team cannot easily ignore.
The Housing Market Reads a New Era
The rate signals carried immediate consequences for American homebuyers. Chen Zhao, head of economics research at Redfin, called it “a new era” and warned that mortgage rates were unlikely to retreat significantly in the near term. Bill Banfield of Rocket Mortgage noted that home sales were responding more to labor market strength than to rate movements and that determined buyers would continue entering the market—though the affordability calculus had shifted.
Vishal Garg, CEO of AI mortgage platform Better, cut to the practical point: “The Fed doesn’t set mortgage rates, but mortgage rates track long-term Treasury yields, which move based on investor expectations for inflation, growth, and the Fed’s next step.”
Warsh has separately announced five internal task forces to examine the Fed’s communication practices, data sources, and inflation-analysis frameworks—a structural reform effort that signals he intends a longer-term overhaul of the institution rather than a cosmetic change of tone.
What Comes Next
The path forward for markets hinges on three variables: whether consumer prices moderate fast enough to make hikes unnecessary, whether the labor market stays strong enough to absorb higher borrowing costs, and whether Warsh can maintain independence from a White House that publicly installed him to cut.
Kristina Hooper, chief market strategist at Man Group, summed up the market’s posture after the meeting: “Markets were holding out hope that Chair Warsh would throw them some kernels of real dovishness that they obviously felt they didn’t get.”
With BofA now projecting a rate corridor that would be the highest since 2007, and with inflation stubbornly running at twice the Fed’s target, the calculation Warsh faces is one no new Fed chair has confronted in a generation: tighten into a White House headwind or validate exactly the critics who warned his appointment was political.
Discover more from The Economy
Subscribe to get the latest posts sent to your email.

The US economy is expanding but sending mixed signals in mid-2026. Here are the four threats that could tip it into recession — and how investors and households can prepare.The US economy is, by most conventional measures, still growing. GDP expanded 1.6% in Q1 2026. The Federal Reserve Bank of Atlanta’s GDPNow model pointed to stronger second-quarter growth. The labour market has surprised three consecutive months to the upside. Goldman Sachs trimmed its recession probability estimate to just 15% following the US-Iran ceasefire agreement.
And yet something feels wrong.
Inflation sits at 4.2% year-over-year — its highest reading in three years. The Federal Reserve just delivered its most hawkish signal in years, with nine officials projecting rate hikes in 2026. Consumer spending rose just 0.1% in April, while the savings rate fell from 3.6% to 2.6%. Credit card delinquencies are rising. The AI bull market is running almost entirely on anticipation.
“The economy is literally moving at two speeds,” said David Schneider, a certified financial planner and president of Schneider Wealth Strategies. “Businesses and affluent households are stimulating growth, fuelled by AI spending and record asset prices, while the average person is increasingly anxious and financially exhausted.”
That bifurcation is not a sign of health. It is a sign of fragility.
The Four Threats That Could Tip the US Into Recession
Threat 1: Policy and Geopolitical Shocks
The Trump administration’s tariff regime — which lifted the effective tariff rate from 2.1% to an estimated 11.7% as of January 2026 — has created sustained uncertainty for businesses, consumers, and investors alike. Evidence suggests that more than 50% of these tariff costs have been passed through to consumers, adding a meaningful burden to household budgets that was not present two years ago. A 10% global baseline tariff remains in effect following the Supreme Court’s rejection of many of the more aggressive executive tariff actions.
The US-Iran war — which began on February 28 with airstrikes by the US and Israel — added an acute geopolitical shock on top of this chronic policy uncertainty. The Strait of Hormuz closure drove oil prices above $120 per barrel, fed directly into headline inflation, and complicated the Federal Reserve’s ability to normalise policy.
The 60-day ceasefire framework provides temporary relief, but a resumption of hostilities — or any new Middle East escalation — would rapidly reverse the oil price decline and reignite inflationary dynamics.
Threat 2: The Fed’s Inflation Dilemma
The Federal Reserve has tolerated inflation above its 2% target for five consecutive years. But Kevin Warsh’s debut as Fed chair in June 2026 signalled a clear shift: the Fed’s patience with above-target inflation appears to be ending.
The dilemma is acute. Raising rates aggressively to bring inflation from 4.2% to 2% risks choking off the economic growth that is sustaining employment and corporate earnings. Not raising rates risks allowing inflation expectations to become unanchored, which would ultimately require far more aggressive tightening later.
Bank of America now projects three quarter-point hikes by year-end, lifting the federal funds rate to 4.25%–4.50%. Each 25 basis point increase adds approximately $6–8 billion annually to US government debt servicing costs at current debt levels — a fiscal dynamic that compounds over time.
For households, the transmission is more direct: mortgage rates, credit card APRs, and auto loan costs all respond to the federal funds rate, directly squeezing discretionary spending.
Threat 3: Consumer Exhaustion
The American consumer has been the engine of post-pandemic growth. But that engine is increasingly sputtering.
Personal consumption expenditures rose just 0.1% in April 2026 — barely above zero. The personal savings rate fell to 2.6%, down from 3.6% the previous month — a level that implies consumers are drawing down savings to maintain spending levels. Rising delinquency rates on credit cards and auto loans suggest the pressure is not confined to lower-income households.
“Cracks beneath the surface — rising delinquencies and slowing job growth — could compound the effects on an already stressed consumer,” noted one investment strategist at a major asset manager.
High interest rates throughout 2024 and 2025 have eroded household balance sheets. Many consumers entered 2026 carrying record debt loads at elevated interest rates. Any additional shock — from higher energy costs, a job market softening, or rising borrowing costs — could trigger a spending contraction that is far harder to reverse than it was to initiate.
Threat 4: The AI Bubble
Artificial intelligence is simultaneously the most important driver of 2026 economic optimism and its most significant latent risk.
The Stanford Institute for Economic Policy Research identified AI as a central concern in its 2026 economic outlook, noting that “concerns about an artificial intelligence bubble” represent a material tail risk for the broader market. The Centre for Economic and Policy Research has gone further, launching an “AI Bubble Monitor” to track signs of speculative excess across AI-related valuations and capital deployment.
The SpaceX IPO at $2 trillion, OpenAI’s confidential S-1 filing at $1 trillion-plus, and Anthropic’s $965 billion pre-IPO valuation collectively represent approximately $3.8 trillion in market capitalisation targeting a public investor base. If AI companies prove unable to monetise their infrastructure investment at the pace their valuations require — a scenario that their current cash-flow realities make plausible — the resulting correction could cascade through technology equities, credit markets, and the broader economy in ways that are difficult to model.
The AI tail risk is not that the technology fails. It is that the business models required to justify current valuations take a decade longer to mature than current investor timelines anticipate.
What the IMF Is Saying
The International Monetary Fund revised its 2026 global growth forecast to 3.1%, down from 3.4% in 2025, in its April World Economic Outlook. The IMF framed the downgrade around three interlocking risks: the Middle East conflict, trade uncertainty, and inflationary pressure — the same factors defining the US domestic outlook.
Emerging market growth is expected to slow disproportionately, particularly in conflict-proximate economies and those with high external debt vulnerabilities. Advanced economies, including the US, are expected to see “more moderate, though still subdued” slowdowns.
Goldman Sachs, for its part, cut its US recession probability to 15% after the ceasefire agreement — a number that reflects genuine resilience in the data but leaves meaningful probability mass on the downside scenario.
Mixed Signals: Growth and Fragility Coexisting
The current US economic picture is genuinely unusual. Two opposing realities are simultaneously true:
Signs of Resilience:
- GDP grew 1.6% in Q1 2026
- Non-farm payrolls surprised to the upside for three consecutive months
- The three-month average of private payrolls reached 166,000 — its highest since June 2023
- Corporate earnings have generally remained resilient
- AI-related capital expenditure continues to support investment
Signs of Strain:
- Inflation at a three-year high of 4.2%
- Consumer spending barely above zero in April
- Savings rate falling to 2.6%
- Rising credit card and auto loan delinquencies
- A Fed now signalling tightening rather than relief
The outcome of 2026 will depend on whether the top-heavy spending — concentrated among businesses and affluent households — can continue to compensate for the exhaustion of median households. History suggests this divergence has limits.
How to Protect Your Portfolio and Finances
For Investors
Diversify away from concentrated AI exposure. The Magnificent Seven have outperformed for three consecutive years on AI enthusiasm. If AI valuations compress — whether from a bubble pop or simply from normalisation — concentrated positions in technology equities carry significant downside.
Increase fixed-income exposure cautiously. With rates potentially rising further, bond prices face near-term headwinds. But shorter-duration Treasuries and investment-grade corporate bonds offer yields that have not been available since 2007.
Consider defensive equity sectors. Healthcare, utilities, and consumer staples have historically outperformed in late-cycle environments and provide some protection against both inflation and a growth slowdown.
Maintain a gold allocation. As discussed, gold remains the most reliable hedge against the simultaneous risks of inflation, dollar weakness, and geopolitical shock.
For Households
Pay down floating-rate debt. If the Fed raises rates further, credit card APRs and home equity lines of credit will become more expensive. Every percentage point of variable-rate debt eliminated before tightening reduces exposure.
Build your emergency fund. A 2.6% savings rate implies the median American household has limited buffer for an income disruption. Three to six months of expenses in liquid savings provides the cushion that prevents a job loss or unexpected expense from becoming a financial crisis.
Lock in fixed-rate borrowing. If you are considering a mortgage or auto loan, a fixed-rate product eliminates the tightening risk that variable-rate instruments carry into an uncertain rate environment.
The Bottom Line
A US recession in 2026 is not the base case — Goldman’s 15% probability estimate captures the consensus. But the combination of elevated inflation, a hawkish Fed, exhausted consumers, geopolitical fragility, and an AI valuation premium built on unproven cash flows creates a risk profile that warrants genuine preparation rather than complacency.
The US economy is not heading off a cliff. But it is walking close enough to the edge that the positioning decisions made now — by investors, households, and policymakers — will materially determine how the second half of 2026 unfolds.
FAQs
Q: Will there be a recession in 2026?
A: As of late June 2026, a recession is not the base case. Goldman Sachs puts the probability at 15% following the US-Iran ceasefire. However, the combination of 4.2% inflation, a hawkish Fed, slowing consumer spending, and AI valuation risks creates a meaningful tail risk.
Q: What are the warning signs of a US recession in 2026?
A: Key indicators to watch include consumer spending growth slowing below zero, credit delinquency rates rising, the unemployment rate climbing, the yield curve inverting further, and any significant AI-related market correction.
Q: What is US GDP growth in 2026?
A: US GDP grew 1.6% in Q1 2026. The Federal Reserve Bank of Atlanta’s GDPNow model pointed to stronger Q2 growth, but the full-year outlook depends heavily on whether the Fed tightens further and how the consumer holds up.
Q: How do I protect my money in a potential recession?
A: Key steps include reducing floating-rate debt, building an emergency fund of 3–6 months of expenses, diversifying equity exposure away from concentrated AI positions, and maintaining a gold allocation as an inflation and safe-haven hedge.
Discover more from The Economy
Subscribe to get the latest posts sent to your email.

Oracle AI Debt Crisis 2026: $130 Billion Gamble Triggers Worst Stock Crash Since Dot-Com Bust

Male Labor Force Participation Rate 2026: Why Men Are Leaving & Economic Impact

Trump Tariffs 2026: Economic Impact, Household Costs & Trade War Outlook

China Economy 2026: Export Boom Masks Property Crisis & Investment Slump

US Inflation 4% May 2026: Is the Worst Over? Fed, Oil Prices

AI Memory Chip Shortage 2026: Nvidia, Apple & What Comes Next

US $39 Trillion National Debt 2026: Bond Market Warning Signs Explained

Ray Dalio US Suez Moment 2026: Dollar Decline, $39 Trillion Debt & Empire’s End

Kevin Warsh Fed Rate Hike 2026: What His Hawkish Pivot Means for Markets

Gold Price 2026: Will Gold Hit $6,000? JPMorgan Forecast, Drivers & Investment Guide

US Recession 2026: Four Key Threats, Warning Signs & How to Protect Your Portfolio

AI Energy Demand 2026: Data Centres, Power Grids & the $725B Infrastructure Boom

AI Semiconductor Selloff 2026: Micron Crash, Nasdaq Pullback & What Comes Next

US Tariffs 2026: How Trump’s 11.7% Effective Rate Is Reshaping Global Trade & Inflation

KPMG Australia CEO Resigns After Whistleblower Claims Exposed Investigation Failures

PwC China Partner Payouts Cut Amid Evergrande Audit Fraud

Broadcom Market Value Loss: Revenue Forecast Disappoints

Investors Pile Into Bullish Dollar Bets as ‘US Exceptionalism’ Trade Returns

Here’s How Much It’ll Cost You to Be Part of SpaceX’s Record-Breaking $75 Billion IPO

Nasdaq Tumbles 4% as Chip and Memory Stocks Sink: A $1.2 Trillion Wipeout

How to Fix Pakistan’s Debt Economy: A Structural Blueprint

Smash Capital Leads $200M Funding for Allen Control Systems

Democrats Draw a Red Line Around Military AI — And the Pentagon Is Already Pushing Back

New Investment Super-Cycle: AI, Green Energy & Re-Shoring

Russia Overspends on Putin’s War in Ukraine by $28bn

Xponential Fitness Franchise Lawsuit: The $3.97M Judgment

Middle East Conflict Oil Prices: The $4 Surge Explained

Grinding the Already Ground: Pakistan’s Inflation Crisis
-

 Markets & Finance6 months ago
Top 15 Stocks for Investment in 2026 in PSX: Your Complete Guide to Pakistan’s Best Investment Opportunities
-

 Analysis4 months ago
Top 10 Stocks for Investment in PSX for Quick Returns in 2026
-

 Analysis5 months ago
Brazil’s Rare Earth Race: US, EU, and China Compete for Critical Minerals as Tensions Rise
-

 Analysis4 months ago
Johor’s Investment Boom: The Hidden Costs Behind Malaysia’s Most Ambitious Economic Surge
-

 Banks5 months ago
Best Investments in Pakistan 2026: Top 10 Low-Price Shares and Long-Term Picks for the PSX
-

 Investment6 months ago
Top 10 Mutual Fund Managers in Pakistan for Investment in 2026: A Comprehensive Guide for Optimal Returns
-

 Global Economy6 months ago
15 Most Lucrative Sectors for Investment in Pakistan: A 2025 Data-Driven Analysis
-

 Global Economy6 months ago
Pakistan’s Export Goldmine: 10 Game-Changing Markets Where Pakistani Businesses Are Winning Big in 2025