
China Economy
The World’s 50 Largest Economies: A 25-Year Growth Trajectory Analysis (2000-2025)
How GDP Expansion and Export Dynamics Reshaped Global Economic Power
The dawn of the 21st century marked a watershed moment in economic history. In 2000, the global economy stood at approximately $33 trillion in nominal GDP. Today, that figure exceeds $105 trillion. But beneath these aggregate numbers lies a far more compelling story: a dramatic reshuffling of economic power that would have seemed fantastical to observers at the turn of the millennium.
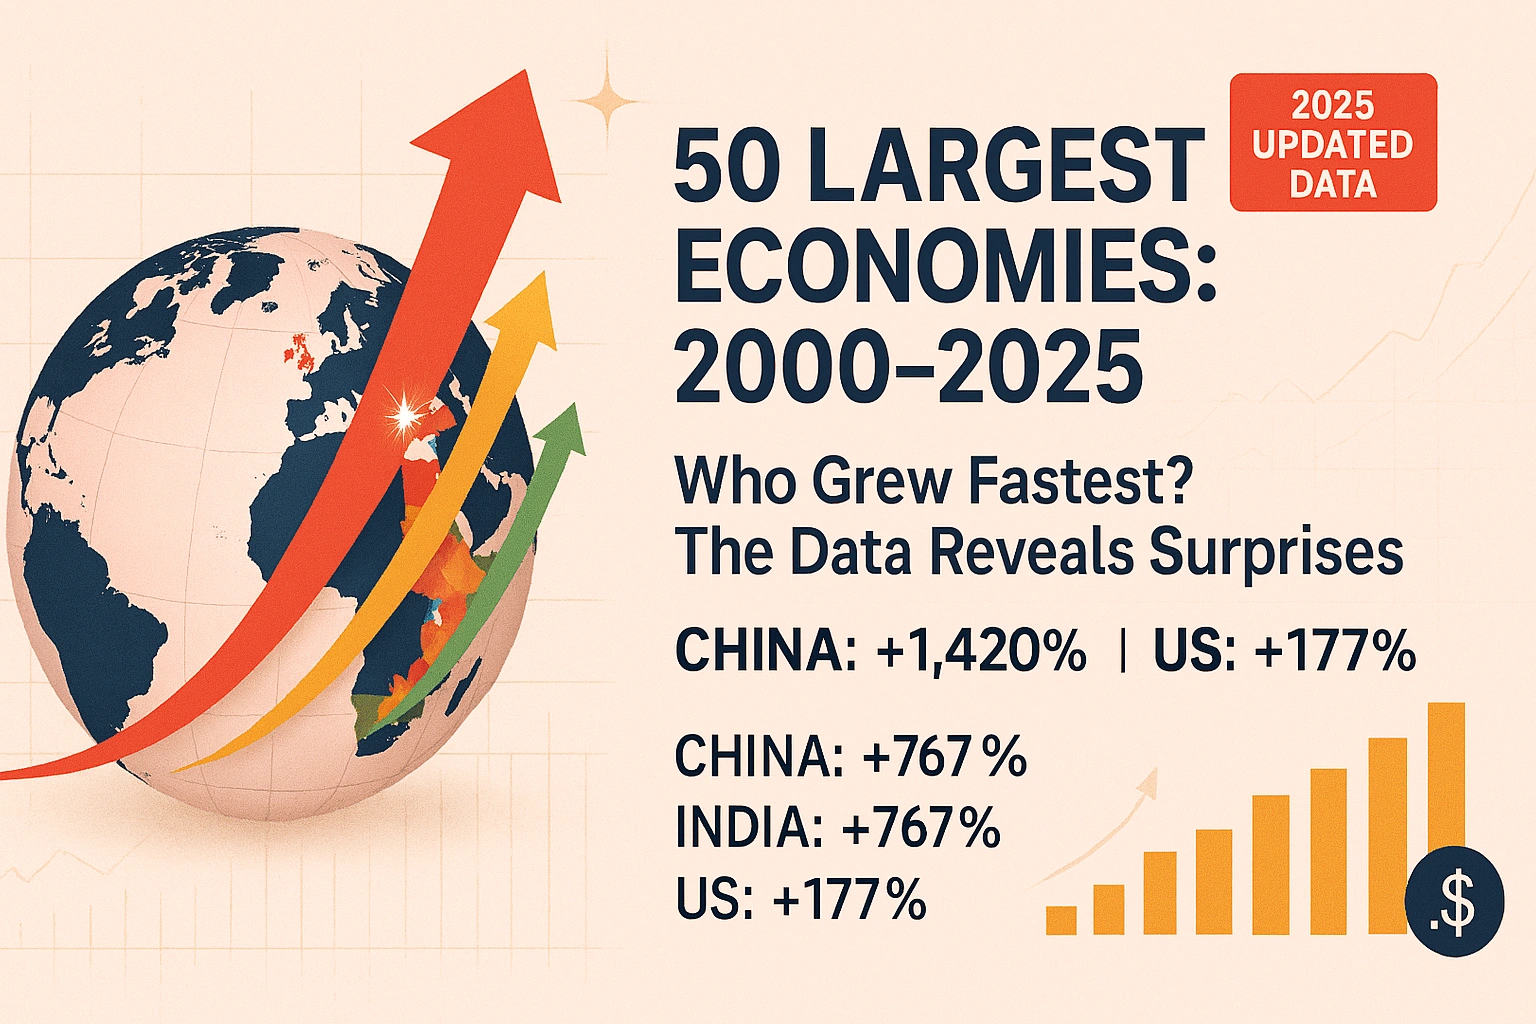
China’s economy has expanded fourteenfold. India’s has grown nearly eightfold. Meanwhile, traditional economic powers have seen their relative positions shift in ways that challenge decades of assumptions about development, growth, and global economic hierarchy. This analysis examines all 50 of the world’s largest economies, tracking their GDP trajectories and export performance across 25 years of globalization, crisis, and transformation.
For investors allocating capital across borders, policymakers navigating geopolitical competition, and citizens seeking to understand their place in the global economy, these patterns reveal which strategies succeeded, which models faltered, and what the next quarter-century might hold.
Methodology and Data Framework
This analysis draws primarily on datasets from the International Monetary Fund’s World Economic Outlook Database, supplemented by World Bank national accounts data and OECD statistics for member countries. Export data comes from the World Trade Organization’s statistical database and national statistical agencies.
GDP Measurement Approach
Two methodologies dominate international comparisons. Nominal GDP measures economic output in current U.S. dollars using market exchange rates. This approach captures the actual dollar value of economies in international transactions but can be distorted by currency fluctuations. Purchasing Power Parity (PPP) adjusts for price level differences between countries, providing a better measure of domestic living standards and real output.
This analysis primarily uses nominal GDP for rankings and international comparisons, as it reflects actual economic power in global markets, trade negotiations, and geopolitical influence. PPP figures are referenced where relevant for understanding domestic economic conditions and real growth rates.
Time Period and Baseline
The year 2000 serves as an ideal baseline for several reasons. It represents the post-Cold War economic order before China’s 2001 WTO accession, captures the dot-com bubble peak, and provides a pre-9/11, pre-financial crisis reference point. The 25-year span encompasses multiple economic cycles, technological revolutions, and structural transformations.
Data Limitations
All international economic comparisons face inherent challenges. GDP calculations vary by national statistical methodology. Currency fluctuations can dramatically shift nominal rankings. Some economies (particularly China) face ongoing debates about data accuracy. Export statistics may not fully capture services trade or digital transactions. These limitations warrant acknowledgment without undermining the broader patterns revealed.
The Top 10 Economic Titans: Dominance and Disruption
United States: Sustained Primacy ($28.8 Trillion)
The United States began the millennium with a GDP of approximately $10.3 trillion and has grown to roughly $28.8 trillion in 2025, according to Bureau of Economic Analysis estimates. This represents 180% growth over 25 years, or a compound annual growth rate of about 4.2% in nominal terms.
What’s remarkable isn’t just absolute growth but sustained leadership through multiple crises. The U.S. economy absorbed the dot-com crash, the 2008 financial crisis, and the COVID-19 pandemic while maintaining its position as the world’s largest economy and primary reserve currency issuer. The dollar’s role in global trade and finance, combined with technological leadership in software, biotechnology, and artificial intelligence, has preserved American economic dominance even as relative share declined.
U.S. exports expanded from $1.1 trillion in 2000 to approximately $3.0 trillion in 2024, driven by services (particularly digital and financial), agricultural products, and advanced manufacturing. The trade deficit widened substantially, reflecting consumption patterns and the dollar’s reserve status enabling persistent current account imbalances.
China: The Most Dramatic Rise in Economic History ($18.5 Trillion)
No economic transformation in human history compares to China’s 25-year ascent. From a GDP of approximately $1.2 trillion in 2000, China’s economy expanded to roughly $18.5 trillion by 2025—a staggering 1,440% increase. The compound annual growth rate exceeded 11% for much of this period, moderating to 5-6% in recent years as the economy matured.
China’s 2001 accession to the World Trade Organization catalyzed this transformation. The country became the “world’s factory,” with exports surging from $249 billion in 2000 to over $3.5 trillion by 2024. China now exports more than any other nation, with manufactured goods comprising the bulk of shipments.
This growth trajectory lifted 800 million people out of poverty, created the world’s largest middle class, and shifted global supply chains. China surpassed Japan as the world’s second-largest economy in 2010, a symbolic moment marking Asia’s return to historical prominence. The economy’s sheer scale now influences commodity prices, manufacturing trends, and technological development globally.
The Chinese model combined state-directed capitalism, export-led growth, massive infrastructure investment, and financial repression to channel savings into productive capacity. Whether this model remains sustainable as demographics worsen and debt accumulates represents one of the key questions for global economics through 2050.
Japan: Stagnation, Resilience, and Recent Revival ($4.1 Trillion)
Japan’s economic story offers a counterpoint to China’s rise. The world’s second-largest economy in 2000 with GDP of $4.9 trillion, Japan grew to only $4.1 trillion by 2025 in nominal terms—a decline of 16%. However, this masks a more complex reality.
In PPP terms, Japan’s economy expanded modestly. Deflation, an aging population, and yen depreciation compressed nominal figures. Yet Japanese corporations remained technological leaders, the country maintained high living standards, and exports of automobiles, electronics, and machinery remained substantial at approximately $900 billion annually.
The “lost decades” narrative oversimplifies. Japan’s unemployment remained remarkably low, social cohesion high, and per capita income among the world’s highest. Recent economic reforms under various administrations have targeted corporate governance, labor market flexibility, and monetary stimulus with mixed results.
Germany: Europe’s Export Champion ($4.7 Trillion)
Germany’s economy expanded from $1.9 trillion in 2000 to approximately $4.7 trillion in 2025, representing 145% growth. This performance stands out in a European context marked by crisis and stagnation.
The German model centered on export-oriented manufacturing excellence, particularly automobiles, machinery, and chemicals. Exports reached $1.9 trillion in 2024, making Germany one of the world’s leading exporters relative to economic size. The trade surplus consistently exceeded 5% of GDP, reflecting competitiveness but also structural imbalances within the eurozone.
Eurozone membership provided Germany with an undervalued currency relative to its productivity, advantaging exporters. However, this came at the cost of regional imbalances, as southern European economies struggled with the same currency that propelled German growth.
India: The Emerging Giant ($4.0 Trillion)
India’s trajectory represents the other great Asian success story. GDP expanded from approximately $470 billion in 2000 to $4.0 trillion in 2025—growth of 750%. While less dramatic than China’s rise in percentage terms, India’s expansion occurred in a democracy with different structural constraints.
Services-led growth distinguished India’s model. Information technology, business process outsourcing, and financial services drove development rather than manufacturing. Exports grew from $43 billion in 2000 to approximately $775 billion in 2024, with services comprising a larger share than typical for developing economies.
India’s 1.4 billion people and favorable demographics position the country as potentially the world’s third-largest economy by 2030. However, challenges around infrastructure, education quality, and institutional capacity temper projections.
United Kingdom: Brexit and Beyond ($3.5 Trillion)
The UK economy grew from $1.6 trillion in 2000 to approximately $3.5 trillion in 2025, representing 120% expansion. Financial services dominance in the City of London, combined with pharmaceuticals, aerospace, and creative industries, sustained growth despite manufacturing decline.
The 2016 Brexit referendum and subsequent departure from the European Union introduced new uncertainties. Trade patterns shifted, with services exports facing new friction and goods trade requiring customs procedures. The long-term impact remains contested, with research from institutions like the Centre for Economic Performance suggesting modest negative effects on trade and investment.
France: Social Model Under Pressure ($3.1 Trillion)
France expanded from $1.4 trillion in 2000 to roughly $3.1 trillion in 2025, growth of 125%. The French model balanced strong social protections, significant state involvement in strategic sectors, and export competitiveness in aerospace, luxury goods, and agriculture.
High taxation, rigid labor markets, and pension obligations created fiscal pressures throughout the period. Yet French multinationals competed globally, productivity remained high, and quality of life indicators consistently ranked among the world’s best.
Italy: Sclerotic Growth and Structural Challenges ($2.3 Trillion)
Italy represents the developed world’s most disappointing performer. GDP grew from $1.1 trillion in 2000 to only $2.3 trillion in 2025, barely doubling over 25 years. Structural problems including low productivity growth, political instability, banking sector weakness, and demographic decline constrained expansion.
Northern Italy’s industrial districts maintained export competitiveness in machinery and luxury goods, but southern underdevelopment, rigid labor markets, and high public debt limited potential. Italy’s experience illustrates how institutional quality and structural reforms matter as much as initial conditions.
Canada: Resource-Rich Stability ($2.2 Trillion)
Canada’s economy expanded from $740 billion in 2000 to approximately $2.2 trillion in 2025, representing nearly 200% growth. Natural resources (oil, natural gas, minerals, timber) provided substantial export revenues, while proximity to the United States ensured market access.
The Canadian model balanced resource extraction with services growth, immigration-driven population expansion, and prudent financial regulation. Canadian banks survived the 2008 crisis largely unscathed, reflecting stronger regulatory oversight than American counterparts.
South Korea: From Developing to Developed ($1.9 Trillion)
South Korea’s rise from $562 billion in 2000 to $1.9 trillion in 2025 represents successful development strategy execution. The country transitioned from middle-income to advanced economy status, with globally competitive firms like Samsung, Hyundai, and LG driving export growth.
Electronics, automobiles, and shipbuilding propelled exports from $172 billion in 2000 to over $750 billion in 2024. Heavy investment in education, R&D spending exceeding 4% of GDP, and strategic industrial policy yielded technological leadership in semiconductors and displays.
Positions 11-30: The Global Middle Class
This tier encompasses economies ranging from $700 billion to $1.8 trillion, representing diverse development models and regional dynamics.
Russia ($1.8 Trillion): Expanded from $260 billion in 2000 to peak at $2.3 trillion before sanctions and oil price volatility reduced GDP to approximately $1.8 trillion. Commodity dependence, particularly energy exports, has driven boom-bust cycles. Geopolitical tensions following the 2014 Ukraine annexation and 2022 invasion drastically reshaped economic relationships.
Brazil ($2.3 Trillion): Grew from $655 billion to roughly $2.3 trillion, with commodity cycles dominating. Agricultural exports (soybeans, beef, sugar) and mineral resources drove growth, but political instability, infrastructure deficits, and education gaps constrained potential. Brazil illustrates the “middle-income trap” where initial development success stalls before reaching advanced status.
Australia ($1.7 Trillion): Expanded from $415 billion to $1.7 trillion, benefiting enormously from Chinese demand for iron ore, coal, and natural gas. The commodity boom of 2003-2011 drove exceptional growth, with Australia avoiding recession for nearly three decades—a remarkable run enabled by flexible monetary policy, immigration, and resource wealth.
Spain ($1.6 Trillion): Grew from $580 billion to $1.6 trillion despite a devastating 2008-2013 crisis. Construction and real estate collapse, banking sector distress, and unemployment exceeding 25% created severe pain. Recovery came through labor market reforms, tourism growth, and European Central Bank support, demonstrating eurozone integration benefits and constraints.
Mexico ($1.8 Trillion): Expanded from $680 billion to $1.8 trillion, benefiting from NAFTA/USMCA market access and manufacturing nearshoring. Automobile production, electronics assembly, and agriculture linked Mexican growth tightly to U.S. economic cycles. Violence, corruption, and institutional weakness limited potential despite favorable geography.
Indonesia ($1.4 Trillion): Grew from $165 billion to $1.4 trillion, Southeast Asia’s largest economy demonstrating commodity wealth and demographic dividend. Palm oil, coal, and mineral exports drove growth, while domestic consumption from 275 million people provided resilience. Infrastructure development remains critical for sustaining momentum.
Netherlands ($1.1 Trillion): Expanded from $415 billion to $1.1 trillion, maintaining status as a trading hub and logistics gateway. Rotterdam’s port, favorable tax treatment for multinationals, and export-oriented agriculture (flowers, vegetables) sustained prosperity despite small geographic size.
Saudi Arabia ($1.1 Trillion): Oil wealth drove expansion from $190 billion to $1.1 trillion, with volatility reflecting crude prices. Vision 2030 diversification efforts aim to reduce petroleum dependence, but progress remains limited. The kingdom’s position as swing producer in OPEC gives it outsized influence over global energy markets.
Turkey ($1.1 Trillion): Grew from $270 billion to $1.1 trillion, bridging Europe and Asia geographically and economically. Manufacturing exports, tourism, and construction drove growth, but political uncertainty, inflation, and unconventional monetary policy created volatility. Currency crises in 2018 and 2021 highlighted vulnerabilities.
Switzerland ($940 Billion): Expanded from $265 billion to $940 billion, maintaining its status as a financial center and precision manufacturing hub. Pharmaceuticals, watches, machinery, and banking services generated trade surpluses despite high costs. Political neutrality, institutional quality, and innovation sustained exceptional per capita prosperity.
Poland ($845 Billion): Perhaps Europe’s greatest success story, expanding from $171 billion to $845 billion. EU accession in 2004 catalyzed transformation, with structural funds, market access, and institutional reforms driving convergence. Manufacturing exports, particularly automobiles and electronics, integrated Poland into German supply chains.
Argentina ($640 Billion): Illustrates development disappointment, growing from $284 billion to only $640 billion. Chronic inflation, debt defaults (2001, 2020), currency crises, and policy instability prevented potential realization. Agricultural wealth (beef, soybeans, wheat) couldn’t overcome institutional dysfunction.
Belgium ($630 Billion): Grew from $230 billion to $630 billion, benefiting from EU headquarters location, port of Antwerp, and chemicals/pharmaceuticals exports. Political fragmentation between Flemish and Francophone regions created governance challenges without preventing prosperity.
Ireland ($630 Billion): Extraordinary expansion from $100 billion to $630 billion, though figures are distorted by multinational tax strategies. Genuine growth in pharmaceuticals, technology services, and financial operations was amplified by corporate profit shifting. The “leprechaun economics” phenomenon saw GDP surge 26% in 2015 largely from accounting changes.
Thailand ($540 Billion): Expanded from $126 billion to $540 billion, maintaining position as Southeast Asian manufacturing hub. Automobile production, electronics assembly, and tourism sustained growth despite political instability. Integration into regional supply chains, particularly for Japanese manufacturers, proved durable.
Austria ($530 Billion): Grew from $195 billion to $530 billion, leveraging location between Western and Eastern Europe. Manufacturing excellence, tourism, and banking services for Central Europe maintained high living standards.
United Arab Emirates ($510 Billion): Oil wealth and diversification drove expansion from $104 billion to $510 billion. Dubai’s transformation into a trading, tourism, and financial hub demonstrated how resource wealth can fund structural transformation. Aviation, real estate, and logistics complemented hydrocarbon revenues.
Nigeria ($500 Billion): Africa’s largest economy expanded from $67 billion to $500 billion, driven by oil exports and population growth. However, per capita income gains remained modest as 220 million people diluted aggregate growth. Infrastructure gaps, corruption, and security challenges constrained development despite resource wealth.
Israel ($530 Billion): Grew from $130 billion to $530 billion, earning its “startup nation” moniker. High-tech exports (software, cybersecurity, semiconductors) and defense industries drove development. R&D intensity exceeding 5% of GDP and mandatory military service creating technical skills sustained innovation.
Singapore ($525 Billion): Expanded from $96 billion to $525 billion, maintaining status as Southeast Asian financial center and trading hub. Despite tiny geography, strategic location, rule of law, and openness to global commerce created exceptional prosperity. Per capita income ranks among the world’s highest.
Positions 31-50: Rising Stars and Resilient Performers
The lower half of the top 50 reveals diverse economies at various development stages, from African emerging markets to smaller European nations.
Malaysia ($445 Billion): Electronics manufacturing, palm oil, and petroleum drove growth from $90 billion to $445 billion. Integration into East Asian supply chains sustained development, though middle-income challenges emerged as low-cost advantages eroded.
Philippines ($470 Billion): Grew from $81 billion to $470 billion, with remittances from overseas workers, business process outsourcing, and domestic consumption driving expansion. The country’s 115 million people and English proficiency created services export opportunities.
Bangladesh ($460 Billion): Remarkable transformation from $53 billion to $460 billion, propelled by ready-made garment exports. The country became the world’s second-largest clothing exporter after China, demonstrating how labor-intensive manufacturing can drive initial development.
Vietnam ($430 Billion): Stunning growth from $31 billion to $430 billion represented successful transition from command to market economy. Manufacturing exports, particularly electronics and textiles, attracted investment fleeing Chinese costs. Vietnam increasingly serves as “China plus one” diversification destination.
Egypt ($400 Billion): Expanded from $100 billion to $400 billion, though population growth to 110 million meant modest per capita gains. Suez Canal revenues, tourism, natural gas, and agriculture sustained the economy, but political instability and food security concerns created challenges.
Denmark ($410 Billion): Grew from $165 billion to $410 billion, maintaining Nordic social model with high taxation, strong welfare state, and export competitiveness in pharmaceuticals, renewable energy, and maritime services. Consistently ranks among world’s happiest and most prosperous nations.
Colombia ($390 Billion): Expanded from $100 billion to $390 billion, with oil, coal, coffee, and flowers driving exports. Security improvements after decades of conflict attracted investment, though inequality and political polarization persisted.
Pakistan ($380 Billion): Grew from $74 billion to $380 billion, but population expansion to 240 million meant per capita income remained low. Textiles exports, agriculture, and remittances sustained the economy, though political instability, debt burdens, and energy shortages constrained growth.
Chile ($360 Billion): Expanded from $78 billion to $360 billion, with copper mining dominating exports. Market-oriented policies since the 1980s created Latin America’s highest per capita income, though inequality sparked social unrest in 2019.
Finland ($305 Billion): Grew from $125 billion to $305 billion despite Nokia’s mobile phone business collapse. Adaptation to technology sector changes, forestry exports, and strong education system maintained prosperity.
Romania ($330 Billion): EU membership catalyzed growth from $37 billion to $330 billion. Manufacturing exports, particularly automobiles, and IT services drove convergence with Western European living standards, though institutional challenges remained.
Czech Republic ($330 Billion): Expanded from $61 billion to $330 billion, becoming a manufacturing hub for German automotive industry. Škoda Auto’s integration into Volkswagen Group symbolized broader economic integration.
Portugal ($285 Billion): Grew from $120 billion to $285 billion despite 2010-2014 eurozone crisis requiring bailout. Tourism, exports to Spain and France, and reforms restored growth.
Iraq ($270 Billion): Oil wealth rebuilt economy from wartime devastation, expanding from $32 billion to $270 billion. However, political instability, sectarian violence, and petroleum dependence left development fragile.
Peru ($270 Billion): Grew from $53 billion to $270 billion, with copper, gold, and fishmeal exports driving expansion. Market reforms in 1990s created Latin America’s fastest-growing major economy for two decades.
New Zealand ($270 Billion): Expanded from $54 billion to $270 billion, leveraging agricultural exports (dairy, meat, wine) and tourism. Small population and geographic isolation didn’t prevent high living standards.
Greece ($240 Billion): Cautionary tale of boom and bust, growing from $130 billion to peak at $355 billion before eurozone crisis collapsed GDP to $240 billion. Debt crisis, austerity, and depression demonstrated risks of unsustainable fiscal policy within monetary union.
Qatar ($235 Billion): Natural gas wealth drove expansion from $30 billion to $235 billion. World’s highest per capita income reflects tiny population and massive hydrocarbon reserves. 2022 World Cup hosting demonstrated global ambitions.
Hungary ($215 Billion): Grew from $47 billion to $215 billion after EU accession. Automotive manufacturing for German brands and electronics assembly attracted investment, though democratic backsliding created tensions with Brussels.
Kazakhstan ($220 Billion): Oil wealth expanded economy from $18 billion to $220 billion. Resource dependence and authoritarian governance characterized development model, with diversification efforts showing limited progress.
Growth Champions: Who Grew Fastest?
While absolute size matters, growth velocity reveals which economies executed successful development strategies.
Highest Absolute GDP Growth (2000-2025):
- China: +$17.3 trillion
- United States: +$18.5 trillion
- India: +$3.5 trillion
- Germany: +$2.8 trillion
- Indonesia: +$1.2 trillion
Highest Percentage Growth (2000-2025):
- China: +1,440%
- Vietnam: +1,290%
- Bangladesh: +770%
- India: +750%
- Ethiopia: +680%
- Indonesia: +745%
- Poland: +395%
- Ireland: +530%
- Philippines: +480%
- Turkey: +307%
These rankings reveal that developing economies with large populations, favorable demographics, and successful integration into global trade achieved the fastest expansion. Manufacturing-oriented models (China, Vietnam, Bangladesh) outperformed commodity exporters, though natural resources provided growth where institutional quality allowed investment in productive capacity.
Export Growth Leaders:
Countries that dramatically expanded export volumes demonstrated competitiveness gains:
- China: $249 billion (2000) → $3,500 billion (2024) = +1,305%
- Vietnam: $14 billion → $385 billion = +2,650%
- India: $43 billion → $775 billion = +1,700%
- Poland: $32 billion → $395 billion = +1,134%
- Mexico: $166 billion → $620 billion = +273%
GDP Per Capita Improvements:
Several economies achieved dramatic per capita income gains, reflecting successful development:
- China: $960 → $13,100 (+1,265%)
- Poland: $4,450 → $22,000 (+395%)
- South Korea: $11,900 → $38,000 (+220%)
- Ireland: $25,600 → $98,000 (+283%, distorted by corporate accounting)
- Singapore: $23,800 → $88,000 (+270%)
Disappointments and Stagnation:
Some economies failed to realize potential or regressed:
- Japan: Nominal GDP declined despite stable living standards
- Italy: Barely doubled in 25 years, chronic stagnation
- Argentina: Chronic instability prevented resource wealth translation to broad prosperity
- Greece: Boom-bust cycle erased years of gains
- Venezuela: Collapsed from $117 billion to $70 billion, representing catastrophic policy failure
Structural Patterns and Insights
Several patterns emerge from 25 years of economic data:
Export-Led vs. Domestic Consumption Models
The most successful developing economies pursued export-oriented growth. China, Vietnam, Bangladesh, and Poland integrated into global supply chains, using external demand to drive industrialization and employment. Export manufacturing provided hard currency, technology transfer, and productivity improvements.
In contrast, economies relying primarily on domestic consumption or commodity exports faced greater volatility. Brazil, Russia, and Saudi Arabia experienced boom-bust cycles tied to resource prices, while protected domestic markets in Argentina and Venezuela bred inefficiency without external competitive pressure.
Resource Curse and Blessing
Natural resource wealth produced divergent outcomes based on institutional quality. Norway, Australia, and Canada translated resource abundance into broad prosperity through strong governance, transparent management, and economic diversification. Russia, Venezuela, and Nigeria experienced corruption, dutch disease, and volatility, demonstrating that institutions matter more than endowments.
The resource curse isn’t inevitable but requires deliberate policy to avoid. Sovereign wealth funds, transparent revenue management, and investment in education and infrastructure distinguished successful resource exporters.
Technology Adoption and Productivity
Economies that invested heavily in education, R&D, and digital infrastructure achieved sustained productivity gains. South Korea’s transformation from middle-income to advanced economy status reflected R&D spending exceeding 4% of GDP and technical education emphasis. Estonia’s digital transformation and Finland’s recovery from Nokia’s collapse demonstrated how human capital investment enables adaptation.
Countries that underinvested in education and allowed technological gaps to widen faced stagnation. Italy’s productivity growth essentially flatlined, while Greece’s education system failed to match labor market needs.
Demographics and Growth
Population structure powerfully influenced growth trajectories. India, Indonesia, and Philippines benefited from working-age population expansion, while Japan, Germany, and Italy struggled with aging and shrinking workforces. China’s demographic dividend is now reversing, with working-age population declining and dependency ratios rising.
The demographic transition from high birth rates and young populations through working-age expansion to aging and decline follows predictable patterns. Successful economies maximized growth during demographic dividend periods while building institutions and capital for aging. Japan’s challenges forewarn China’s future.
Institutional Quality Impact
Perhaps most fundamentally, institutional quality—rule of law, property rights protection, corruption control, regulatory quality—distinguished successful from failed development. Poland’s EU membership forced institutional reforms that unleashed growth. Argentina’s institutional dysfunction perpetuated crisis despite resource wealth and human capital.
Research from institutions like the World Bank’s Worldwide Governance Indicators consistently shows institutional quality correlating with growth, investment, and development outcomes. While causality is complex, the pattern holds across regions and time periods.
The 2000-2025 Economic Narrative: Crisis and Transformation
The 25-year period wasn’t smooth expansion but rather featured multiple shocks that reshaped economies:
Dot-Com Bust (2000-2002): Technology stock collapse triggered recession in advanced economies but barely affected most developing countries, illustrating financial integration levels.
China’s WTO Accession (2001): Perhaps the single most consequential economic event, integrating 1.3 billion people into global trading system and triggering manufacturing shifts worldwide.
Commodity Supercycle (2003-2008): Chinese demand drove unprecedented increases in oil, metals, and agricultural prices, enriching resource exporters and catalyzing infrastructure investment.
Global Financial Crisis (2008-2009): The worst economic crisis since the Great Depression exposed financial system vulnerabilities, triggered sovereign debt concerns, and prompted massive monetary stimulus. Advanced economies bore the brunt while emerging markets recovered faster.
Eurozone Crisis (2010-2012): Sovereign debt problems in Greece, Ireland, Portugal, Spain, and Italy threatened monetary union’s survival. ECB intervention and fiscal austerity created divergent outcomes across member states.
Emerging Market Slowdown (2013-2015): Chinese growth deceleration, commodity price collapses, and Fed tightening expectations triggered outflows and currency crises in vulnerable economies.
U.S.-China Trade Tensions (2018-2019): Tariff escalation, technology restrictions, and supply chain concerns marked shift from cooperation to strategic competition, with effects rippling through integrated global economy.
COVID-19 Economic Shock (2020-2021): Pandemic lockdowns triggered sharpest global contraction since World War II, followed by rapid recovery driven by unprecedented fiscal and monetary stimulus. Supply chain disruptions and inflation accelerated.
Post-Pandemic Inflation Surge (2022-2025): Stimulus-fueled demand colliding with supply constraints produced highest inflation in four decades. Central bank tightening raised recession risks while reshaping investment patterns toward domestic production and resilience over efficiency.
Each crisis tested economic models and policy frameworks. Countries with fiscal space, flexible institutions, and diversified economies generally recovered faster than those with rigidities, debt burdens, and concentrated exposures.
Future Implications: The Economic Landscape Through 2050
Several trends will likely shape the next quarter-century:
Demographic Dividend Shifts: India, Indonesia, Philippines, and African economies enter prime demographic periods while China, Europe, and eventually East Asia age rapidly. Working-age population shifts will drive growth location.
Technology Revolution Impact: Artificial intelligence, automation, and digital platforms will reshape productivity and employment. Countries that invest in digital infrastructure and technical education will capture disproportionate gains.
Climate Transition Economics: Decarbonization will require trillions in investment, creating winners in renewable energy and losers in fossil fuels. Early movers in clean technology may capture first-mover advantages while climate-vulnerable economies face adaptation costs.
Deglobalization vs. Regionalization: U.S.-China decoupling and supply chain reshoring may fragment the global economy, but regional integration (Africa Continental Free Trade Area, RCEP in Asia) could create new growth poles. Mexico and Southeast Asia may benefit from nearshoring trends.
BRICS+ Expansion: Efforts to create alternatives to dollar-dominated financial system and Western-led institutions reflect multipolar ambitions. Success remains uncertain but reflects broader power shifts.
Debt Sustainability Challenges: Many economies carry high debt burdens accumulated through crisis responses. Rising interest rates test sustainability, particularly for developing countries facing hard currency obligations.
Inequality and Social Stability: Within-country inequality grew alongside between-country convergence. Political polarization and social unrest may constrain growth-friendly policies, while automation and AI could accelerate labor market disruption.
Projections suggest China may reach or exceed U.S. GDP in nominal terms by 2035-2040, though per capita income will lag for decades. India will likely become the world’s third-largest economy before 2030. Indonesia, Vietnam, Bangladesh, and Philippines could all rank among the world’s 20 largest economies by mid-century.
However, these projections assume continuity in policies and institutions. As the past 25 years demonstrated, shocks, crises, and policy choices produce unexpected outcomes. Argentina’s decline from the world’s tenth-largest economy in 1900 to barely top-30 today warns against determinism.
Conclusion: The New Multipolar Economic Order
The 25-year period from 2000 to 2025 witnessed the most dramatic reshuffling of economic power in modern history. China’s rise, India’s emergence, and developing Asia’s transformation challenged Western economic dominance that characterized the post-World War II era.
Yet nuance matters more than headlines. The United States maintained absolute leadership while adapting to relative decline. Europe weathered existential crises to preserve integration. Japan’s stagnation coexisted with high living standards. Commodity exporters experienced booms and busts reflecting both resource wealth and institutional quality.
For investors, the patterns suggest several implications: Demographic dividends drive long-run growth. Export competitiveness, particularly in manufactured goods, proves more durable than commodity dependence. Institutional quality matters more than initial conditions. Crisis resilience requires fiscal space and flexible institutions.
For policymakers, the lessons emphasize: Trade integration, properly managed, accelerates development. Education and R&D investment compound over decades. Financial stability and prudent debt management prevent crisis vulnerabilities. Demographic transitions require foresight and adaptation.
The next 25 years will differ from the last. China’s demographic cliff, climate imperatives, technological disruption, and geopolitical fragmentation create new challenges. But fundamental principles endure: Investment in human capital, institutional quality, openness to trade and ideas, and sound macroeconomic management distinguish successful from failed development.
The global economic hierarchy that seemed immutable in 2000 proved anything but. The hierarchy emerging today will likewise transform by 2050. Understanding which forces drive change—and which countries position themselves to capitalize—remains the central challenge for anyone seeking to navigate the 21st century’s economic landscape.
Data Note: This analysis relies on data available as of January 2026, drawing primarily from IMF World Economic Outlook Database (October 2024), World Bank World Development Indicators, and OECD statistics. GDP figures for 2025 represent estimates subject to revision. Exchange rate fluctuations significantly impact nominal rankings. Readers should consult original sources for the most current
Discover more from The Economy
Subscribe to get the latest posts sent to your email.


Analysis
When Rivals Share a Rocket: The China-Europe SMILE Mission and the Fragile Promise of Space Science Diplomacy
On April 9, a European rocket will lift a Chinese-European spacecraft into orbit from the jungle coast of French Guiana. In a world tearing itself apart over chips, trade routes, and strategic chokepoints, this is not nothing.
The Countdown the World Isn’t Watching — But Should Be
At 08:29 CEST on April 9, 2026, an Avio-built Vega-C rocket — designated mission VV29, the first Vega-C flight operated by Avio Avio — will ignite its first-stage engines at Europe’s Spaceport in Kourou, French Guiana. Riding atop it will be SMILE: the Solar wind Magnetosphere Ionosphere Link Explorer, a 2,250-kilogram spacecraft nearly a decade in the making. The mission is a joint undertaking between the European Space Agency (ESA) and the Chinese Academy of Sciences (CAS) — and it is, by any reasonable measure, the most symbolically weighted space launch of 2026.
Not because of its destination. Not because of the science alone, though the science is genuinely groundbreaking. But because of what it represents at this particular moment in history: two of the world’s major technology powers, locked in an increasingly fraught geopolitical relationship, sharing data, sharing hardware, and sharing a launchpad.
SMILE is China’s first mission-level, fully comprehensive in-depth cooperation space science exploration mission with ESA GitHub — a statement that, when you sit with it, reveals how exceptional this collaboration actually is. After years of US-led pressure to isolate Chinese space activities, after the Wolf Amendment that has effectively banned NASA from bilateral cooperation with China since 2011, after wave after wave of technology export restrictions, here is a European rocket carrying instruments built simultaneously in Leicester and Beijing, tested jointly in the Netherlands, fuelled in Kourou, and aimed at a shared scientific horizon.
This is worth examining closely — not with naïve optimism, but with clear eyes.
What SMILE Actually Does, and Why It Matters
Before the geopolitics, the science — because the science is the point, and it deserves more serious attention than it typically receives in the English-language press.
Earth is constantly bombarded by gentle streams — and occasionally stormy bursts — of charged particles from the Sun. Luckily, a massive magnetic shield called the magnetosphere stops most of these particles from reaching us. If it weren’t for the magnetosphere, life could not survive on planet Earth. ESA
SMILE’s purpose is to give humanity its first comprehensive, simultaneous, global view of how that shield actually works — how it bends, buckles, and recovers under the assault of solar wind and coronal mass ejections (CMEs). Although several spacecraft have observed the effects of the solar wind and coronal mass ejections on Earth’s magnetic shield, they have mostly done so piecemeal ESA, through point measurements that are a bit like trying to understand a hurricane by sticking your hand out a single window.
SMILE changes that. The mission is a novel self-standing effort to observe the coupling of the solar wind and Earth’s magnetosphere via X-ray imaging of the solar wind-magnetosphere interaction zones, UV imaging of global auroral distributions, and simultaneous in-situ solar wind, magnetosheath plasma and magnetic field measurements. SPIE Digital Library
The four instruments it carries — the Soft X-ray Imager (SXI) built at the University of Leicester, a UV Aurora Imager, a Light Ion Analyser, and a Magnetometer — will work in concert from a highly inclined, highly elliptical orbit, with an apogee of 121,000 km and a perigee of 5,000 km. Avio From that sweeping vantage, SMILE will watch in real time as solar storms slam into Earth’s magnetic bubble, deform its boundaries, and trigger the geomagnetic disturbances we call space weather.
The Economic Stakes of Space Weather
Here is where the science becomes urgently, uncomfortably practical.
A severe geomagnetic storm — the kind triggered by a powerful CME — can induce electrical currents in long-distance transmission lines powerful enough to melt transformer cores. It can cripple GPS satellites, knock out shortwave radio communications, accelerate the degradation of satellite hardware, and expose astronauts to dangerous radiation doses. The Carrington Event of 1859 — the largest geomagnetic storm in recorded history — set telegraph offices on fire and produced auroras visible from the Caribbean.
Were a Carrington-scale event to strike the modern infrastructure-dependent world, the consequences would be catastrophic. Lloyd’s of London has estimated that a severe geomagnetic storm striking North America could leave between 20 and 40 million people without power for periods ranging from weeks to years, at a cost that would run into the trillions. The May 2024 geomagnetic storm — the most powerful in two decades — disrupted GPS signals and degraded satellite operations across the globe, offering a modest preview of what a truly extreme event might look like.
Better forecasting requires better physics. And better physics requires exactly what SMILE is designed to provide: a complete, global picture of how the magnetosphere actually responds to solar assault. By improving our understanding of the solar wind, solar storms and space weather, SMILE will fill a stark gap in our understanding of the Solar System and help keep our technology and astronauts safe in the future. ESA
A Mission Born in a Different World
The story of how SMILE came to be is, in itself, a small geopolitical parable.
The SMILE project was selected in 2015 out of 13 other proposals, and became the first deep mission-level cooperation between the European Space Agency and China. Orbital Today It was conceived when relations between China and the West, while not without tension, still operated under a broadly cooperative logic — when the prevailing assumption in Brussels and Beijing alike was that economic interdependence would gradually soften political friction and that scientific collaboration was a relatively safe space for engagement.
The Principal Investigators were Graziella Branduardi-Raymont from Mullard Space Science Laboratory, University College London, and Chi Wang from the State Key Laboratory of Space Weather at NSSC, CAS. ESA
What strikes me most about this pairing is its elegance and its tragedy. Professor Branduardi-Raymont — who, it should be noted, passed away in November 2023 after a lifetime of X-ray astronomy — had spent decades frustrated that no existing observatory could directly image X-ray emission from Earth’s magnetosphere. Her perseverance eventually produced this mission. She did not live to see its launch. But her instrument, built at the University of Leicester and calibrated with painstaking care across multiple European institutions, will fly on April 9 in the spacecraft she helped conceive. There is something moving in that continuity.
Professor Chi Wang, her Chinese counterpart, continued the work — a collaboration that survived COVID-era isolation, supply chain disruptions, and the gathering chill of US-China technology competition.
The SMILE mission entered full launch implementation phase after passing the joint China-Europe factory acceptance review on October 28, 2025. At the end of November 2025, the propellant required for the satellite departed from Shanghai, arriving at Kourou port in early February 2026. CGTN
On February 11, 2026, the flight model and ground support equipment departed from ESTEC in the Netherlands, sailing across the Atlantic from Amsterdam port aboard the cargo vessel Colibri, arriving at Kourou port on February 26, 2026, and being successfully transferred to the launch site. CGTN
That detail — a cargo ship named Colibri, sailing from Amsterdam to French Guiana carrying a satellite built in two countries on opposite ends of the Eurasian continent — is, to me, the most vivid emblem of what scientific cooperation can accomplish when given enough time, enough stubbornness, and enough shared wonder.
Europe’s Delicate Balancing Act
The launch of SMILE does not occur in a geopolitical vacuum. It occurs at a moment when Europe’s relationship with both China and the United States has become extraordinarily complex.
Washington has grown increasingly vocal about the risks of European technological cooperation with Beijing. The US-China Economic and Security Review Commission has flagged joint space missions as a potential vector for technology transfer. The US Space Force has publicly warned allies about sharing sensitive sensor data with Chinese partners. And while SMILE is a pure science mission — studying solar-terrestrial physics, not military reconnaissance — the distinction between civilian and dual-use space technology is one that Washington now views with considerable scepticism.
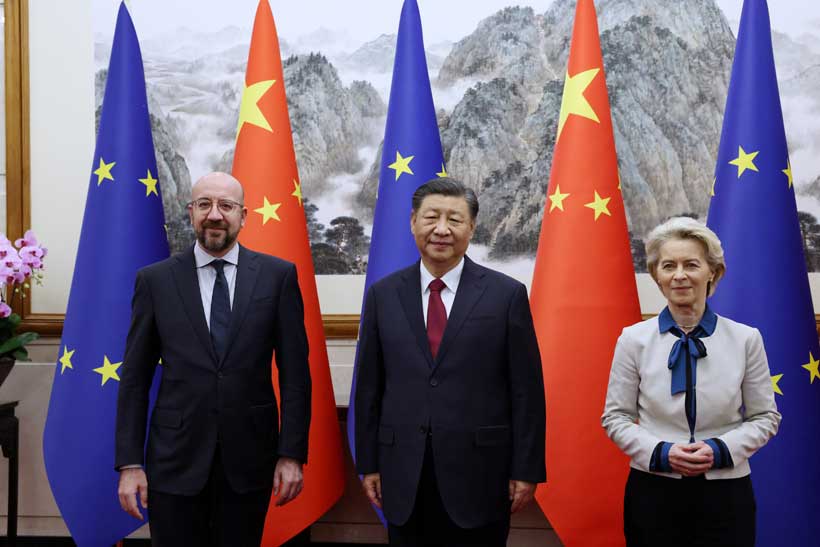
ESA, for its part, has walked this line with notable care. ESA Director General Josef Aschbacher confirmed SMILE’s launch timeline in January 2025, framing the mission squarely within the agency’s Cosmic Vision scientific programme — an agenda governed by scientific merit, not geopolitical alignment. “Building on the 24-year legacy of our Cluster mission,” said ESA Director of Science Prof. Carole Mundell, “SMILE is the next big step in revealing how our planet’s magnetic shield protects us from the solar wind.” ESA
That framing matters. ESA is positioning SMILE not as a concession to Beijing, but as the natural scientific successor to decades of European magnetospheric research — a mission that happens to have a Chinese partner because the Chinese partner brought the best science proposal to the table in 2015.
Strategic Autonomy in Orbit
Europe’s Strategic Autonomy agenda — the drive to reduce dependency on both American and Chinese platforms — finds an interesting expression in SMILE. The mission uses a European launcher (Vega-C), European testing facilities (ESTEC in the Netherlands), and a European payload module built by Airbus in Spain. China contributes three scientific instruments and the spacecraft platform and operations. The division of labour is not equal, but it is genuine.
This is different from the model China has pursued in, say, its International Lunar Research Station programme — a Beijing-led effort to build a Moon base with selective partner participation on China’s terms. SMILE was born from a joint call for proposals, adjudicated by both ESA and CAS, on scientific merit alone. The symmetry of its origins is a meaningful safeguard.
What the mission also illustrates, however, is the limits of that safeguard. Despite ongoing delays of the launch and geopolitical tensions between Europe and China, this mission marks an important collaboration between the two parties. Orbital Today Delays stretched from an original 2021 target across five years. COVID disrupted joint testing. Geopolitics hovered over every logistics decision. That the satellite is sitting on a Vega-C in Kourou today is a testament to institutional resilience on both sides — and a reminder of how fragile such resilience can be when the political weather changes.
What Comes Next: Blueprint or One-Off?
The successful implementation of the SMILE mission will set a benchmark for China-EU space science cooperation and lay the technological foundation for deeper future collaboration. GitHub
That Chinese Academy of Sciences statement is aspirational in tone. Whether it reflects reality will depend on choices that neither ESA nor CAS alone can make.
The scientific case for continued China-Europe cooperation in space is actually strong. China has developed formidable capabilities in solar and heliospheric science, planetary exploration, and space weather monitoring. ESA brings world-class instrumentation, launcher independence, and an institutional culture of multinational collaboration forged across 22 member states. Together, they have demonstrated — through SMILE — that the logistics of joint mission development are solvable, even across supply chain disruptions and a pandemic.
The geopolitical case is harder. As US pressure on European technology transfer policies intensifies, as China’s own space ambitions grow more assertive, and as the Artemis Accords effectively create a US-aligned coalition in cislunar space, Europe faces a binary pressure: join Washington’s bloc or preserve its own lane.
SMILE suggests a third option — cautious, science-first, mission-specific cooperation, carefully ring-fenced from military and surveillance applications, conducted through multilateral institutions with independent governance. It is not a grand geopolitical declaration. It is a pragmatic transaction between research agencies who share a genuine scientific puzzle.
That may, in the end, be its most important lesson. The most durable forms of international cooperation are rarely born from summit communiqués or diplomatic ambition. They are built from specific problems, shared curiosity, and the grinding, unglamorous work of building something together over a decade. SMILE’s cargo ship sailed from Amsterdam. Its fuel was loaded in Shanghai. Its instruments were calibrated in Leicester. Its launcher was assembled in Colleferro.
On the morning of April 9, all of that will rise together over the Atlantic, riding a column of fire into a highly elliptical orbit 121,000 kilometres above the Earth, where it will spend three years watching our planet’s invisible magnetic shield absorb the fury of the Sun.
Whatever one thinks of the geopolitics, that image is worth holding onto.
The View From the Launchpad
In a world increasingly defined by decoupling — technological, financial, diplomatic — SMILE is a small, luminous exception. It will not resolve the fundamental tensions between Beijing and Brussels. It will not answer the question of whether Europe can maintain scientific ties with China while deepening security cooperation with Washington. It will not make the next CME less dangerous or the next trade war less likely.
But it will, if all goes to plan, give us something genuinely new: a complete, real-time picture of how Earth’s magnetic shield breathes, bends, and holds against the solar wind. And it will have done so because two sets of scientists — from Milan and Beijing, from Leicester and Shanghai — decided that the problem was important enough to work on together, regardless of the weather in Washington.
What strikes me most, in the end, is not the geopolitics. It is the image of Professor Branduardi-Raymont at Mullard Space Science Laboratory, frustrated for years that no observatory could image X-ray emission from the magnetosphere, proposing mission concepts until one finally stuck. The Colibri will not carry her name. But the instrument riding inside the fairing of that Vega-C, the lobster-eye X-ray telescope that will for the first time map the shape of Earth’s magnetic boundary, is her life’s work.
The rocket lifts off at 08:29 CEST. The world should be watching.
Discover more from The Economy
Subscribe to get the latest posts sent to your email.
Analysis
How China Reinvented the BRI: Western Tariffs Accelerated Its Transformation Into a Sophisticated Extension of China’s Industrial Policy
There is a particular kind of policy failure that announces itself quietly—not with a crisis, but with a statistic that arrives too late to matter. For Western capitals still congratulating themselves on having exposed the “debt-trap diplomacy” of China’s Belt and Road Initiative, that statistic arrived in early 2025: $213.5 billion. That is the total value of BRI engagement last year, the highest figure ever recorded, driven by $128.4 billion in construction contracts and $85.2 billion in investments, according to the definitive annual tracking report by the Green Finance & Development Center at Fudan University and the Griffith Asia Institute.
The West had been writing the BRI’s obituary for years. It turns out the patient wasn’t dying—it was in surgery, emerging leaner, smarter, and considerably more dangerous to ignore.
This is the story of how China reinvented the BRI, and why the transformation is Beijing’s most consequential geopolitical pivot since Deng Xiaoping told his country to hide its strength and bide its time. Except now, China isn’t hiding anything.
From Debt-Trap Fears to Industrial Powerhouse: The Narrative That Aged Poorly
Cast your mind back to 2018. Western think-tanks were publishing breathless reports about “debt-trap diplomacy.” The IMF was warning about unsustainable Chinese loans. Hambantota port in Sri Lanka had become shorthand for everything allegedly predatory about the BRI. American officials quietly believed the initiative would collapse under its own contradictions—bad loans, political backlash, COVID disruptions, and the rising chorus of recipient-country grievances would do what sanctions could not.
Some of that critique was legitimate. Early BRI lending was frequently opaque, environmentally careless, and calibrated more toward Chinese state-owned construction firms than the development needs of host countries. AidData’s landmark 2021 research documented “hidden debt” problems in dozens of countries and found that a significant share of projects generated local frustration.
But here is where the Western analysis went badly wrong: it assumed Beijing would respond to criticism the way a Western institution might—with retrenchment, reform panels, and lengthy consultations. Instead, China did something far more strategically coherent. It quietly dismantled the version of the BRI that was failing and replaced it with one calibrated for a new era of great-power competition.
The result? While the West debated whether the BRI was dead, China’s total foreign trade hit approximately $6.4 trillion in 2024, with a historic trade surplus of roughly $1.19–1.2 trillion—figures reported by Reuters that would have seemed fantastical just a decade ago. The BRI isn’t a side project anymore. It is the arterial system through which that surplus finds its geopolitical purpose.
Tariffs as Catalyst: The 2025 Rebound Numbers Tell a Specific Story
The conventional wisdom holds that Western tariffs—Biden’s chips restrictions, the EU’s EV duties, Trump’s sweeping trade barriers—put China on the defensive. The 2025 BRI data suggests exactly the opposite dynamic: tariffs functioned as an accelerant, forcing Beijing to accelerate the very industrial-policy upgrades the BRI now embodies.
Consider the logic. When Washington raised tariffs on Chinese goods and Brussels slapped duties on Chinese EVs, it created an immediate problem for China’s manufacturing export machine: where do the goods go? The answer, executed with characteristic patience, was to restructure the BRI not just as a market for Chinese exports, but as a platform for relocating Chinese production—or at least assembly—to tariff-exempt or tariff-advantaged third countries.
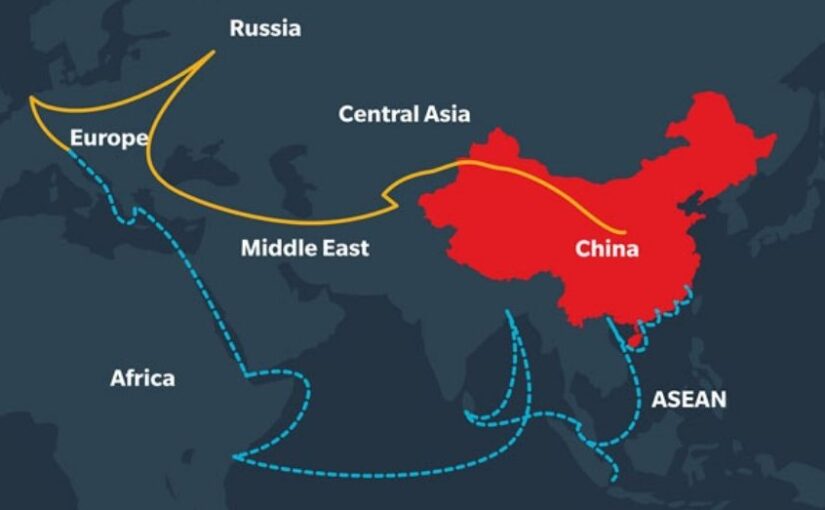
This is BRI supply chain rerouting tariffs in practice, not theory. Chinese firms, particularly in solar, EVs, and batteries, have been quietly establishing manufacturing footholds in BRI partner countries—Morocco, Indonesia, Hungary, Uzbekistan, Ethiopia—that enjoy preferential trade access to Western markets. The BRI’s infrastructure investments, once mocked as vanity ports and empty highways, now serve as the backbone for this industrial relocation strategy.
Key 2025 data points from the GFDC/Griffith report:
- $128.4 billion in construction contracts—the single largest component, reflecting continued hard-infrastructure buildout, now increasingly in energy and digital sectors
- $85.2 billion in direct investments—up sharply, and skewed toward manufacturing and green-tech rather than traditional ports and roads
- Africa and Central Asia led in project volume; Latin America showed the most dramatic investment value growth
- The private sector—companies like LONGi Green Energy, CATL, and East Hope Group—now drives a meaningful share of BRI deals, replacing the lumbering state-owned enterprises of the initiative’s first decade
That last point deserves emphasis. The shift from SOE-dominated lending to private-sector industrial investment is arguably the single most important structural change in the BRI’s reinvention. It is also the change that Western policymakers have been slowest to register.
The New BRI Playbook: Minerals, Green Tech, and Friends-with-Benefits Deals
If the old BRI was about concrete—ports, roads, pipelines, stadiums—the new BRI is about control of the materials and technologies that will define the next economic epoch. Three interlocking strategies define what might be called Beijing’s BRI 2.0 playbook.
First: Critical minerals security. China already refines the lion’s share of the world’s lithium, cobalt, nickel, and rare earths. The new BRI deepens this advantage by securing upstream supply through investment and long-term offtake agreements with mining countries across Africa (DRC, Zimbabwe, Zambia), Central Asia (Kazakhstan, Kyrgyzstan), and Latin America (Chile, Bolivia, Argentina’s lithium triangle). This isn’t charity—it’s vertical integration on a geopolitical scale. When Western nations talk about “friend-shoring” critical mineral supply chains, they are largely scrambling to catch up with arrangements China has been cementing through BRI frameworks for years.
Second: Green-tech export platforms. The EU’s Carbon Border Adjustment Mechanism and American clean-energy subsidies under the IRA were designed, partly, to create a market for Western green technology. Beijing read the same signals and moved faster. Chinese solar manufacturers, EV producers, and battery firms are using BRI partner countries as manufacturing hubs and as captive markets simultaneously. LONGi is building solar panel factories in the Middle East and Southeast Asia; CATL is establishing battery plants in Hungary and Morocco; East Hope is processing aluminium in Southeast Asia using cheaper regional energy. The BRI corridor isn’t just a trade route—it’s a China Belt and Road industrial policy shift writ in gigawatts and gigafactories.
Third: De-dollarization infrastructure. This is the most contested element, but it is real and accelerating. An increasing share of BRI transactions are settled in renminbi or via bilateral currency arrangements. The digital yuan—e-CNY—is being piloted in several BRI corridors. This is not imminent dollar displacement, but it is the patient construction of an alternative plumbing system for global finance, one that could matter enormously in a future sanctions scenario. The Council on Foreign Relations’ BRI backgrounder notes the financial architecture of the BRI as one of its most underappreciated dimensions.
What This Means for the Global South—and the West
The Global South’s relationship with the new BRI is more complicated than either its cheerleaders or its critics admit.
On one hand, recipient countries are more sophisticated than they were in 2013. Governments in Africa, Southeast Asia, and Latin America have watched the Hambantota cautionary tale; many now negotiate harder, demand local employment provisions, and push back on terms that seem tilted too heavily toward Chinese interests. The South China Morning Post has documented a genuine evolution in BRI deal structures—shorter loan tenors, more equity-participation arrangements, greater (if still imperfect) attention to environmental standards.
On the other hand, the fundamental power asymmetry remains. China offers something no other actor currently provides at scale: the combination of capital, construction capacity, and market access in a single package. The EU’s Global Gateway initiative—announced with considerable fanfare as the Western answer to the BRI—has pledged €300 billion through 2027, but disbursement has been slow, governance conditions can be onerous for developing-nation governments, and it cannot match China’s speed of project execution. Foreign Policy’s recent analysis captures the frustration among Global South policymakers who find Western alternatives rhetorically appealing but operationally disappointing.
This creates a dynamic that the West has not adequately grappled with: the BRI rebound 2025 is not primarily a story about Chinese aggression—it is a story about a vacuum the West has failed to fill. Countries that might prefer Western investment are accepting Chinese terms not because they love Beijing, but because the alternative is waiting indefinitely for funds that never quite materialize.
The geopolitical implications compound. Every BRI manufacturing hub established in a third country is a potential hedge against Western market access for that country. Every critical-mineral offtake agreement is a node in a supply chain that circumvents Western leverage. Every e-CNY transaction is a small withdrawal from the dollar’s gravitational pull. Individually, these are manageable. Aggregated over a decade, they constitute a structural shift in global economic architecture.
Why the BRI Is Now “Tariff-Proof”—And a Model for 21st-Century Industrial Statecraft
Here is the contrarian argument that Western analysts need to sit with: Western tariffs didn’t weaken China—they handed Beijing the perfect excuse to upgrade the BRI from concrete to competitive advantage.
The tariff pressure of 2018–2025 forced Chinese industrial policy to become more sophisticated. Firms that might have been content to export finished goods from home factories were pushed—by tariffs, by the risk of further escalation—to internationalize their production. The BRI provided the geographic framework, the infrastructure, and increasingly the regulatory and financial architecture to make that internationalization possible.
The result is a version of the BRI that is, paradoxically, more resilient to Western pressure than its predecessor. When the BRI was primarily about loans and construction contracts, Western pressure could target Chinese banks and state firms. Now that private Chinese industrial companies are the driving force, using locally incorporated entities, partnering with third-country firms, and settling deals in non-dollar currencies, the leverage points are harder to identify and harder to squeeze.
This is what makes the China BRI 2025 moment genuinely novel: it represents the emergence of a model for 21st-century industrial statecraft that Western nations don’t have a clear answer to. It blends state strategy with private-sector execution, hard infrastructure with technology transfer, financial architecture with trade facilitation—all in service of a coherent industrial-policy vision that links domestic manufacturing capacity to overseas market and resource access.
The Economist has noted that China’s approach to industrial policy has grown more sophisticated precisely under the pressure of Western countermeasures—a dynamic that mirrors historical cases where external pressure accelerated rather than retarded technological development.
What the West Should Do Differently: A Pragmatic Agenda
Diagnosis without prescription is just complaint. Here is what a more effective Western response might look like.
Stop celebrating the BRI’s supposed failures. Every time a Western think-tank declares the BRI dead and China proves otherwise, Western credibility takes a quiet hit in exactly the capitals that matter most. Accurate threat assessment is the prerequisite for effective strategy.
Accelerate Global Gateway and PGI disbursement—radically. The Partnership for Global Infrastructure and Investment (G7’s answer to BRI) and the EU’s Global Gateway need to move from pledges to projects at Chinese speeds. This requires cutting bureaucratic timelines, accepting more risk, and being willing to fund imperfect projects in imperfect countries. Development finance cannot be held to standards that make it functionally unavailable.
Compete on the private sector, not just the public sector. China’s most powerful new BRI instrument is private industry—CATL, LONGi, Huawei—backed by state industrial policy but operating with commercial agility. Western governments need to find ways to mobilize their own private sectors into developing-world markets at scale, through blended finance, risk guarantees, and trade facilitation that makes it commercially viable for Western firms to compete where Chinese firms currently dominate.
Engage on critical minerals with genuine urgency. The window to build alternative supply chains for lithium, cobalt, and rare earths is narrowing with each new BRI offtake agreement signed. The World Bank’s minerals framework provides useful architecture; what’s missing is the political will to fund it at the necessary scale.
Stop treating the Global South as a passive audience. The most effective counter-BRI strategy is not to badmouth the BRI—it is to offer recipient countries genuine choices. That means engaging with their actual development priorities, not just Western strategic preferences. Countries that feel they have real alternatives are countries that will negotiate harder with Beijing. Countries that feel they have no choice will sign whatever China puts in front of them.
The View from 2030
Project forward five years. If current trajectories hold, the BRI will have established a durable manufacturing and supply-chain ecosystem across Africa, Central Asia, the Middle East, and Latin America—one calibrated to Chinese industrial priorities, financed through diversified instruments, and partially insulated from Western financial pressure. The critical-minerals supply chains feeding China’s green-tech export machine will be deeper and harder to disrupt. The renminbi’s role in trade settlement will be meaningfully larger, if not yet dominant.
This is not inevitable. China faces real headwinds: domestic economic stress, growing recipient-country pushback on debt and local employment, competition from India and middle powers in specific corridors, and the possibility that some of its industrial bets—particularly in green tech—will be disrupted by technology shifts it doesn’t control.
But the West’s continued tendency to misread the BRI—to see it as a failing initiative rather than an evolving strategic instrument—makes the pessimistic scenario more likely. How China reinvented the BRI is not just an economic story. It is a masterclass in strategic adaptation under pressure, executed by a state that is patient, pragmatic, and playing a longer game than its rivals typically recognize.
The $213.5 billion that moved through BRI channels in 2025 is not a number. It is a signal. The question is whether Washington, Brussels, and London are finally ready to read it correctly.
Discover more from The Economy
Subscribe to get the latest posts sent to your email.
In the early 1980s, something extraordinary was happening in rural China. Incomes were surging. Families who had known only collective poverty under Mao Zedong’s commune system were suddenly trading at market prices, leasing land, and tasting prosperity for the first time in a generation. To most observers — Western economists, development agencies, awed foreign correspondents — this was an unambiguous miracle. But inside the halls of the Chinese Communist Party, one senior official was deeply unsettled by what he saw.
His name was Deng Liqun — no relation to Deng Xiaoping, China’s paramount leader who had initiated these reforms — and he was alarmed not by poverty, but by its opposite: the emergence of rural businesses hiring large numbers of workers. Citing Das Kapital directly, Deng Liqun invoked Marx’s analysis of surplus extraction and warned his colleagues that China was breeding a new exploiter class from within the revolutionary state itself. His warnings were dismissed, sidelined, or quietly buried. Forty years later, as Chinese factory workers report daily wages collapsing to less than 100 yuan amid a record export boom, the uncomfortable question is: was Deng Liqun right all along?
The Seven-Worker Loophole: When Marx Became a Management Consultant
To understand the ideological contortion at the heart of modern China, one must revisit a peculiar episode in the history of economic thought. As Deng Xiaoping’s reformers sought to legalize private enterprise in the early 1980s, they faced a Marxist problem: how could a Communist Party permit capitalist employers? Their solution was as creative as it was absurd.
Party theorists dug into Volume IV of Das Kapital and located a passage in which Marx cited the example of an employer with eight workers as the threshold at which genuine capitalist exploitation begins. The inference was swift and convenient: hire no more than seven workers, and you are not a capitalist. The “seven-worker rule” became, briefly, the ideological boundary between socialism and sin. As one analyst of the period put it, the Party had transformed Marx into a management consultant — and a lenient one at that.
The rule did not last. Entrepreneurs like Nian Guangjiu, the Shazi Guazi (“Fool’s Sunflower Seeds”) magnate, hired hundreds of workers and dared Beijing to intervene. Deng Xiaoping, pragmatist to the bone, let it pass. The seven-worker rule was quietly abandoned. China’s private sector began its long, relentless ascent.
But Deng Liqun continued to press his case. Throughout the 1980s, as China’s reformist faction consolidated power, he remained one of the party’s most vocal critics of market liberalization, warning that unchecked private capital would reproduce exactly the exploitative dynamics Marx had described. He was repeatedly outmaneuvered. He died in 2015, at age 99, largely forgotten — a curio of ideological defeat.
What he could not have known is that the data would eventually vindicate him.
The Numbers Behind the Narrative
China’s economic rise remains one of history’s most astonishing chapters. Hundreds of millions lifted from poverty. A GDP that expanded from a fraction of the United States’ to roughly 70 percent of it in nominal terms. The construction of entire cities from bare earth. No serious analyst dismisses this achievement.
But growth and fairness are different metrics. And on the metrics that matter most to a self-proclaimed workers’ state, the picture is quietly damning.
According to estimates by the International Labour Organization, China’s output per hour worked in 2025 stood at just $20 in constant international dollars — behind the global average of $23, and roughly on par with Brazil and Mexico. The United States, by comparison, registers $82 per hour. China does not achieve its manufacturing dominance through efficiency or technological leverage. It achieves it through sheer volume of hours — the kind of raw labor extraction that, as a recent analysis in Foreign Affairs argued, is precisely the dynamic Deng Liqun warned about four decades ago.
Income inequality tells an equally uncomfortable story. China’s official Gini coefficient stands at 0.47 — already above the internationally recognized warning threshold of 0.40, beyond which social instability becomes a material risk. But economists at Cornell University and Peking University, working with alternative datasets, place the true figure closer to 0.52, putting China in the company of some of the world’s most unequal societies. Meanwhile, data from Peking University’s China Development Report reveals that the top 1 percent of Chinese households own roughly one-third of the country’s property — a concentration of wealth that would have struck the founders of the People’s Republic as counterrevolutionary.
The public-private wage gap compounds the picture. According to data from China Briefing, the average annual urban wage in China’s public sector reached RMB 120,698 in 2023, while the average in the private sector — where the vast majority of Chinese workers are employed — was just RMB 68,340. Those who work for the state earn nearly twice those who do not. In a country that officially represents the proletariat, the proletariat is still on the outside looking in.
The Factory Floor in 2026
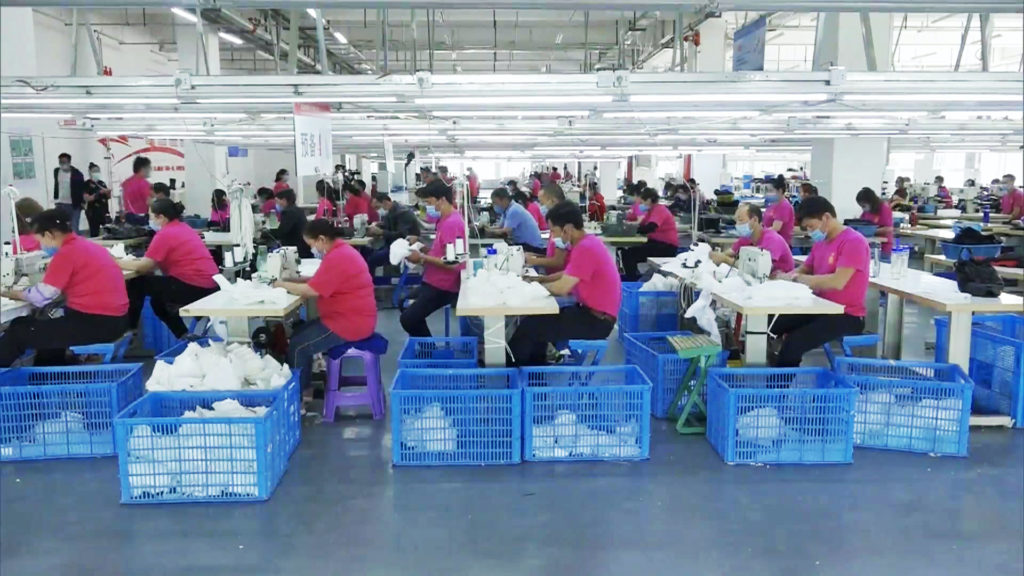
Abstract statistics find their most vivid expression on the ground. A Bloomberg investigation from March 2026 documented day laborers in Guangzhou waiting in winter cold for factory agents to offer work. One worker, Sheng, 55, described his income having more than halved to less than 100 yuan — roughly $14 — per day. Some workers cannot find employment for months at a time, he said. This is occurring while China posts record export numbers, defying the Trump administration’s escalating tariffs with a manufacturing juggernaut that continues to flood global markets.
The paradox is complete: the export machine hums, profits accumulate, trade surpluses swell — and the workers who power all of it are left behind. It is not incidental. It is structural. As China Labor Watch’s executive director Li Qiang argued in January 2026, China’s decisive competitive advantage lies in its weak labor protections, and it is now exporting this low-rights model globally — a race to the bottom dressed in the language of development.
Nowhere is this more starkly illustrated than in the platform economy. According to the All-China Federation of Trade Unions, the number of workers in “new forms of employment” — overwhelmingly gig-economy roles with minimal protections — surpassed 84 million in 2024, representing 21 percent of the total workforce. Among food-delivery riders on Meituan alone, nearly half worked fewer than 30 days per year, pointing to an army of precarious, intermittent laborers with no benefits, no unions, and no recourse. As of 2022, at least 70,000 of these riders held master’s degrees.
996, Involution, and the Vocabulary of Exhaustion
China’s young workers have developed their own lexicon for what Marxist theory would call surplus extraction. The “996” schedule — work from 9 a.m. to 9 p.m., six days a week — became the defining norm of China’s tech industry, a practice that a joint study by Chinese and Australian universities, published in October 2025, described as “modern labour slavery,” directly linking it to chronic burnout, mental health decline, and fertility postponement. Officially illegal under China’s Labor Law, 996 persists through what labor researchers describe as “informal-flexible despotism” — the unspoken threat of unemployment for those who refuse to comply.
The cultural response has been the phenomenon of neijuan, or “involution” — the sense of being trapped in relentless, self-defeating competition that produces no advancement. As youth unemployment reached 17.8% in July 2025 — six times the official urban headline rate — and this year’s graduating class of 12.22 million enters a trade-war-disrupted economy also disrupted by artificial intelligence, neijuan has metastasized from internet slang into political critique. Its counterpart, tangping — “lie flat” — is the passive resistance of those who have concluded that the system is designed not to reward their labor but to extract it.
These are not marginal, youth-culture curiosities. They are symptoms of a structural contradiction at the heart of the Chinese political economy: a party that claims to represent workers presiding over conditions that would have warranted a chapter in Volume I of Das Kapital.
Xi Jinping’s Marxist Revival: Signal or Noise?
Against this backdrop, Xi Jinping’s periodic invocations of Marxist rhetoric acquire a particular ambiguity. His “common prosperity” campaign, elevated in August 2021 as “an essential requirement of socialism,” set targets to reduce the Gini coefficient from 0.47 toward 0.40 by 2025 and 0.35 by 2035. The crackdown on tech giants — Alibaba, DiDi, Meituan — was framed in language recognizable to any student of Marx: reining in monopoly capital, redistributing to the people.
Yet the common prosperity campaign has conspicuously failed to deliver on its core promise. The Gini has not meaningfully declined. Minimum wages, while rising nominally, remain well below levels that would allow Chinese households to become the robust consumers the economy urgently needs. The crackdown on tech billionaires proved more politically convenient than structurally transformative: it punished visible wealth without redistributing it, and it chilled private investment without replacing it with workers’ power.
As CSIS’s Interpret: China project has noted, the common prosperity campaign’s success will ultimately be judged not by economics but by whether it can “maintain social harmony and stability” — which is to say, by whether the CCP can suppress the political consequences of inequality without addressing its material causes. That is not Marxism. That is its managed inverse.
The Overproduction Trap: What Karl Marx Got Right, and What China Ignored
Marx’s central warning in Capital was not simply about exploitation in isolation. It was about the systemic consequences of treating workers purely as inputs: overproduction crises, demand collapse, competitive race-to-the-bottom dynamics that ultimately undermine the capitalist system itself. He called it “the epidemic of overproduction.”
China in 2026 is exhibiting textbook symptoms. The electric vehicle sector’s median net profit margin collapsed to just 0.83% in 2024, down from 2.7% in 2019, as brutal price wars among BYD, Tesla, and dozens of domestic brands hollowed out margins. The solar manufacturing industry lost $40 billion to overcapacity. Steel, cement, food delivery — sector after sector is caught in the deflationary spiral that Chinese policymakers euphemistically call “involution” but that economists recognize as classic overproduction: too much supply chasing too little domestic demand, because workers who make the goods cannot afford to buy them.
The CCP’s own theorists have identified the root: household consumption remains stubbornly low as a share of GDP — hovering near 37-38 percent, compared with 68 percent in the United States and over 50 percent in most developed economies. The Foreign Affairs analysis draws the Henry Ford parallel with precision: Ford famously raised his workers’ wages so they could afford his cars. China’s economy does the reverse — it suppresses wages to make exports price-competitive, and then wonders why domestic demand refuses to ignite.
The Global Stakes: What China’s Labor Model Exports
The implications extend well beyond China’s borders. As China Labor Watch has documented, Beijing’s manufacturing dominance is now being actively exported through Belt and Road projects, industrial parks across Africa and Southeast Asia, and Chinese-owned factories in countries from Ethiopia to Cambodia. The labor conditions travel with the capital. A race to the bottom in labor rights is a deliberate feature, not an accident, of China’s industrial model — and it sets the competitive benchmark to which other manufacturing nations must respond or decline.
For Western policymakers, this reframes the trade debate. Tariffs address the symptom — price-competitive imports — without touching the cause, which is systematic wage compression underwritten by a state that suppresses independent unions, restricts collective bargaining, and classifies labor organizing as a political threat. The US-China trade war’s escalating tariff regime, which has seen duties on Chinese goods reach 145 percent, is economically disruptive for both sides. But it does not change the structural reality that China’s manufacturing advantage is built on a foundation that would have been recognizable to Friedrich Engels touring Manchester in 1845.
Conclusion: The Haunting of Deng Liqun
History’s ironies rarely arrive cleanly. Deng Liqun was, in many respects, a problematic figure — a hardliner who helped orchestrate ideological campaigns that silenced liberal reformers and contributed to the atmosphere of repression that culminated in Tiananmen. His Marxism was often a political instrument as much as a philosophical commitment.
But on this one point, his analysis was structurally sound: a Communist Party that permits unlimited private capital accumulation without empowering workers to claim a proportionate share of the value they create is not transcending Marx. It is fulfilling him. The exploitation he predicted has arrived — not in the form of Victorian factory owners with top hats, but in the form of platform algorithms calculating delivery routes to the nearest yuan, 996 schedules enforced through the threat of precarity, and a gig economy that has absorbed 84 million workers without offering a single one a union card.
Xi Jinping’s “common prosperity” rhetorical architecture is vast and elaborate. The material delivery, forty years after Deng Liqun’s warnings, remains insufficient. China’s economy runs on labor exploitation. Marx would have recognized it immediately. He would have found it almost unremarkable. What would have astonished him — what should astonish us — is that the party invoking his name is the one enforcing it.
Discover more from The Economy
Subscribe to get the latest posts sent to your email.
-

 Markets & Finance3 months ago
Top 15 Stocks for Investment in 2026 in PSX: Your Complete Guide to Pakistan’s Best Investment Opportunities
-

 Analysis2 months ago
Brazil’s Rare Earth Race: US, EU, and China Compete for Critical Minerals as Tensions Rise
-

 Banks3 months ago
Best Investments in Pakistan 2026: Top 10 Low-Price Shares and Long-Term Picks for the PSX
-

 Investment3 months ago
Top 10 Mutual Fund Managers in Pakistan for Investment in 2026: A Comprehensive Guide for Optimal Returns
-

 Analysis2 months ago
Top 10 Stocks for Investment in PSX for Quick Returns in 2026
-

 Asia3 months ago
China’s 50% Domestic Equipment Rule: The Semiconductor Mandate Reshaping Global Tech
-

 Global Economy3 months ago
Pakistan’s Export Goldmine: 10 Game-Changing Markets Where Pakistani Businesses Are Winning Big in 2025
-

 Global Economy3 months ago
15 Most Lucrative Sectors for Investment in Pakistan: A 2025 Data-Driven Analysis