
Global Economy
Venezuelan Crude: Trump’s Oil Pivot & The Prize Beneath Chaos
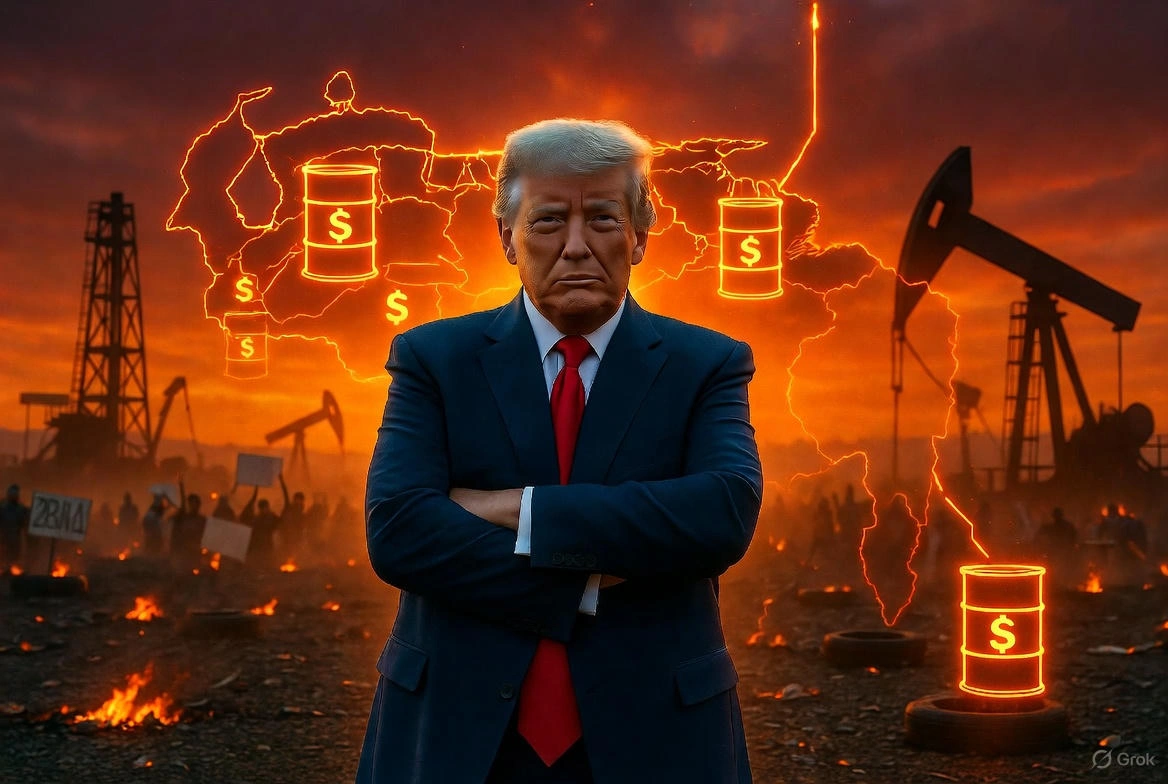
As Trump shifts from regime change to resource extraction, Venezuelan crude’s 303B barrel prize is rewriting Latin American geopolitics. Expert analysis with premium sources.
Sitting atop an estimated 303 billion barrels of proven oil reserves—roughly 17% of the world’s total and more than Saudi Arabia’s holdings—Venezuela today produces less crude than it did in 1950. This is not hyperbole but the staggering reality of a petrostate that transformed geological fortune into economic catastrophe. The country ranked just 21st in global oil production in 2024, pumping approximately 960,000 barrels per day, a fraction of its 3.5 million barrel peak in the late 1990s.
The paradox has never been starker, nor the stakes higher. In early January 2026, following unprecedented military action that resulted in the capture of Venezuelan President Nicolás Maduro, President Donald Trump announced his administration would take control of Venezuela’s oil sector. Trump declared that Venezuela would turn over between 30 million and 50 million barrels of sanctioned oil, with sales beginning immediately and continuing indefinitely. The move represents one of the most dramatic pivots in U.S. Latin American policy in generations—from regime change through maximum pressure sanctions to direct resource extraction.
For investors, policymakers, and energy analysts, Venezuela’s oil represents both immense promise and profound peril. This article examines the geological prize, chronicles the industry’s collapse, analyzes Trump’s transactional pivot, assesses the investment landscape, maps the geopolitical chess match, and most critically, asks whether oil wealth will ever benefit ordinary Venezuelans—or if the resource curse will simply acquire new management.
303 Billion Barrels: The Orinoco Advantage
Venezuela’s claim to the world’s largest proven oil reserves is not mere nationalistic boasting. According to OPEC’s Annual Statistical Bulletin 2025, Venezuela holds approximately 303 billion barrels, well ahead of Saudi Arabia’s 267 billion. The bulk of this bonanza sits in the Orinoco Belt, a 600-kilometer crescent stretching across Venezuela’s interior that may contain between 900 billion and 1.4 trillion barrels of heavy crude in proven and unproven deposits.
But geology tells only half the story. Venezuela’s crude is famously difficult. The oil is heavy and sour, requiring specialized equipment and high levels of technical prowess to produce. With API gravity ratings typically between 8 and 22 degrees—compared to the 30-40 range of lighter crudes—Venezuelan oil is thick, sulfurous, and expensive to refine. Most U.S. Gulf Coast refineries were specifically configured to process this type of heavy crude, creating a unique technical dependency that has shaped bilateral energy relations for decades.
The economic viability of Orinoco Belt production depends critically on oil prices, technology, and infrastructure. During periods when crude trades above $70-80 per barrel, extraction economics improve dramatically. Below that threshold, many deposits become marginal. Industry experts estimate that returning Venezuela to its early 2000s production highs would require approximately $180 billion in investment between now and 2040, according to energy intelligence firm Rystad Energy. Of that staggering sum, between $30-35 billion would need to be committed within the next two to three years just to stabilize and modestly increase current output.
The infrastructure decay is comprehensive. PDVSA acknowledges its pipelines haven’t been updated in 50 years, and the cost to update infrastructure to return to peak production levels would cost $58 billion. Upgrading facilities that convert extra-heavy crude into marketable products have fallen into disrepair. Power generation systems that drive extraction operations suffer chronic failures. Even basic maintenance on wellheads and pumping stations has been deferred for years.
Francisco Monaldi, director of the Latin American Energy Institute at Rice University’s Baker Institute, offers a sobering assessment of Venezuela’s reserve claims. Venezuela’s recovery rate for its oil is less than half of what the country claims, meaning a reasonable and conservative estimate of economically recoverable reserves would be closer to 100-110 billion barrels. The distinction matters enormously—not for geological surveys but for financial modeling and investment decisions.
From Boom to Bust: Anatomy of a Petrostate Failure
Venezuela’s oil story began spectacularly in 1922 when the Barrosos-2 well near Maracaibo erupted in a gusher that sprayed crude 200 feet into the air. By the 1970s, Venezuela had become Latin America’s wealthiest nation, riding OPEC-engineered price increases to prosperity. The 1976 nationalization of the oil industry under President Carlos Andrés Pérez created Petróleos de Venezuela S.A. (PDVSA), a state company that initially operated with remarkable efficiency and technical competence.
Through OPEC, which Venezuela helped found alongside Iran, Iraq, Kuwait, and Saudi Arabia, the world’s largest producers coordinated prices and gave states more control over their national industries. Venezuela’s nationalization, unlike many others, proceeded relatively smoothly. Foreign companies received compensation, technical partnerships continued, and PDVSA emerged as a world-class national oil company, retaining many of the operational practices of its multinational predecessors.
The first major shock arrived in December 2002, when a politically motivated strike against PDVSA—triggered by opposition to President Hugo Chávez—paralyzed production. The strike led to the firing of nearly 20,000 workers, or 40% of PDVSA’s total workforce, including many of its most capable engineers and skilled operators, which dropped production to less than 1 million barrels per day for a short period. This mass exodus of technical expertise created a knowledge vacuum from which PDVSA never fully recovered.
Chávez’s broader nationalization drive intensified after 2007. In 2007, he seized and nationalized the assets of foreign oil companies, including ExxonMobil and ConocoPhillips, driving them out of the country. Unlike the orderly 1976 transition, these expropriations were contentious and undercompensated. International arbitration tribunals later awarded billions in compensation—$1.6 billion to ExxonMobil and $8.5 billion to ConocoPhillips—which Venezuela has largely failed to pay. This episode fundamentally altered the risk calculus for foreign investment in the sector.
Under Chávez, PDVSA was transformed from a technical institution into a social welfare mechanism and political instrument, with the company effectively becoming an ATM machine for military spending and Bolivarian Missions. Revenue that might have been reinvested in maintenance, exploration, and upgrading facilities instead financed food subsidies, housing programs, and political patronage. The company was required to hire based on political loyalty rather than technical competence.
The 2014 oil price collapse delivered the coup de grâce. When crude plummeted from over $100 per barrel to below $30, Venezuela’s already fragile model shattered. By 2016, oil production reached the lowest it had been in 23 years, with analysts noting that the economic crisis would have occurred with or without U.S. sanctions due to chronic mismanagement. Production equipment failed without replacement parts. Electrical grid collapses shut down extraction facilities. Refineries operated at single-digit capacity utilization rates.
As unrest brewed under President Maduro, who succeeded Chávez in 2013, power was consolidated through political repression, censorship, and electoral manipulation. When the Trump administration imposed comprehensive oil sector sanctions in 2019, the industry was already in structural decline. The sanctions accelerated but did not initiate Venezuela’s production collapse.
Trump’s Pivot: From Regime Change to Resource Extraction
The transformation in U.S. policy toward Venezuela under Trump 2.0 represents one of the most dramatic tactical shifts in recent American foreign policy. During his first term (2017-2021), Trump pursued maximum pressure: comprehensive sanctions, recognition of opposition leader Juan Guaidó as interim president, and explicit calls for regime change. The Biden administration largely maintained this approach while offering selective relief, including a license for Chevron to resume limited operations.
The new calculus became clear on January 3, 2026, when U.S. military forces captured Maduro in a predawn operation. Trump officials subsequently outlined an ambitious, multi-part plan centering on seizing and selling millions of barrels of Venezuelan oil on the open market while simultaneously convincing U.S. firms to make expansive, long-term investments aimed at rebuilding the nation’s energy infrastructure. Secretary of State Marco Rubio and Energy Secretary Chris Wright have taken lead roles in articulating this strategy.
The shift from narcoterrorism rhetoric to energy pragmatism happened with remarkable speed. According to sources close to the White House, the Trump administration has set specific demands for Venezuela: the country must expel China, Russia, Iran, and Cuba and sever economic ties, and Venezuela must agree to partner exclusively with the U.S. on oil production. This represents a stark departure from previous democracy-promotion framing to a transactional, realpolitik approach focused on economic and strategic interests.
The timing reflects broader energy security considerations. The United States has light, sweet crude which is good for making gasoline but not much else, while heavy, sour crude like Venezuelan oil is crucial for diesel, asphalt, and fuels for factories and heavy equipment. Most U.S. Gulf Coast refineries were constructed to process Venezuelan heavy crude and operate significantly more efficiently when using it compared to domestic light sweet crude.
Energy Secretary Chris Wright confirmed at a Goldman Sachs conference that the U.S. will market crude coming out of Venezuela, first the backed-up stored oil and then indefinitely going forward, selling production into the marketplace. The administration plans to maintain control over initial oil sale revenues, with proceeds intended to “benefit the Venezuelan people” while funding infrastructure rebuilding.
However, significant logistical and political obstacles loom. Despite Trump’s insistence that U.S. oil companies would pour into Venezuela, officials have no ready plan for convincing firms to invest hundreds of billions of dollars in rebuilding the nation’s energy infrastructure. Major U.S. oil companies have remained largely silent on expansion plans, with Chevron—the only significant American operator currently in Venezuela—focusing on employee safety rather than announcing new investments.
The legal framework remains murky. Former Treasury sanctions policy advisor Roxanna Vigil noted that the private sector currently has nothing official to go on for any sort of assurance or confidence about how operations will be authorized based on U.S. sanctions. Without clear regulatory pathways and liability protections, even companies interested in Venezuelan opportunities face significant barriers to deployment of capital.
The political durability of this approach is questionable. Congressional Democrats have expressed concerns about the military intervention and lack of clear endgame. While some Republicans support a strong stance against Latin American drug cartels and the Maduro regime, others worry about open-ended commitments. Helima Croft, head of global commodity strategy at RBC Capital Markets, warned that accomplishing Trump’s goal will effectively require U.S. oil companies to play a “quasi-governmental role,” which could cost $10 billion a year according to oil executives.
The Investment Conundrum: Who Dares Capital in Caracas?
For international oil companies and financial institutions, Venezuela presents a uniquely challenging risk-reward calculation. The asset base is undeniably attractive—if it can be developed profitably and safely. The question is whether conditions will permit that development.
Chevron currently represents the largest Western oil presence in Venezuela, operating through joint ventures with PDVSA. Chevron pays PDVSA a percentage of output under a joint operation structure that accounts for about one-fifth of Venezuela’s official oil production. The company has approximately 3,000 employees in-country and billions in sunk assets. Walking away would likely mean forfeiting those assets entirely, as past nationalizations have demonstrated.
Chinese and Russian companies have become the dominant foreign players during the sanctions era. China National Petroleum Corporation (CNPC) holds stakes in consortiums with concessions covering 1.6 billion barrels of oil, while China Petroleum & Chemical Corporation (Sinopec) holds stakes covering 2.8 billion barrels. These ventures have continued operating despite sanctions, with Beijing treating U.S. restrictions as illegitimate unilateral measures rather than binding international law.
Chinese financial institutions, primarily the China Development Bank, loaned Venezuela approximately $60 billion through 17 different loan contracts—about half the Chinese loans committed to Latin America as of 2023. These loans were structured as oil-for-credit arrangements, with repayment in the form of crude shipments to China. Venezuela currently owes China between $17 billion and $19 billion in outstanding loans, creating substantial Beijing leverage over any future economic arrangements.
The political risk profile remains extreme. Venezuela has a documented history of asset expropriations, broken contracts, and failed arbitration payments. International Centre for Settlement of Investment Disputes tribunals awarded ExxonMobil $1.6 billion and ConocoPhillips $8.5 billion for earlier seizures, but Venezuela has not paid the money and ConocoPhillips continues attempting to collect. This track record understandably creates hesitation among institutional investors and corporate boards.
Operational risks compound the political uncertainties. Venezuela suffers from chronic electrical grid failures that interrupt extraction operations. Port infrastructure has degraded significantly. Security concerns range from equipment theft to more serious threats against personnel. The availability of diluents—lighter hydrocarbons needed to transport extra-heavy crude through pipelines—has been severely constrained. Maintaining production of heavy oil requires constant reinvestment, reliable power, and uninterrupted access to diluents, many of which historically came from the U.S. Gulf Coast.
The sovereign debt overhang presents another obstacle. Venezuela defaulted on over $150 billion in external debt obligations. A functioning government seeking international capital market access would need to negotiate comprehensive debt restructuring. PDVSA bonds, which traded as low as single-digit cents on the dollar, have surged on speculation about U.S.-backed restructuring, but recovery rates remain highly uncertain.
For potential investors, the upside scenario is compelling: privileged access to one of the world’s largest petroleum reserves, a government desperate for investment, and possible U.S. political backing. The downside risks are equally dramatic: expropriation, political instability, infrastructure failure, contract violations, and reputational damage from association with a regime that has committed documented human rights violations.
Geopolitical Chessboard: Beijing, Moscow, and the Scramble for Influence
Venezuela has become a focal point for great power competition in the Western Hemisphere, with China and Russia using economic and military engagement to expand influence in what Washington has traditionally considered its strategic backyard.
China’s relationship with Venezuela intensified dramatically under Chávez and continued under Maduro as both ideological alignment and economic pragmatism drove deepening ties. Between 2007 and 2016, China provided Venezuela with approximately $105.6 billion in loans, debt, and capital investments, according to AidData research. This made Venezuela one of China’s largest debtors globally and Beijing’s single most important financial commitment in Latin America.
Of the 900,000 barrels of oil Venezuela exported daily, approximately 800,000 barrels went to China, meaning nearly 90% of Venezuela’s oil was sold to Beijing. This created both dependency and leverage in complex ways. Venezuelan crude helped diversify China’s energy supplies and provided below-market pricing during sanctions. For Venezuela, Chinese purchases offered a critical lifeline when Western markets were closed by sanctions.
Beyond petroleum, Chinese involvement extends across critical infrastructure. Huawei Technologies secured a $250 million contract as early as 2004 to improve Venezuela’s fiber optic infrastructure, which became central to the country’s 4G network, while ZTE developed the Homeland Card national ID system key to citizens accessing state subsidies. Chinese firms also invested heavily in mining operations producing iron ore, bauxite, gold, and rare earth minerals—materials crucial for advanced weapons systems and technology supply chains.
Russia’s engagement has been more military-focused but strategically significant. Moscow has supplied weapons systems, provided military advisors, and allegedly facilitated drone manufacturing facilities on Venezuelan soil. These activities align with broader Russian objectives of contesting U.S. influence in Latin America and demonstrating global reach despite economic constraints.
Iran reportedly established drone manufacturing facilities on Venezuelan soil while Russia deployed military advisers—developments that align closely with threats outlined in Trump’s 2025 U.S. National Security Strategy, which rejects global hegemony for an America First realism. The Trump administration has cited these security concerns as partial justification for its intervention.
For Colombia and Brazil—Venezuela’s largest neighbors—the crisis creates impossible dilemmas. Colombia hosts approximately 2.8 million Venezuelan refugees and migrants, the highest concentration globally. The economic and social pressures on Colombian border regions are immense, with stretched public services, labor market tensions, and security concerns as criminal networks exploit porous borders. Brazil faces similar pressures in its northern states while trying to maintain diplomatic engagement with Caracas.
The Caribbean and Central America also feel Venezuelan dysfunction’s ripple effects. Several smaller nations had depended on Venezuela’s PetroCaribe program for subsidized oil supplies. That program’s collapse forced them to seek alternative energy sources at market prices, straining national budgets. The migration flow through Central America toward the United States has created humanitarian emergencies and diplomatic tensions.
According to Atlantic Council analysis, the U.S. capture of Maduro has paradoxically created both risks and potential opportunities for China—if Washington successfully rebuilds Venezuelan oil production and some flows to China, Beijing might recoup remaining loan balances. This creates perverse incentives where Chinese interests may partly align with U.S. success, despite the geopolitical rivalry.
For OPEC, Venezuela has become an embarrassing member. The country was a founding member alongside Iran, Iraq, Kuwait, and Saudi Arabia, but its influence has waned dramatically as production collapsed. Venezuelan representatives continue attending ministerial meetings, but the country has been unable to meet production quotas and contributes little to cartel strategy.
The Venezuelan People: Beyond the Barrels
While geopolitical players and oil companies calculate their interests, 28 million Venezuelans endure one of the world’s worst humanitarian catastrophes. The scale of suffering is staggering and directly linked to the oil sector’s collapse.
Approximately 7.9 million Venezuelans have fled the country since 2014, making this one of the largest displacement crises globally, with 6.9 million hosted by Latin American and Caribbean countries. This represents roughly 23% of the population—an exodus comparable to Syria’s refugee crisis but occurring without active warfare.
Inside Venezuela, 14.2 million people need humanitarian aid, including 5.1 million facing acute food insecurity, while the minimum wage stands at just $3.60 per month and 90% of the population experiences water shortages. These figures represent catastrophic state failure. Hospitals lack basic medications and equipment. Schools operate sporadically. Even Caracas, the capital, suffers frequent power blackouts.
The economic decline has left nearly 85% of Venezuelans in poverty while 53% live in extreme poverty, with the average monthly salary at $24 while a basic food basket for a family of five costs $500. Hyperinflation, while moderated somewhat from 2018-2019 peaks, continues eroding purchasing power. The local currency, the bolívar, has been redenominated multiple times to remove zeros that became meaningless.
The oil-producing regions tell particularly tragic stories. Zulia state, home to Lake Maracaibo where Venezuela’s petroleum industry began, has seen environmental devastation as poorly maintained infrastructure leaks crude into waterways. The Yanomami indigenous community in the Amazon spanning Venezuela and Brazil has faced dire humanitarian crisis, with over 570 children perishing in less than four years due to malnutrition and malaria on the Brazilian side, partly attributed to invasions by over 20,000 illegal miners.
The migration routes expose desperate people to terrible dangers. In 2023, a record 520,000 migrants crossed the treacherous 60-mile Darién Gap between Panama and Colombia, with Venezuelans making up almost 63% of all migrants, and over 20% of those crossing were children. The journey involves risk of death, human trafficking, sexual violence, dehydration, disease, and extortion by criminal groups controlling routes.
Despite the scale of suffering, international response has been grossly inadequate. Compared with $20.8 billion provided by the international community to address the Syrian refugee crisis in its first eight years, Venezuela received only $1.4 billion over a five-year period—one-tenth the per capita funding. Donor fatigue, the crisis’s protracted nature, and Venezuela’s diplomatic isolation have all contributed to this funding gap.
The fundamental question is whether oil wealth can finally benefit ordinary Venezuelans or if the resource curse will simply acquire new management. Historically, petroleum profits have enriched elites while bypassing most citizens. Analysts estimate that as much as $100 billion was embezzled between 1972 and 1997 alone, during earlier boom periods. Transparency International consistently ranks Venezuela among the world’s most corrupt nations.
For any future scenario to differ from this dismal pattern, robust safeguards would be essential: international revenue transparency mechanisms, independent auditing of oil sales and government expenditures, civil society oversight, opposition political participation, media freedom, and judicial independence. None of these conditions currently exist or appear likely to emerge quickly.
Future Scenarios: Three Pathways
Scenario 1: Managed Transition (Probability: 30%)
In this optimistic scenario, the U.S. brokers a negotiated political settlement that includes reformed Venezuelan governance, international revenue oversight, and coordinated sanctions relief. A multilateral trust fund manages oil proceeds, ensuring transparent allocation to reconstruction, debt service, and social spending. International financial institutions provide bridging support.
Production could gradually increase from current levels of approximately 960,000 barrels per day to 1.5 million within three years and potentially 2 million by 2035, assuming $40-50 billion in capital investment reaches critical infrastructure and operational improvements. Major international oil companies return under production-sharing agreements with clear legal protections. Chinese and Russian interests are either bought out or integrated into new arrangements.
This scenario requires sustained political will in Washington, buy-in from regional partners, acceptance by Venezuelan opposition groups and some Chavista factions, and Chinese pragmatism prioritizing loan recovery over geopolitical positioning. The barriers are formidable but not insurmountable.
Scenario 2: Muddle-Through Malaise (Probability: 50%)
This more likely scenario involves partial sanctions relief but continued political instability, corruption, and underinvestment. Production limps along between 800,000 and 1.2 million barrels per day—enough to generate revenue but insufficient for meaningful economic recovery. Chinese and Russian companies maintain dominant positions while U.S. firms participate cautiously through service contracts rather than major capital commitments.
Infrastructure continues degrading faster than repairs can address. Skilled workers remain abroad or retire without replacement. Revenue leakage through corruption persists. The humanitarian crisis moderates slightly as remittances from diaspora populations and modest economic activity provide survival income, but poverty remains widespread.
Political gridlock prevents structural reforms. The installed interim government lacks legitimacy and capacity. Elections, if held, produce disputed results. International attention wanes after initial intervention headlines fade. Venezuela stabilizes at a low equilibrium—neither recovering nor completely collapsing, but remaining broken indefinitely.
Scenario 3: Chaotic Deterioration (Probability: 20%)
In this worst-case scenario, the U.S. intervention fails to establish stable governance. Political fragmentation leads to regional power centers, potentially including armed groups controlling oil-producing areas. Production drops below 500,000 barrels per day as infrastructure fails catastrophically and security deteriorates.
Regional spillover intensifies. Colombia and Brazil face expanded migration flows and cross-border violence. Caribbean nations experience refugee waves overwhelming their limited capacities. Drug trafficking and oil smuggling networks expand into governance vacuums.
International responses fragment. China and Russia pursue separate engagements with whoever controls productive assets. The U.S. becomes entangled in stabilization efforts that prove far more costly and protracted than anticipated—an “oil quagmire” rather than the swift success initially projected.
Heavy crude markets experience significant disruption as Venezuelan barrels disappear from supply chains. Refineries configured for Venezuelan crude face either expensive reconfiguration or sustained margin compression. Oil prices experience sharp volatility as markets price conflict risk and supply uncertainty.
Conclusion: The Paradox Persists
Venezuela’s fundamental paradox—immense petroleum wealth coexisting with profound dysfunction—remains unresolved despite dramatic U.S. intervention. The nation sits atop more proven oil reserves than Saudi Arabia yet produces less crude than Ecuador. It possesses geological advantages that should fund prosperity but has instead delivered misery to millions.
Trump’s pivot from ideological regime change to transactional resource extraction represents a starkly different approach than the maximum pressure campaign of recent years. Whether this proves more effective depends critically on implementation details still being improvised. Can Washington navigate the complex politics of installing legitimate governance? Will oil companies risk billions without clear legal frameworks? Can infrastructure be rebuilt while preventing corruption from devouring investment? Will ordinary Venezuelans finally benefit from their country’s oil, or will new management extract wealth just as previous regimes did?
The historical record counsels skepticism. Petrostates face inherent governance challenges that transcend individual leaders or political systems. The resource curse has proven remarkably persistent across diverse contexts. Venezuela’s specific history—of corruption, Dutch disease economics, state capacity erosion, and polarized politics—suggests that even with American backing and industry expertise, recovery will be measured in years and decades, not months.
For investors, the risk-reward calculation depends entirely on time horizon and risk tolerance. Short-term traders may find volatility profitable. Long-term strategic players might accept elevated risk for privileged access to reserves. Most institutions will likely wait for clearer political and legal frameworks before committing substantial capital.
For policymakers, Venezuelan oil’s significance extends beyond energy supply. It represents a test case for resource-rich failed states, great power competition in developing regions, and the limits of external intervention in sovereign nations. Success or failure will influence approaches to similar challenges elsewhere.
For Venezuelans—those who remained and the nearly 8 million who fled—oil has brought far more curse than blessing. The coming months and years will determine if this generation finally sees petroleum wealth translate into healthcare, education, infrastructure, and opportunity, or if the prize beneath the chaos remains forever just beneath reach, enriching outsiders while impoverishing locals.
Key dates to watch: quarterly U.S.-Venezuela production reports, PDVSA financial disclosures, international debt restructuring negotiations, regional migration statistics, OPEC ministerial meetings addressing Venezuelan quota allocations, and most critically, any signals of transparent revenue management mechanisms taking root. Without the last element, all the technical expertise and capital investment in the world will simply fuel the same old extraction—of Venezuela’s oil and of Venezuelans’ hopes.
Discover more from The Economy
Subscribe to get the latest posts sent to your email.


How once-unimaginable catastrophes become baseline assumptions
There is a particular kind of hubris that infects markets in the long stretches between catastrophes. Volatility compresses. Risk premia decay. The insurance gets quietly cancelled because it hasn’t paid out in years and the premiums feel like wasted money. Then the disaster arrives — not as a distant rumble but as a wall of water — and the entire analytical framework investors have spent years constructing turns out to have been a map of the wrong country.
We are living through one of the most instruction-rich moments in modern financial history. Since February 28, 2026, when the United States launched military operations against Iran and Tehran responded by closing the Strait of Hormuz, markets have been running a live masterclass in catastrophe pricing. West Texas Intermediate crude surged from $67 to $111 per barrel in under a fortnight — the fastest oil spike in four decades. War-risk insurance premiums on shipping through the Gulf soared more than 1,000 percent. The S&P 500 lost 5 percent in a single week, and the ECB and Bank of England are now staring down a renewed tightening scenario they spent the first quarter of 2026 insisting was off the table.
And yet — and this is the part that should make every portfolio manager uncomfortable — the analytical mistakes driving losses right now are not new. They are the same six structural errors investors have made in every previous crisis. Understanding them, really understanding them, is not an academic exercise. It is the difference between surviving the next disaster and being liquidated by it.
Key Takeaways at a Glance
- Markets price first-order disaster impacts; second- and third-order cascades are systematically underpriced
- Volatility is information; price-discovery failure is the true systemic risk — monitor private-to-public valuation spreads
- Tight CAT bond spreads signal capital crowding, not benign risk — use compression as a contrarian indicator
- Emerging market currencies and credit spreads lead developed-market pricing of global disasters
- Geopolitical risk premia decay faster than structural damage — separate the transitory from the permanent
- The best time to buy tail protection is when every indicator says you do not need it
Lesson One: Markets price the disaster they know, not the one that is compounding behind it
The economics of disaster pricing contain a fundamental asymmetry. Markets are reasonably good at incorporating a known risk — geopolitical tension, elevated VIX, stretched valuations — into current prices. What they catastrophically underprice is the second-order cascade that no single model captures.
Consider what the Hormuz closure actually detonated. Yes, oil went to $111 per barrel. Obvious. What was less obvious: the inflation feedback loop that forced investors to reprice central bank paths they had already discounted as settled. The Federal Reserve was expected to hold rates in 2026; futures now assign a 74 percent probability it does not cut at all this year. Europe’s energy import dependency made the ECB’s position worse. That transmission — from oil shock to rate-repricing to credit stress to equity multiple compression — is a chain, not a point event. Most risk models price the first link.
The academic framework for this is well established but rarely operationalised. The NBER disaster-risk literature, particularly Wachter (2013) and Barro (2006), argues that rare disasters produce risk premia that appear irrational in calm periods but are in fact the rational price of tail exposure across long time horizons. What these models miss, however, is that real-world disasters rarely arrive as clean, isolated point events. They arrive as cascades. The COVID-19 pandemic was not just a health shock — it was simultaneously a supply-chain shock, a demand shock, a sovereign-debt shock, and a labour-market restructuring shock. The Hormuz closure is not just an oil shock. It is an inflation shock, a monetary policy shock, a EM balance-of-payments shock, and an AI-investment sentiment shock, all at once.
Key takeaway: Map not just the primary disaster scenario but every second- and third-order transmission mechanism it activates. The primary impact is already partially in the price. The cascades are not.
Lesson Two: The real crisis is not volatility — it is the collapse of price discovery
Scott Bessent, the US Treasury Secretary, said something in March 2026 that deserves to be read not as politics but as a precise financial concept. Asked what genuinely frightened him after 35 years in markets, Bessent answered: “Markets go up and down. What’s important is that they are continuous and functioning. When people panic is when you’re not able to have price discovery — when markets close, when there is the threat of gating.”
Volatility is information. A price moving sharply up or down is a market doing exactly what it should: integrating new signals, adjusting expectations, clearing. The true systemic catastrophe is not a 10 percent drawdown. It is the moment when buyers and sellers can no longer find each other at any price — when the mechanism that produces prices breaks entirely.
This is not theoretical. Private credit markets are currently exhibiting exactly this dynamic. US BDCs — business development companies that provide credit to mid-market companies — have seen share prices fall 10 percent and trade 20 percent or more below their latest stated NAVs. Alternative asset managers that collect fees from these vehicles are down more than 30 percent. The public market is rendering a verdict on private valuations that the private market itself cannot yet deliver, because the private marks have not moved. There is no continuous clearing mechanism. There is no daily price discovery. There is only the last funding round — which is a negotiated fiction, not a price.
Investors who understand this distinction can do something useful with it: treat the spread between public-market pricing and private-market marks as a real-time fear gauge. When that gap widens sharply, the market is not panicking irrationally. It is pricing the absence of price discovery itself.
Key takeaway: Distinguish between volatility (information-rich, manageable) and price-discovery failure (structurally dangerous, contagion-prone). Monitor private-to-public valuation spreads as a leading indicator of the latter.
Lesson Three: Catastrophe bond complacency is always a warning, never a reassurance
In February 2026, Bloomberg reported that catastrophe-bond risk premia had fallen to levels not seen since before Hurricane Ian struck Florida in 2022. The cause was a surge of fresh capital chasing ILS yields. Managers called it a healthy market. A more honest reading is that it was a market pricing the wrong risk for the wrong reasons.
Here is the structural problem with catastrophe bonds, and indeed with most insurance-linked securities: the risk premium is set by the supply of capital chasing the trade, not by the true probability distribution of the underlying disaster. When capital floods in — as it has, driven by institutional allocators seeking uncorrelated returns — spreads compress regardless of whether the actual hurricane, flood, or geopolitical catastrophe risk has changed. The academic literature on CAT bond pricing, including recent work in the Journal of the Operational Research Society, confirms that cyclical capital flows consistently distort the risk-neutral pricing of catastrophe events.
The counter-intuitive lesson: when CAT bond spreads are tightest, protection is cheapest to buy and most expensive to have sold. The compression that looks like market efficiency is often capital crowding masquerading as a risk assessment. A catastrophe-bond market trading at pre-Ian yields six months before an Iran-driven energy crisis was not a serene market. It was a complacent one.
Key takeaway: Use catastrophe-bond spread compression not as a signal of benign risk conditions but as a contrarian indicator of under-priced tail exposure. Buy protection when it is cheap; do not sell it because it is cheap.
Lesson Four: Emerging markets absorb the shock first — and price it most honestly
There is a geographic hierarchy to disaster pricing that sophisticated global investors routinely ignore. When a major geopolitical or macro catastrophe detonates, the signal appears first in emerging market currencies, credit spreads, and energy import bills — not in the S&P 500 or the Dax. This is not because EM markets are more efficient. It is because they have less capacity to absorb shocks and therefore less incentive to pretend the shock is temporary.
The Hormuz closure is a case study. Developed-market investors spent the first week debating whether oil at $111 per barrel was “priced in.” Meanwhile, Gulf states were issuing precautionary production-cut announcements and Middle Eastern shipping had effectively ceased. Economies in South and Southeast Asia — which import 80 percent or more of their petroleum needs — faced simultaneous currency pressure (oil is dollar-denominated), fiscal pressure (fuel subsidies explode), and inflation pressure (food and transport costs surge). Countries like Pakistan, Sri Lanka, and Bangladesh were pricing a recession before most DM economists had updated their Q1 2026 forecasts.
The BIS research on disaster-risk transmission across 42 countries documents precisely this dynamic: world and country-specific disaster probabilities co-move in complex, non-linear ways. When global disaster probability rises, EM asset prices move first and fastest. For a DM investor, this is an early-warning system hiding in plain sight.
Key takeaway: Monitor EM currency indices, sovereign credit spreads, and fuel import data as leading indicators of how the global market is actually pricing a disaster — before the consensus in New York or London has caught up.
Lesson Five: Geopolitical risk premia have a half-life problem — and it is shorter than you think
Markets are extraordinarily good at normalising the catastrophic. This is not a character flaw; it is a survival mechanism. But for investors, the normalisation of extreme risk is one of the most financially treacherous dynamics in markets.
Consider the structural pattern Tyler Muir documented in his landmark paper Financial Crises and Risk Premia: equity risk premia collapse by roughly 20 percent at the onset of a financial crisis, then recover by around 20 percent over the following three years — even when the underlying structural damage persists. Wars display an even more dramatic version of this pattern. The initial shock is priced aggressively. But as weeks become months, the equity market begins to discount the conflict as background noise, even if oil remains $20 per barrel above pre-war levels and inflation continues to compound.
This half-life problem cuts in two directions. On the way in: investors are often too slow to price a new geopolitical risk, underestimating how durable its effects will be. On the way out: investors often reprice risk premia too quickly back to baseline, treating a structural change in the global system as if it were a weather event that has now passed. The Strait of Hormuz may reopen. But global shipping has permanently re-priced war-risk. Sovereign wealth funds in the Gulf are permanently reconsidering their US dollar reserve holdings. Indian and Japanese energy policymakers are permanently accelerating domestic diversification. These structural changes do not vanish when the headline risk premium fades.
Key takeaway: When pricing geopolitical disasters, separate the acute risk premium (which will fade) from the structural repricing (which will not). The former is a trading signal. The latter is an asset allocation decision that most portfolios have not yet made.
Lesson Six: The moment you feel safest is precisely when you are most exposed
The final lesson is the most counter-intuitive, and arguably the most important. There is a specific period in any market cycle — often 18 to 36 months after the previous crisis — when the cost of tail protection is at its cheapest, investor confidence is high, and catastrophe risk feels entirely theoretical. This is exactly when the next disaster is being loaded.
We can locate this period with precision in the current cycle. In early 2026, the CAPE ratio on US equities reached 39.8, its second-highest reading in 150 years. The Buffett Indicator (total market cap to GDP) hovered between 217 and 228 percent — historically associated with the period immediately before major corrections. CAT bond spreads were at post-Ian lows. VIX had compressed back to mid-teens. Private-credit redemption queues were elevated but not yet alarming. And the macroeconomic consensus — including, notably, within the US Treasury — was that tariff-driven inflation would prove transitory and that central banks would be cutting before mid-year.
Every one of those conditions has now reversed. The reversal took six weeks.
The academic literature on learning and disaster risk, particularly the Kozlowski, Veldkamp, and Venkateswaran (2020) framework on “scarring” from rare events, finds that markets systematically underestimate disaster probability in long stretches without disasters, then over-correct sharply when one arrives. This is not irrationality in the pejorative sense — it is Bayesian updating in the presence of genuinely ambiguous information. But the practical implication is stark: the time to buy disaster insurance is not after the disaster has arrived and the VIX has spiked to 45. It is in the quiet months when every indicator says you don’t need it.
Key takeaway: Maintain systematic, rule-based disaster hedges that do not depend on a real-time catastrophe forecast. The moment it feels unnecessary to hold tail protection is the moment the portfolio is most exposed to needing it.
The Synthesis: From Lessons to Portfolio Architecture
These six lessons converge on a single architectural principle: disaster pricing is not a moment-in-time forecast exercise. It is a permanent structural feature of portfolio construction.
The real mistake — the one that has cost investors dearly in 2020, in 2022, and again in 2026 — is not failing to predict the next disaster. It is believing that markets have already priced it in. The history of catastrophe pricing teaches us, with brutal consistency, that they have not. The cascade is underpriced. The price-discovery failure is unmodelled. The CAT bond spread is supply-driven, not risk-driven. The EM signal is ignored. The geopolitical risk premium is given a shorter half-life than the structural damage it caused. And the tail hedge is cancelled precisely when it is most needed.
The investors who will outperform across the full cycle are not those who predicted the Hormuz closure or the tariff escalation or the next crisis that has not yet been named. They are those who understood that unpriceable disasters are not unpriceable because they are impossible to imagine. They are unpriceable because the incentive structures of the investment industry consistently penalise the premiums required to hedge them.
That gap between what disasters cost and what markets charge for protection is not a market inefficiency. It is the most durable alpha in finance. Learning to harvest it is, in the deepest sense, the only lesson that matters.
Discover more from The Economy
Subscribe to get the latest posts sent to your email.

There was a moment, somewhere in the fog of mid-2025, when the prevailing consensus on Wall Street and in the marble corridors of multilateral institutions was something close to dread. U.S. tariffs had mushroomed into the most aggressive trade barriers since Smoot-Hawley. Shipping lanes were fractured. Geopolitical fault lines — in the Middle East, in the Taiwan Strait, across the ruins of eastern Ukraine — had not so much deepened as multiplied. The prophets of doom were well-provisioned with data. And yet, here we are. The global economy, battered and limping, is still standing — and in certain respects, walking rather faster than feared.
This is not a triumphalist story. The global economy more resilient than feared narrative deserves neither uncritical celebration nor smug vindication. What it demands is honest, clear-eyed examination. Why did the worst not happen? What forces absorbed the blows? And — most critically — does the resilience we are witnessing reflect structural strength, or is it a borrowed grace, a temporary reprieve before deeper reckonings arrive?
The numbers, for now, tell a story of surprising steadiness. The IMF’s January 2026 World Economic Outlook projects global growth at 3.3 percent for 2026 and 3.2 percent for 2027 — a small but meaningful upward revision from October 2025 estimates. IMF Managing Director Kristalina Georgieva, speaking at Davos in January 2026, called this outcome “the biggest surprise” — a remarkable concession from the head of the institution whose job it is, partly, to anticipate exactly this. Meanwhile, the UN Department of Economic and Social Affairs estimated 2025 global growth at 2.8 percent, better than expected given the tariff storm that rolled through international trade. The OECD, for its part, subtitled its December 2025 Economic Outlook “Resilient Growth but with Increasing Fragilities” — a formulation that is, in its cautious way, almost poetic.
The Four Pillars of an Unlikely Resilience
So what happened? Why didn’t it break?
1. The Private Sector Adapted Faster Than Governments Could Fragment
Perhaps the single most underappreciated force in the global economy’s durability is the sheer agility of the private sector. Georgieva at Davos was blunt about it: globally, governments have stepped back from running companies, and the private sector — “more adaptable, more agile” — has filled the void. When tariffs on certain trade corridors spiked, supply chains did not collapse so much as reroute. Manufacturers diversified sourcing from China to Vietnam, Mexico, and India. Companies front-loaded exports ahead of anticipated barriers, producing a short-term trade surge that buffered 2025 GDP figures across multiple economies. The OECD noted that global growth continued at a resilient pace, driven in part by the front-loading of trade in anticipation of higher tariffs earlier in the year, alongside strong AI investment and supportive macroeconomic policies.
This is, of course, a partial answer. Front-loading is not structural growth — it borrows demand from the future. But it bought time, and time, in economics, is often everything.
2. Technology Investment as the New Growth Engine
The second pillar is one that carries both the greatest promise and the most dangerous ambiguity: the relentless surge in artificial intelligence and broader information technology investment. The IMF’s analysis identified continued investment in the technology sector — especially AI — as a key driver of resilience, acting as “a very powerful driver of growth and potentially prosperity”. The OECD’s data underscores the geography of this boom: AI-related trade now accounts for roughly 15.5 percent of total world merchandise trade, with two-thirds of that originating in Asia. Tech exports from Korea and Chinese Taipei continued rising into late 2025. In the United States, the numbers are almost surreal: strip out AI-related investments, and U.S. GDP contracted slightly in the first half of 2025.
This tells you something important. The global economy’s resilience in 2025–26 is, in significant measure, a tech-sector story. It is a story concentrated in a handful of companies, a handful of geographies, and a single technological paradigm. That concentration is both the source of its power and the root of its fragility — a point we will return to.
3. Monetary and Fiscal Policy Did Not Drop the Ball
History will be reasonably kind to the monetary policymakers of this era — not because they were brilliant, but because they did not, on balance, panic. Central banks that had raised rates aggressively through 2022–23 began easing with measured care as inflation declined. Global headline inflation fell from 4.0 percent in 2024 to an estimated 3.4 percent in 2025, with further moderation projected toward 3.1 percent in 2026. This easing in price pressures gave central banks room to cut, which in turn supported financial conditions, credit availability, and investment flows. The IMF noted that “accommodative financial conditions” were among the key offsetting tailwinds to trade disruptions.
Fiscal policy, too, surprised — though not without cost. Governments spent. Defence budgets expanded. Industrial policy packages — from the remnants of U.S. clean energy subsidies to the EU’s Recovery and Resilience Facility — continued channelling public money into capital formation. The bill, of course, is accumulating. But in 2025 and into 2026, fiscal firepower helped absorb shocks that might otherwise have cascaded.
4. Emerging Market Resilience Held the Global Average
The fourth pillar is often underweighted in Western commentary: the developing world, especially in Asia, continued to grow. South Asia is forecast to expand 5.6 percent in 2026, led by India’s 6.6 percent expansion, driven by resilient consumption and substantial public investment. Africa is projected at 4.0 percent. These are not trivial numbers. When commentators in New York or London describe the global economy as “resilient,” they are describing an aggregate that is substantially upheld by hundreds of millions of consumers and workers in economies whose stories rarely make the front page of financial newspapers. The heterogeneity is stark: the OECD bloc muddles along; the emerging world, in many places, runs.
The Data Beneath the Headlines: A Comparative Snapshot
| Institution | 2025 Global Growth | 2026 Forecast | Key Drivers Cited |
|---|---|---|---|
| IMF (Jan 2026) | 3.3% | 3.3% | AI investment, fiscal/monetary support, private sector agility |
| OECD (Dec 2025) | 3.2% | 2.9% | Front-loading, AI trade, macroeconomic policy |
| UN DESA (Jan 2026) | 2.8% | 2.7% | Consumer spending, disinflation, EM domestic demand |
The discrepancies in headline figures reflect genuine methodological differences — purchasing power parity weighting, country coverage, base year choices. But the directional consensus is unmistakable: the world grew more in 2025 than it was expected to when tariff escalation peaked. That is a fact worth sitting with.
Why the Resilience Is Under-Appreciated (and Why That Matters)
Here is an inconvenient truth about economic discourse: bad news travels faster, and fear is more monetisable than optimism. The financial media ecosystem is structurally incentivised to amplify downside scenarios. The think tanks that warned loudest about a tariff-induced recession in 2025 are not, by and large, issuing prominent corrections.
This matters because misread resilience breeds misguided policy. If policymakers believe the economy is weaker than it actually is, they over-stimulate — running up debt, inflating asset prices, postponing necessary reforms. If investors believe fragility is the baseline, they underallocate capital to productive long-term investments in favour of short-term hedging. Getting the diagnosis right is not academic; it shapes behaviour, and behaviour shapes outcomes.
The IMF noted that the trade shock “has not derailed global growth” and that global economic growth “continues to show considerable resilience despite significant trade disruptions caused by the US and heightened uncertainty”. Georgieva’s “biggest surprise” framing is telling: even the IMF, with all its modelling resources, did not anticipate the degree of offset. That should prompt a certain epistemic humility about our collective ability to forecast economic shocks — and perhaps a corresponding caution about declaring the worst inevitable next time.
The Fragilities That Resilience Is Masking
And yet. Here is where intellectual honesty demands a sharp turn.
The IMF warned explicitly that the current resilience “masks underlying fragilities tied to the concentration of investment in the tech sector,” and that “the negative growth effects of trade disruptions are likely to build up over time.” The OECD’s subtitle — “Resilient Growth but with Increasing Fragilities” — deserves to be read in full, not just the first half. There are at least five structural vulnerabilities that the headline growth numbers obscure.
The AI Bubble Risk Is Real and Underpriced
The same technology boom that is holding up the global economy today could become its undoing if expectations are not met. The IMF cautioned explicitly about the risk of a correction in AI-related valuations, warning that if tech firms fail to “deliver earnings commensurate with their lofty valuations,” a correction could trigger lower-than-expected growth and productivity losses. The OECD echoes this: weaker-than-expected returns from net AI investment could trigger widespread risk repricing in financial markets, given stretched asset valuations and optimism about corporate earnings.
Strip out AI investment from U.S. GDP and the economy contracted in early 2025. That is a remarkable statement of concentration risk, and it deserves to be said plainly: a significant portion of what we are calling “global resilience” is a bet on AI productivity gains materialising at scale, on schedule. That bet may be correct. It may also be the largest speculative bubble since the dot-com era, dressed in more sophisticated clothes.
Public Debt Is a Ticking Clock
Governments spent their way through the pandemic, then through the inflation crisis, then through the tariff shock. The fiscal bills are accumulating. The OECD flagged that high public spending pressures from rising defence requirements and population ageing are increasing fiscal risks, while NATO countries plan to raise core military spending to at least 3.5% of GDP by 2035. The IMF maintains that governments still have “important work to do to reduce public debt to safeguard financial stability.” None of this is new, but the accumulation of deferred reckoning is reaching levels where the next shock — a pandemic, a financial crisis, a major military conflict — will find fiscal buffers meaningfully depleted.
Geopolitical Fragmentation Has Not Stabilised
The Strait of Hormuz, through which roughly a fifth of global oil supply normally flows, saw shipping traffic fall 90 percent during a fresh Middle East escalation. The IMF’s Georgieva warned that if the new conflict proves prolonged, it has “clear and obvious potential to affect market sentiment, growth, and inflation”. For Japan alone, close to 60 percent of oil imports transit through the strait. For Asia broadly, the exposure is existential in energy security terms. The tariff wars between the U.S. and China have eased somewhat from their 2025 peaks, but the WTO’s Director-General has warned that a full U.S.-China economic decoupling could reduce global output by 7 percent in the long run — a figure that dwarfs any AI productivity upside currently modelled.
Inequality Is Widening, Not Narrowing
The resilience of the global aggregate conceals a distributional disaster. The UN Secretary-General António Guterres noted that “many developing economies continue to struggle and, as a result, progress towards the Sustainable Development Goals remains distant for much of the world”. High prices continue to erode real incomes for low- and middle-income households across the globe, even as headline inflation falls. AI productivity gains, where they materialise, are accruing disproportionately to capital owners and highly skilled workers in a handful of advanced economies. The Davos consensus on AI-as-equaliser remains aspirational, not empirical.
Supply Chain Concentration Has Not Been Solved
The pandemic briefly sensitised policymakers to the fragility of hyper-concentrated global supply chains. Yet China still accounts for more than 50 percent of all rare earth mining and lithium globally, and more than 90 percent of all magnet manufacturing and graphite. These are not peripheral materials — they are the physical substrate of the AI economy, the clean energy transition, and modern defence systems. A single supply disruption event here would cascade through semiconductors, electric vehicles, wind turbines, and data centres simultaneously. The diversification rhetoric remains largely rhetoric.
What Genuine Resilience Would Actually Look Like
Reading the data carefully, one is struck by the difference between resilience as a condition and resilience as a strategy. What the global economy has demonstrated since 2022 is resilience of the first kind: absorption capacity, improvisational agility, the ability to muddle through. What it has not yet demonstrated is resilience of the second kind: the deliberate construction of buffers, the investment in systemic redundancy, the political willingness to accept short-term costs for long-term stability.
Georgieva’s injunction at Davos — “learn to think of the unthinkable, and then stay calm, adapt” — is good personal advice. As a framework for global economic governance, it is insufficient. Here, then, is what bold, prescription-level thinking demands:
1. A Multilateral AI Investment Framework. The AI boom cannot continue to be managed as a purely national or corporate phenomenon. A framework housed at the WEF or the OECD should establish shared standards for AI investment disclosure, productivity accounting, and systemic risk assessment. If AI is indeed driving 15 percent of world merchandise trade, it deserves the kind of multilateral oversight that financial instruments won — slowly, imperfectly — after 2008.
2. Coordinated Fiscal Consolidation Timelines. The IMF’s calls for debt reduction need to be backed by credible multilateral timelines, not just bilateral conditionality. A G20-level framework that sequences fiscal consolidation against growth indicators — rather than imposing austerity into downturns — would give markets clearer signals while protecting public investment in strategic sectors.
3. Strategic Supply Chain Diversification, Funded Publicly. The World Bank and regional development banks should establish dedicated financing windows for critical minerals diversification and processing capacity outside current concentration zones. This is not protectionism — it is systemic risk management, and it is overdue.
4. A Green and Digital Investment Compact for the Global South. The differential between 6.6 percent growth in India and negative growth in parts of sub-Saharan Africa is not inevitable — it reflects infrastructure deficits and financing gaps that multilateral institutions have the tools, if not always the will, to address. The UN DESA report is explicit: without stronger policy coordination, today’s pressures risk locking the world into a lower-growth path, with developing nations shouldering a disproportionate share of the pain.
5. Central Bank Independence as a Non-Negotiable. The IMF has stressed that central bank independence remains critical for both price stability and credibility. In an era when political leaders are increasingly tempted to subordinate monetary institutions to short-term electoral calculations — particularly around the inflation-tariff nexus — this point deserves repetition, loudly, without apology.
The Verdict: Resilient, But Not Invulnerable
Let us be precise about what the evidence shows. The global economy has absorbed, without breaking, a series of shocks that would have qualified as catastrophic by pre-pandemic standards. It has done so through a combination of technological investment, fiscal and monetary firepower, private sector adaptability, and the sheer demographic and economic weight of emerging economies continuing to grow. This is genuinely impressive. It should not be dismissed.
But resilience in a storm is not the same as being sea-worthy. The hull is holding — for now. The debt levels are high and rising. The geopolitical weather is worsening. The AI boom is either the most transformative force since the industrial revolution or the most dangerous speculative bubble since tulips, and the honest answer is that we do not yet know which. As the IMF’s own blog put it in January 2026, the challenge for policymakers and investors alike is “to balance optimism with prudence, ensuring that today’s tech surge translates into sustainable, inclusive growth rather than another boom-bust cycle.”
Georgieva’s injunction rings true: “We need to not only understand why it is resilient, but nurture this resilience for the future.” That is the work that has not yet been done. The economy has surprised us. The question is whether we are surprised enough to actually change course — or whether, as so often in history, relief becomes complacency, and complacency becomes the seed of the next crisis.
The global economy is more resilient than we feared. It is less resilient than we need it to be. That gap — between the relief of today and the demands of tomorrow — is the most important space in contemporary economic policy. Filling it requires not optimism alone, nor pessimism, but something rarer and more valuable: clarity.
📊 Key Growth Forecasts at a Glance (2025–2027)
| Economy | 2025 (Est.) | 2026 (Forecast) | 2027 (Forecast) |
|---|---|---|---|
| World (IMF) | 3.3% | 3.3% | 3.2% |
| World (UN DESA) | 2.8% | 2.7% | 2.9% |
| World (OECD) | 3.2% | 2.9% | 3.1% |
| United States | ~1.9–2.0% | 2.0–2.4% | 1.9–2.0% |
| China | 5.0% | 4.4–4.5% | 4.3% |
| Euro Area | 1.3% | 1.2–1.3% | 1.4% |
| India | ~6.3% | 6.3–6.6% | 6.5% |
| Japan | 1.1–1.3% | 0.7–0.9% | 0.6–0.9% |
Sources: IMF WEO January 2026; OECD Economic Outlook December 2025; UN DESA WESP 2026
Discover more from The Economy
Subscribe to get the latest posts sent to your email.
Analysis
Iran’s Real Weapon Is the World Economy: How Missiles, Drones, Mines and Selective Maritime Disruption Are Reshaping Global Risk

When the White House quietly confirmed that US President Donald Trump would travel to Beijing on May 14 to 15, rescheduling a summit previously derailed by the sudden outbreak of the Iran war on February 28, it was more than a mere scheduling adjustment. It was a stark geopolitical admission. The delay revealed that this conflict in the Middle East is now structurally vast enough to disrupt the calendars of great powers, distort global markets, and force governments thousands of miles from the Persian Gulf to urgently rethink energy security, inflation, and supply-chain resilience.
For decades, military analysts have war-gamed a clash between Washington and Tehran through the sterile lens of conventional military metrics: ship counts, sortie rates, and air defense batteries. But as the events of the past month have demonstrated with chilling clarity, the central question of this conflict is no longer whether Iran can defeat the United States or Israel conventionally. They cannot, and they know it.
The real question is whether Tehran can make the economic price of continuing the war too high, too global, and too prolonged for the West to ignore. We are witnessing a masterclass in asymmetric warfare where Iran’s real weapon is the world economy. By deploying low-cost, high-impact tools, Tehran is proving that missiles, drones, mining threats and selective maritime disruption can be enough to make insurers, traders, shipowners and governments reprice risk across the entire globalized system.
Iran’s strategy is a meticulously calibrated economic coercion. Tehran is exploiting a rare combination of geography, target concentration and asymmetric tools to hold the global economic recovery hostage. And so far, the financial markets are proving them right.
The New Paradigm: Iran Asymmetric Economic Warfare
To understand the genius—and the terror—of Iran’s current playbook, one must discard the 20th-century notion that wars are won by destroying the enemy’s military formations. In a hyper-connected, hyper-optimized global economy, a nation does not need to sink a fleet to achieve strategic parity; it merely needs to make the cost of transit commercially unviable.
This is the essence of Iran asymmetric economic warfare. By utilizing swarms of cheap loitering munitions, unmanned surface vessels, and the persistent, invisible threat of naval mines, Tehran has fundamentally altered the cost-benefit analysis of navigating the world’s most critical maritime chokepoints. A $20,000 drone does not need to sink a $150 million Very Large Crude Carrier (VLCC) carrying $100 million worth of oil. It only needs to scorch its deck to trigger a systemic panic in the underwriting rooms of London and New York.
Tehran understands the fragility of the maritime arteries that sustain modern capitalism. This is why the recent entrance of Yemen’s Houthis into the broader conflict is so destabilizing. We are no longer looking at an isolated crisis in the Strait of Hormuz; we are facing a dual-chokepoint strangulation encompassing both Hormuz and the Bab el-Mandeb Strait. By targeting commercial vessels selectively—and reportedly floating a mafia-style “$2 million-per-ship fee” for guaranteed safe passage—Iran and its proxies are effectively levying a private tax on global trade.
This is not a traditional blockade. It is a protection racket scaled to the size of the global economy. Through Iran missiles drones mining global supply chains, Tehran is executing a strategy designed not to win a military victory, but to inflict a political and economic pain threshold that forces a diplomatic capitulation.
Repricing the Gulf: Iran Maritime Disruption Insurance
The immediate frontline of this new war is not the flight deck of a US aircraft carrier; it is the actuarial spreadsheets of global maritime insurers. The Strait of Hormuz disruption 2026 is triggering a seismic shift in how risk is priced, bought, and sold.
Prior to February 28, an estimated 20% of global oil consumption—roughly 21 million barrels per day—transited the Strait of Hormuz. Today, that volume has contracted sharply as shipping companies route around the cape or pause voyages entirely. For those that dare the passage, the financial toll is staggering. War-risk insurance premiums have skyrocketed, surging from a fraction of a percent of a vessel’s value to unsustainable single-digit percentages practically overnight.
As the Financial Times notes in its analysis of maritime risk, when Gulf shipping risk insurers repricing occurs at this velocity, the costs are immediately passed down the supply chain. Iran maritime disruption insurance is no longer a niche concern for shipping magnates; it is a direct inflationary tax applied to every commodity, manufactured good, and barrel of oil moving between East and West.
Data Visualization Context: [Chart: Oil Price Trajectory vs. Shipping Volumes Through Hormuz & Bab el-Mandeb Since Feb 28] – A diverging line graph illustrating the inverse relationship between plunging daily vessel transits in the Gulf and the sharp, unbroken ascent of Brent Crude prices crossing the $100 threshold.
This dynamic forces a profound recalibration of what constitutes “risk.” A shipowner looking at a 500% increase in war-risk premiums must decide if the cargo is worth the financial gamble. When the answer is no, vessels sit idle, supply chains freeze, and the global economy chokes. This is precisely what the architects in Tehran intended.
The Macro Shock: Inflation, Oil Trajectories, and Fed Paralysis
The ripple effects of this strategy are already crashing onto the shores of Western central banks. The Iran war oil prices impact has been immediate and violent. With US crude settling above the $100 mark and Brent eyeing a record monthly rise, the specter of the 1970s oil shocks has returned to haunt policymakers. The International Energy Agency (IEA) has already sounded the alarm, warning that we are teetering on the edge of the “largest supply disruption in history” if the conflict broadens to regional oil infrastructure.
This energy shock arrives at the worst possible macroeconomic moment. Just as the US Federal Reserve and the European Central Bank believed they had tamed the post-pandemic inflation dragon, the Gulf crisis has reignited price pressures. Federal Reserve Chair Jerome Powell recently signaled a “wait and see” approach regarding the war’s economic fallout, a subtle admission that the central bank is trapped. Raising interest rates to combat oil-driven inflation risks plunging the global economy into a deep recession; holding them steady risks allowing inflation to become entrenched.
The Economist recently highlighted the resurgence of stagflation fears, pointing out that a prolonged conflict exceeding three months will inevitably lead to deep macroeconomic scarring. By weaponizing the oil markets, Iran has effectively bypassed the Pentagon and launched a direct strike on the Federal Reserve. This is the zenith of Iran calibrated economic coercion 2026: forcing Western leaders into impossible domestic political dilemmas.
Target Concentration: The Outsized Impact on Asian Economies
While the geopolitical theater is fixated on the Washington-Tehran dynamic, the true economic victims of this asymmetric warfare reside in the East. The Strait of Hormuz closure economic impact on Asia cannot be overstated. The economies of China, Japan, India, and South Korea are fundamentally reliant on Middle Eastern crude and liquefied natural gas (LNG).
Tehran’s strategy capitalizes heavily on this “target concentration.” The overwhelming majority of the oil flowing through Hormuz is destined for Asian markets. Consequently, the disruption serves as a blunt instrument of leverage against the very nations that historically maintain neutral or even amicable relations with Iran.
The real-time fallout across the Indo-Pacific is stark. In Singapore, households are already facing immediate electricity tariff hikes for the April-June quarter, with the Energy Market Authority warning of sharper increases to come. Major logistics hubs are feeling the squeeze, with companies like Yeo Hiap Seng cutting headcount and moving operations to navigate the margin crush. Supply chains are fraying; luxury cars destined for Asian markets are stranded in Sri Lankan ports as Japanese shipping companies face paralyzing congestion.
To mitigate the crisis, Asian powers are scrambling for alternatives. Japan is hastily coordinating with Indonesia to secure thermal coal as a fallback for power generation, risking its climate commitments in the name of raw survival. Meanwhile, in a fascinating display of diplomatic fracture, Malaysia recently announced that its tankers would be exempt from Iran’s reported Hormuz toll—a testament to Kuala Lumpur’s pragmatic, long-standing relationship with Tehran.
This selective enforcement is the most insidious aspect of Iran economic coercion. By granting safe passage to some nations while punishing others, Tehran is attempting to divide the international community, making a unified coalition impossible. It forces Beijing and New Delhi to pressure Washington for a rapid de-escalation, effectively turning America’s vital trading partners into unwitting lobbyists for Iranian interests.
The Limits of Conventional Deterrence
The stark reality of 2026 is that traditional naval hegemony is insufficient to guarantee the free flow of global commerce. The US Navy, for all its unparalleled lethality, is designed to destroy state-level navies and project power ashore. It is not inherently designed to play an endless, unwinnable game of Whac-A-Mole against swarms of explosive drones launched from the backs of pickup trucks, or to sweep vast swathes of the Gulf for untethered acoustic mines.
As detailed by Foreign Affairs in their recent evaluation of Gulf security, attempting to solve an asymmetric economic problem with a symmetric military solution is a fool’s errand. Every Tomahawk missile fired at a fifty-dollar drone launch pad is a victory for Tehran’s arithmetic. The sheer cost imbalance heavily favors the instigator.
Furthermore, the secondary knock-on effects are paralyzing corporate strategy. Multinational giants are scaling back; consumer goods titans like Unilever have reportedly imposed global hiring freezes explicitly citing the Middle East war’s macroeconomic drag. Credit ratings agencies are recalibrating the sovereign debt of Gulf nations, with Fitch signaling downgrade risks for regional players due to post-war security environment uncertainties.
When global capital begins to view the entire Middle East as functionally un-investable and physically un-navigable, Iran’s objective is met. They do not need to plant a flag in Washington. They simply need to make the Dow Jones bleed until Washington offers terms.
Conclusion: Navigating a Repriced World
When Presidents Trump and Xi sit down in Beijing this May, the agenda will not merely be about tariffs, semiconductor export controls, or artificial intelligence dominance. The specter at the banquet will be the vulnerability of their shared globalized economy to asymmetric disruption. The Iran war of 2026 has irrevocably proved that the ultimate weapon of mass disruption is not nuclear; it is logistical.
We have entered an era where Iran’s real weapon is the world economy. The success of calibrated economic coercion means that future conflicts will increasingly mirror this blueprint. Rogue states and non-state actors alike have learned that by applying pressure to the delicate, over-optimized nodes of global supply chains, they can punch vastly above their geopolitical weight class.
The West cannot bomb its way out of an insurance crisis. Countering this new reality requires more than just deploying additional carrier strike groups. It demands a total reimagining of global supply-chain resilience, a rapid acceleration toward localized and diversified energy grids, and the painful acceptance that the era of friction-free, perfectly timed global shipping is over.
Until the world economy can insulate itself from the asymmetric leverage of chokepoint disruption, the true balance of power will not be measured in ballistic missiles or stealth fighters. It will be measured in the terrifyingly fragile mathematics of freight rates, risk premiums, and the price of a barrel of crude. The world has been repriced. We are all just paying the toll.
Discover more from The Economy
Subscribe to get the latest posts sent to your email.
-

 Markets & Finance3 months ago
Top 15 Stocks for Investment in 2026 in PSX: Your Complete Guide to Pakistan’s Best Investment Opportunities
-

 Analysis2 months ago
Brazil’s Rare Earth Race: US, EU, and China Compete for Critical Minerals as Tensions Rise
-

 Banks3 months ago
Best Investments in Pakistan 2026: Top 10 Low-Price Shares and Long-Term Picks for the PSX
-

 Investment3 months ago
Top 10 Mutual Fund Managers in Pakistan for Investment in 2026: A Comprehensive Guide for Optimal Returns
-

 Analysis2 months ago
Top 10 Stocks for Investment in PSX for Quick Returns in 2026
-

 Asia3 months ago
China’s 50% Domestic Equipment Rule: The Semiconductor Mandate Reshaping Global Tech
-

 Global Economy3 months ago
Pakistan’s Export Goldmine: 10 Game-Changing Markets Where Pakistani Businesses Are Winning Big in 2025
-

 Global Economy3 months ago
15 Most Lucrative Sectors for Investment in Pakistan: A 2025 Data-Driven Analysis