
Analysis
US-Iran Conflict: Economic Shockwaves Reshaping Regional Powers in 2026
The war that began at dawn on February 28 is rewriting the economic fortunes of every nation between the Bosphorus and the Strait of Hormuz.
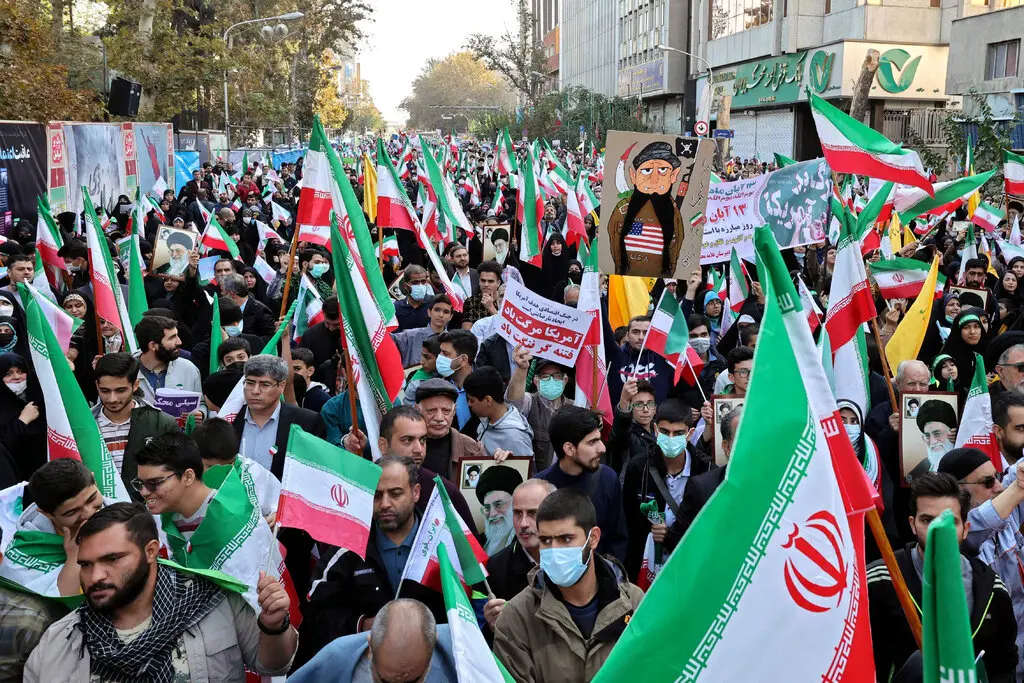
The tanker sat motionless in the blue-grey waters off Fujairah, its hull riding high and its captain’s radio silent. Nearby, 149 other vessels — laden with crude oil, liquefied natural gas, and refined products worth tens of billions of dollars — floated in identical limbo. The Strait of Hormuz, the narrow throat through which roughly one-fifth of the world’s daily oil supply must pass, had effectively ceased to function. It was March 3, 2026. The US-Israel war on Iran was five days old, and the global economy was already beginning to haemorrhage.
The joint US-Israeli operation codenamed “Operation Epic Fury” struck Iranian military installations, nuclear sites, and the Islamic Republic’s Supreme Leader Ali Khamenei on February 28 — a decapitation strike that killed him within hours. Iran’s retaliation was immediate and sweeping: missile and drone barrages struck Israeli cities, US military bases across the Gulf, and critical infrastructure in the UAE, Saudi Arabia, Qatar, Bahrain, and Kuwait. NPR The Islamic Revolutionary Guard Corps broadcast on international distress frequencies that no ship was permitted to pass the Strait of Hormuz. Within 24 hours, the world’s most critical energy chokepoint had become a war zone.
The economic consequences — already severe and still unfolding — are being distributed with brutal unevenness across the region. What follows is the first comprehensive accounting of those consequences, country by country, sector by sector.

The Strait of Hormuz: A $500 Billion Artery Under Fire
Before cataloguing the damage, it helps to understand the anatomy of the wound. According to the US Energy Information Administration, about 20 million barrels of oil worth roughly $500 billion in annual global energy trade transited through the Strait of Hormuz each day in 2024. Al Jazeera The waterway, just 21 miles wide at its narrowest point, is the sole maritime exit for the combined oil and gas exports of Iran, Iraq, Kuwait, Qatar, Saudi Arabia, and the UAE.
Iran declared the strait closed on March 3, which led to an immediate halt in tanker traffic. By that date, tanker traffic had dropped by approximately 70% from pre-conflict levels, with over 150 ships anchoring outside the strait to avoid risks. Wikipedia Insurance underwriters quickly withdrew coverage, making transit commercially unviable for most operators even before Iran fired on vessels. Michelle Bockmann, a senior maritime intelligence analyst at Windward, confirmed that traffic was down at least 80% and that the shipping industry had already experienced a “huge spike” in freight costs for routes out of the Middle East and the Gulf. Al Jazeera
The numbers convey scale; the human stakes require context. As of Tuesday, March 3, Brent crude oil prices had risen by around 7% since the conflict began, reaching as high as $83 per barrel. European natural gas futures jumped by around 30% following strikes on Qatar, a major exporter of the commodity. Daily freight rates for LNG tankers jumped more than 40% on Monday after Qatar halted operations. Time By March 7, Brent had surged above $90 per barrel — its highest level since September 2023.
| Commodity/Indicator | Pre-Conflict (Feb 27) | Post-Conflict Peak (Mar 7) | % Change |
|---|---|---|---|
| Brent Crude ($/bbl) | ~$70 | $90+ | +28% |
| European Gas Futures (TTF) | Baseline | +30% | +30% |
| LNG Tanker Freight Rates | Baseline | +40% | +40% |
| War-Risk Ship Insurance | 0.125% | 0.2–0.4% | +60–220% |
| Dow Jones Industrial Average | Baseline | -400+ points | Negative |
Sources: Kpler, TIME, Al Jazeera
Iran: An Economy in Free Fall Before the First Missile Landed
To understand Iran’s economic catastrophe, one must understand that the war found the country already on its knees. The World Bank projected in October 2025 that Iran’s economy would shrink in both 2025 and 2026, with annual inflation rising toward 60%. House of Commons Library Protests had been burning across all 31 provinces since December 28, 2025, ignited by currency collapse and soaring living costs. The rial had entered free fall months before a single American stealth aircraft crossed into Iranian airspace.
The US maximum-pressure sanctions campaign, re-imposed aggressively under the second Trump administration, had targeted Iran’s lifeblood. The US State Department issued multiple rounds of sanctions through February 2026, targeting Iranian oil networks, shadow fleet vessels, weapons procurement networks, and individuals involved in suppressing protests. U.S. Department of State Iran had reportedly lost tens of millions of dollars in capital flight, with senior leaders moving personal fortunes abroad — a detail US Treasury Secretary Scott Bessent publicly confirmed, describing it as officials “abandoning ship.”
Now, with infrastructure strikes destroying 4,000 civilian buildings by March 6, oil export revenue evaporating, and humanitarian corridors severed, Iran’s GDP trajectory is catastrophic. Based on the documented impact of wars elsewhere, Iran’s GDP is likely to fall by more than 10%, though Iran itself last published official GDP data in 2024. Chatham House The Iranian rial, already in collapse, has become functionally worthless in external markets.
Saudi Arabia: Caught Between Windfall and Warfare
Saudi Arabia occupies the most paradoxical position of any regional power. Higher oil prices — a direct consequence of this conflict — represent the kingdom’s primary revenue stream. Yet the kingdom’s oil infrastructure has become a target, its Ras Tanura refinery suspending production after strikes, and the Iranian drone campaign making a sustained windfall deeply uncertain.
Saudi Arabia maintains the most robust alternative infrastructure among Gulf producers through its East-West Pipeline system, capable of handling 5 million barrels per day to Red Sea terminals at Yanbu. Discovery Alert This has allowed Riyadh to demonstrate some resilience — pre-loading crude shipments before the crisis and redirecting flows away from the Strait — but pipeline capacity covers only a fraction of typical exports. Combined bypass capacity from all Gulf producers totals only around 2.6 million barrels per day, a fraction of the 20 million that normally transit Hormuz. Iraq, Kuwait, and Qatar have no comparable alternatives. Atlasinstitute
The tourism dimension of Saudi Arabia’s economic transformation — Vision 2030’s crown jewel — has suffered an immediate and potentially lasting shock. International flights were suspended, hotel bookings across NEOM and Red Sea Project sites collapsed, and the kingdom’s diversification ambitions have been abruptly deferred. Iran’s indiscriminate missile and drone strikes across the UAE, Saudi Arabia, Bahrain, Qatar, and Kuwait have introduced new investment risks, with attacks hitting military bases, airports, hotels, apartments, and financial centers. Allspring Global Investments
UAE and Qatar: Two Models, One Disaster
The UAE had spent years building itself into the world’s premier risk-off refuge — a gleaming monument to stability in a perpetually unstable neighbourhood. That brand proposition has been severely tested. When Dubai International Airport was damaged by drone strikes on March 1, it temporarily halted all flights and reopened only in limited capacity a few days later. Encyclopedia Britannica The UAE’s carefully curated image as a safe transit hub — one of the world’s busiest aviation networks, a gateway for 21 million annual tourists, home to the region’s deepest financial markets — absorbed a direct hit.
Qatar’s situation is arguably more acute. As the world’s largest LNG exporter, the Gulf emirate had long structured its entire economy around the secure passage of gas tankers through Hormuz. Qatar’s state-owned energy firm confirmed it would be stopping LNG production at its two main facilities after attacks on QatarEnergy’s operating facilities in Ras Laffan Industrial City and Mesaieed Industrial City. Time Qatari Energy Minister Saad Sherida al-Kaabi warned that if the war continues, other Gulf energy producers may be forced to halt exports and declare force majeure, and that “this will bring down economies of the world.”
Satellite imagery analysis suggested Ras Laffan — the crown of Qatar’s gas empire — had not suffered the structural damage initially feared, but the reputational damage and the export halt itself were enough to send European natural gas futures surging 30% in a single session.
Iraq and Kuwait: The Most Exposed Producers
Of all the regional economies, Iraq and Kuwait face the starkest immediate danger from the Strait of Hormuz closure. Iraq produces the second-highest volume of crude oil in OPEC behind Saudi Arabia, and while it can export some oil to the north via a pipeline through Turkey, the vast majority of crude moves through its southern port in Basra. Iraq relies entirely on Hormuz — if there is complete disruption, there is no other outlet for Basra’s crude. Time
On March 3, Bloomberg reported that Iraq had started shutting down operations at the Rumaila oil field due to lack of storage space, as tankers were unable to leave the strait. Wikipedia For a nation whose government budget depends on oil revenues for roughly 90% of its income, the arithmetic is punishing.
Kuwait faces the earliest shutdown risk of any Gulf producer due to its 100% Hormuz dependency and limited onshore storage capacity. Discovery Alert Unlike Saudi Arabia and the UAE, Muscat has no bypass pipeline. Should the effective closure persist beyond three to four weeks, Kuwait’s sovereign revenues could face a structural gap that its sovereign wealth fund — the Kuwait Investment Authority, one of the world’s oldest — would be required to partially bridge.
Turkey: $14 Billion in Reserves and a Disinflation Dream Deferred
Turkey’s position in this conflict is defined by a painful irony: Ankara is neither a belligerent nor a beneficiary, yet it is absorbing serious economic collateral damage almost in real time. President Erdoğan, who had long cultivated Iran as a strategic partner and energy supplier, now watches his central bank bleed reserves to defend the lira.
Although Turkey is not directly involved in the conflict, the financial spillovers have already cost the country roughly $14 billion in foreign-exchange reserves, highlighting the broader economic impact of the regional crisis. PA TURKEY
The structural vulnerability runs deep. A surge in energy import costs would push Turkey’s current account deficit toward 4% of GDP, well above the 2.3% forecast for 2026 and far higher than the 1.3% target in the government’s Medium-Term Programme. Higher energy prices feed directly into transportation expenses, industrial production costs, and food prices — in an environment where inflation is already elevated, another surge could derail the ongoing disinflation process. PA TURKEY
According to a Central Bank of Turkey study, a $10 increase in Brent crude oil prices would result in a $4–5 billion rise in the current account deficit. ING revised Turkey’s 2026 current account deficit forecast to $32 billion. ING THINK Turkey’s two-year government bond yield rose from 36.2% to 37.6% in a single week. Tourism — which generated over $60 billion for Turkey in 2025 — is already being threatened as the Eastern Mediterranean is perceived as an “unstable zone.”
Secondary Casualties: Jordan, Egypt, Lebanon
The conflict’s economic blast radius extends well beyond direct combatants. Jordan, which imports nearly all its energy and whose economy depends heavily on Gulf remittances and transit trade, faces immediate inflationary pressure from fuel prices. Egypt, already grappling with a sovereign debt crisis and a sharply devalued pound, confronts disruption to Suez Canal revenues — already wounded by the Houthi campaign — and a collapse in Red Sea tourism bookings. Lebanon, perpetually on the edge of a formal fiscal collapse, sees its tenuous economic stabilization at risk of unravelling.
In countries where energy subsidies remain extensive and government finances are already shaky, higher energy prices could unsettle bond markets. Chatham House Jordan and Egypt fit that description precisely.
Aviation and Hospitality: The Tourism Sector’s Vanishing Act
The economic impact of the US-Iran conflict on economy of regional powers extends far beyond oil terminals and currency desks — it reaches into hotels, airports, and the entire ecosystem of Gulf hospitality that has been painstakingly assembled over two decades.
Airspace closures in the UAE, Qatar, Kuwait, and other Gulf states led to the grounding of thousands of flights, affecting major carriers like Emirates Airlines and causing significant losses in tourism revenue. Wikipedia Emirates, the world’s largest long-haul carrier by passenger volume, suspended operations to multiple Middle Eastern destinations. Booking.com and Expedia data tracked near-total cancellations for March hotel arrivals across the Gulf. Cruise lines reduced Persian Gulf operations, with at least 15,000 passengers stranded across six major cruise ships.
The economic fallout US-Iran conflict brings to UAE, Qatar, and Kuwait’s tourism sectors cannot be easily quantified, but early modelling by regional hospitality groups suggests a full cancellation of the spring travel season — historically one of the region’s strongest booking periods — with projections of 40–60% revenue declines for Q1 2026.
The Global Dimension: BRICS, De-dollarisation, and Shifting Alliances
The conflict is materially improving Russia’s competitive position in crude oil markets. With Middle Eastern barrels facing logistical disruption, both India and China face strong incentives to deepen reliance on Russian supply. Kpler This accelerates a structural realignment that predates the current conflict: the gradual BRICS de-dollarisation of energy trade, the growth of yuan-denominated oil settlements, and the quiet expansion of Russia’s shadow fleet infrastructure.
Iran’s oil, already routed through a sophisticated sanctions-busting shadow fleet, had China and Iran’s primary trading partner as almost the only vessels still transiting the Strait in the conflict’s early days. CNBC If the conflict reshapes global energy trade routes — pushing Asian buyers deeper into Russian and Central Asian supply chains — the geopolitical consequences will outlast any ceasefire by years.
Three Scenarios for the Next 12 Months
Base Case (Probability: 55%): A conflict lasting two to four weeks, ending in a partial ceasefire brokered through Omani or Qatari mediation. Oxford Economics projects the conflict will likely last one to three weeks, at most two months. Oxford Economics Brent stabilises between $75–$85 per barrel. The Strait reopens to commercial traffic. Gulf economies absorb a Q1 revenue shock but recover partially by mid-year. Iran’s GDP falls 10–15%. Turkey’s current account deficit widens to $30–32 billion. Saudi Vision 2030 experiences a six-to-twelve-month delay in major non-oil projects.
Best Case (Probability: 20%): Rapid de-escalation within ten days, driven by coercive diplomacy. Oil prices retreat to $72–75 per barrel. Hormuz reopens fully by mid-March. Gulf tourism rebounds strongly in Q2. Turkey’s disinflation trajectory resumes by April. Iran remains in economic contraction but avoids a full humanitarian crisis. Regional sovereign wealth funds absorb short-term shocks without structural damage.
Worst Case (Probability: 25%): The conflict extends beyond six weeks, with sustained attacks on Gulf energy infrastructure and a de facto long-term Hormuz closure. If oil prices climb toward $100 per barrel and remain elevated throughout the year, accompanied by a comparable rise in natural gas prices, inflation might be roughly one percentage point higher globally and GDP growth perhaps 0.25–0.4 percentage points lower. Chatham House Iran sanctions oil price volatility reaches historic extremes. Turkey faces a full balance-of-payments crisis. Gulf states invoke force majeure on sovereign contracts. A regional recession becomes probable. The Qatari Energy Minister’s warning that prolonged disruption “will bring down economies of the world” shifts from rhetoric to a credible risk scenario. Wikipedia
Conclusion: The Chokepoint as a Mirror
The Strait of Hormuz crisis reveals something that decades of geopolitical risk modelling consistently underestimated: the global economy’s dependence on a single waterway 21 miles wide. Every barrel stranded off Fujairah, every LNG tanker anchored in the Gulf of Oman, every hotel room emptied in Dubai or Doha, is a data point in a lesson the world is learning at enormous cost.
The US-Iran conflict’s impact on Saudi Arabia’s economy 2026, on Turkey’s GDP and tourism, on the economic fallout across UAE, Qatar, and Kuwait — these are not peripheral aftershocks. They are the primary economic signal of a geopolitical era defined by concentrated chokepoints, sanctions as strategic weapons, and the lethal intersection of energy geography and great-power rivalry.
The tankers will eventually move again. But the trade routes, the alliances, and the economic order they carry will look different when they do.
Key Sources:
- US EIA: Strait of Hormuz Fact Sheet
- Kpler: US-Iran Conflict Reshapes Global Oil Markets
- Chatham House: How Will the Iran War Affect the Global Economy?
- Oxford Economics: The 2026 Iran War – An Initial Take
- Al Jazeera: Shutdown of Hormuz Strait Raises Fears of Soaring Oil Prices
- CNBC: Strait of Hormuz Closure – Which Countries Will Be Hit Most
- NPR: Trump Warns Iran ‘Will Be Hit Very Hard’
- ING Think: Monitoring Turkey – Geopolitical Shock Increases Risks
- P.A. Turkey: A $14 Billion Reserve Hit for Türkiye
- P.A. Turkey: What the Iran War Means for Türkiye
- Allspring Global: Market Impacts: Iran Conflict
- Atlas Institute: The Strait That Moves the Market
- Wikipedia: Economic Impact of the 2026 Iran War
- Wikipedia: 2026 Strait of Hormuz Crisis
- Britannica: 2026 Iran Conflict
- House of Commons Library: Iran – Challenges in 2026
- TIME: Strait of Hormuz Global Oil and Gas Trade Disrupted
Discover more from The Economy
Subscribe to get the latest posts sent to your email.


Gulf investors pulled over $1 billion from Pakistan’s bonds and equities in FY26. Here’s why the Gulf peace deal matters more than headlines suggest.
Pakistan’s economic commentary this year has largely stayed domestic — inflation, IMF reviews, remittances. The more revealing story sits in the balance-of-payments data: Gulf capital, historically one of Pakistan’s most reliable sources of portfolio investment, has gone into reverse at precisely the moment Islamabad is leaning on its Gulf relationships diplomatically.
The numbers
State Bank of Pakistan data show that from July 1, 2025 to June 19, 2026, equity market inflows totalled just $308 million while outflows exceeded $1 billion. Foreign direct investment declined by 28% over the first 11 months of FY26, domestic bonds saw a net outflow of $550 million, and total bond outflows for the year topped $2 billion. Pakistan’s external financing needs are steep: the country must pay over $26 billion in 2026–27, against an $35 billion trade deficit in the first 11 months of FY26.
Between July 2025 and June 2026, foreign outflows from Pakistan’s domestic bonds exceeded $2 billion, while equity market outflows topped $1 billion against just $308 million in inflows. Gulf states have been net sellers, with Bahrain withdrawing $30 million from Pakistani bonds in early FY27 alone, as the US-Israeli war with Iran raised regional risk premiums.
The pattern has continued into the new fiscal year. In the first ten days of FY27, Bahrain withdrew $30 million from Pakistan’s domestic bonds — $21 million from treasury bills and $9 million from Pakistan Investment Bonds — with no Gulf country recording any inflow during the period. Luxembourg was the only recorded foreign buyer, investing $4 million.
Why the peace deal matters disproportionately to Pakistan
Analysts quoted in Pakistani financial press note that Pakistan is not a party to the Gulf war but is now part of the peace framework, which raises the stakes for Islamabad if the deal collapses. Remittances from Gulf countries have so far held up, but bankers warn a prolonged conflict could eventually disrupt what remains the country’s largest source of foreign exchange, alongside stagnant exports and growth capped below 4%.
This sits against a wider regional backdrop: a new UNCTAD World Investment Report finds Gulf outbound investment grew through 2025, but warns that a prolonged conflict could redirect Gulf capital toward domestic reconstruction and strategic infrastructure, reducing the pool available for developing economies in Asia and Africa that increasingly depend on GCC financing — a dynamic that directly implicates Pakistan’s financing model.
The underserved angle
Most Pakistani business coverage frames this as an IMF-and-remittances story. The more precise framing is a capital-substitution risk: Pakistan has structurally relied on Gulf sovereign and institutional capital to plug its external financing gap, and that capital source is now competing for the same money regional reconstruction and Gulf domestic strategic infrastructure would need in a prolonged-conflict scenario. There is a live, underreported counter-current too — SBP data show net FDI actually rose from $54.46 million in April 2026 to $214.29 million in May, suggesting the bond-market flight and the FDI picture are not moving in lockstep.
Discover more from The Economy
Subscribe to get the latest posts sent to your email.

As US tariffs strain CUSMA, Canada is striking deals with China, Indonesia and the UAE. Here’s how Ottawa’s pivot away from the US is actually unfolding.
Every Canadian trade story in 2026 tends to lead with the same character: Washington. But the more consequential story may be what Ottawa is doing everywhere else. Facing sustained US tariff pressure and uncertainty over the CUSMA review, the Carney government has initiated a strategy to diversify Canada’s international trade, with a specific target of doubling exports to non-US markets by 2035.
Canada’s trade diversification strategy aims to double exports to non-US markets by 2035. In 2025–26 it produced a stabilisation deal with China on EVs and canola, a new trade agreement with Indonesia, a Foreign Investment Promotion and Protection Agreement with the UAE, and consultations with India, Thailand and Mercosur.
The deals nobody outside trade-law circles is tracking
Three moves stand out as substantively new rather than aspirational:
- China: during a visit to Beijing, Canada’s prime minister struck a deal establishing a tariff-rate quota for a set number of Chinese EVs — reverting to pre-2024 tariff levels — in exchange for reduced Chinese tariffs on Canadian canola, lobster and peas. This is a live trade-off between EV protectionism and agricultural market access.
- Indonesia: Canada signed a new trade agreement with Indonesia in 2025, opening a Southeast Asian market largely absent from Canadian export strategy until now.
- UAE: Ottawa launched trade-agreement negotiations and signed a new Foreign Investment Promotion and Protection Agreement with the United Arab Emirates, positioning the Gulf as a capital and market-access partner rather than just an energy counterpart.
Meanwhile, exporter confidence has ticked up but remains below its historical average, and diversification remains concentrated in a narrow set of commodities rather than being broad-based.
Why the gravity model is the real obstacle
Trade economists point to the Gravity Model of trade to explain why diversification is structurally hard: the US economy’s size, physical proximity, regulatory similarity and deeply integrated supply chains with Canada make full substitution unrealistic in the near term, even as China and India are flagged as the two most promising long-term markets given they will account for roughly 45% of global economic growth.
The underserved angle
Most coverage treats “Canada diversifying away from the US” as a single narrative. It is actually three distinct, sometimes contradictory tracks: a commodity-for-EV-tariff trade with China, a market-opening play in Southeast Asia via Indonesia, and a capital-and-investment play with the Gulf via the UAE. Each carries different risk profiles — geopolitical risk with China, execution risk with a new Indonesian relationship, and Gulf capital that is itself increasingly redirected toward domestic reconstruction needs amid regional conflict.
Discover more from The Economy
Subscribe to get the latest posts sent to your email.
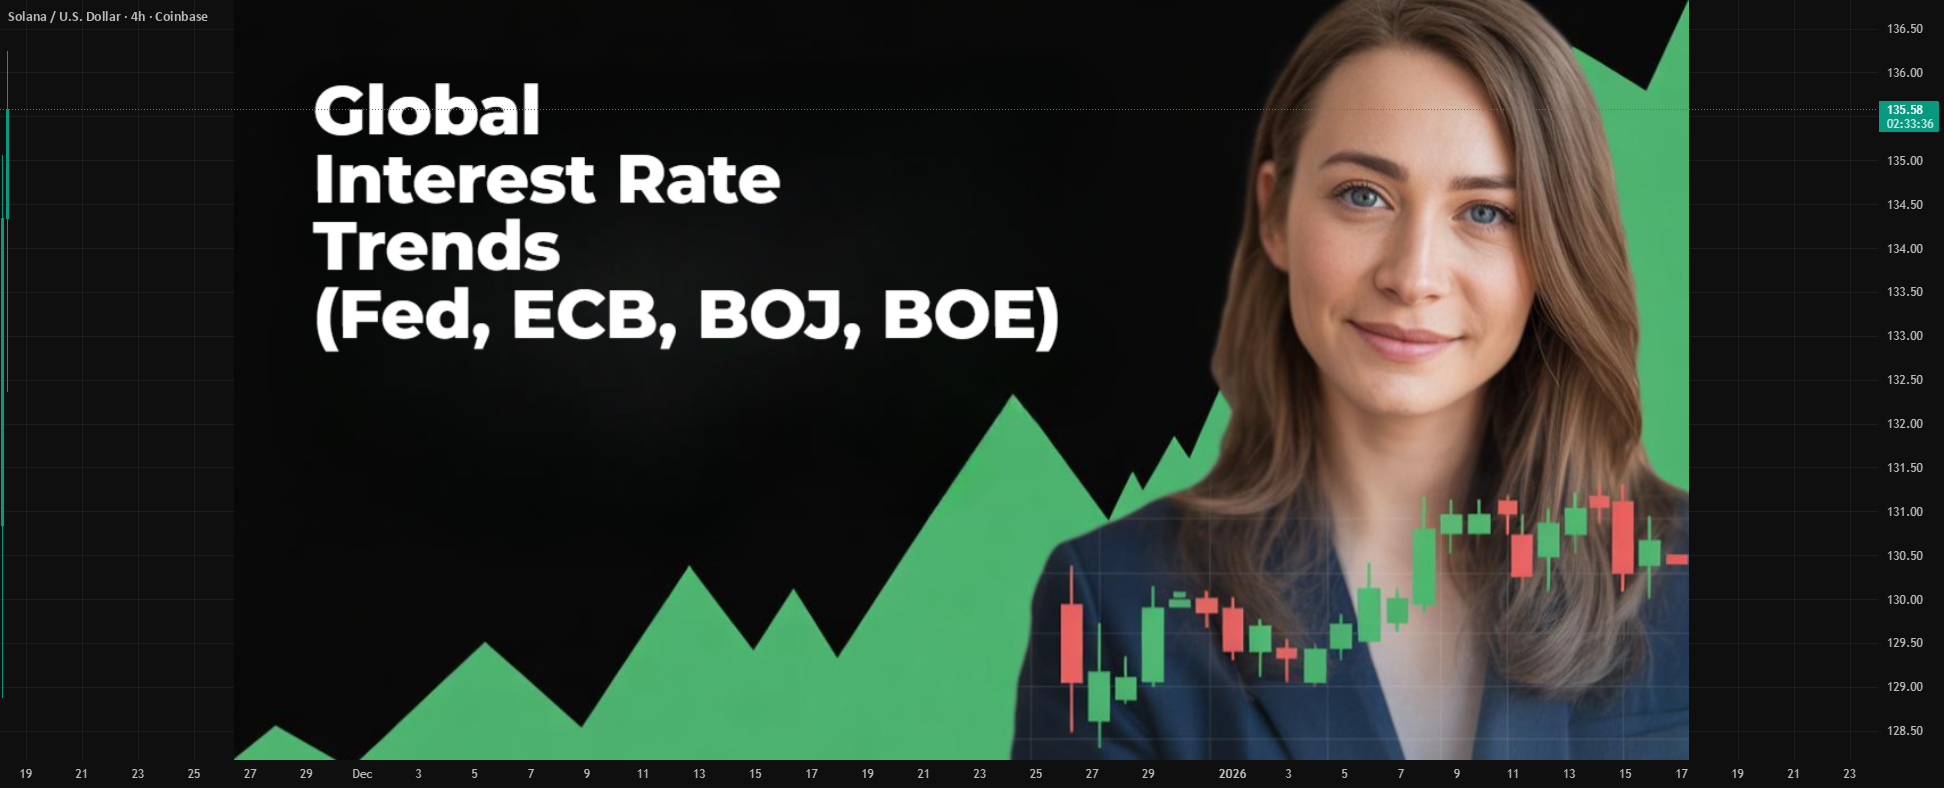
Analysis of how the Federal Reserve, Bank of England and Bank of Japan could reshape global markets, inflation, currencies and economic growth in 2026.
Executive Summary
The world’s most influential central banks are entering one of the most consequential policy weeks of 2026. Investors are watching closely as the U.S. Federal Reserve, the Bank of England, and the Bank of Japan weigh the competing pressures of easing inflation, geopolitical uncertainty, elevated energy prices, and slowing global growth. Financial markets are also preparing for major corporate earnings and fresh GDP data from several advanced economies. �
Financial Times +1
Unlike the synchronized tightening cycle that dominated recent years, policymakers are increasingly responding to country-specific economic conditions. This divergence is expected to influence capital flows, exchange rates, bond yields, and investment decisions across both developed and emerging markets. �
McKinsey & Company +1
A New Monetary Landscape
Global inflation has moderated from its post-pandemic peaks, yet central banks remain cautious. Recent movements in energy markets and ongoing geopolitical tensions continue to threaten price stability, even as labor markets show signs of cooling. �
McKinsey & Company +1
For investors, the question is no longer whether interest rates have peaked, but how long they will remain elevated.
United States: The Federal Reserve Faces a Delicate Balance
Attention is centered on the Federal Reserve, where policymakers are expected to keep rates steady while evaluating the effects of inflation, consumer demand, and accelerating investment in artificial intelligence infrastructure. Markets are also monitoring whether AI-driven capital spending could contribute to future inflationary pressures. �
Investopedia +1
Bond investors remain sensitive to any shift in the Fed’s language, as Treasury yields continue to reflect expectations about future policy and inflation risks. �
MarketWatch
United Kingdom: Stability Before Growth
The Bank of England is expected to maintain a cautious stance amid moderating wage growth and relatively stable unemployment. However, policymakers continue to weigh external risks, including energy market volatility and global geopolitical developments. �
Financial Times
Businesses remain particularly attentive to borrowing costs, which continue to influence investment decisions across the UK economy.
Japan Ends an Era of Ultra-Loose Money
Japan is undergoing one of its most significant monetary transitions in decades. Rising wages and gradually strengthening inflation have encouraged the Bank of Japan to continue moving away from the ultra-accommodative policies that defined much of the past generation. �
Financial Times
This normalization has implications far beyond Japan, affecting global capital markets and currency dynamics.
Why Emerging Markets Are Watching Closely
Emerging economies including Pakistan, Indonesia, Malaysia, and others remain particularly exposed to decisions made by advanced economy central banks.
Higher U.S. interest rates typically strengthen the dollar, increase external financing costs, and place pressure on countries with significant foreign currency debt.
Conversely, a more stable interest rate environment could improve capital flows into emerging markets while easing exchange rate volatility.
AI Is Becoming a Monetary Policy Variable
One of the most important structural developments in 2026 is the rapid expansion of artificial intelligence infrastructure.
Major technology companies continue investing heavily in data centers, semiconductors, cloud computing, and digital infrastructure. These investments are supporting economic growth but are also creating new questions about inflation, productivity, and long-term financing needs. �
Investopedia +1
Investment Implications
Several themes are emerging:
Higher-for-longer interest rates remain possible.
Government bond markets are likely to remain volatile.
The U.S. dollar could remain relatively strong.
AI-related investment continues attracting capital.
Emerging markets may benefit if inflation continues to moderate.
Competitor Keyword Gap Analysis
Leading publications such as the Financial Times, Reuters, Bloomberg, and CNBC primarily emphasize immediate policy decisions. An opportunity exists to capture additional search traffic by targeting broader intent-based queries.
Key Takeaways
Central bank decisions this week are expected to shape global financial markets.
AI investment is becoming an increasingly important economic driver.
Bond markets remain sensitive to inflation expectations.
Emerging economies face both risks and opportunities from policy divergence.
Investors should monitor GDP releases, corporate earnings, and inflation indicators alongside interest rate announcements.
Frequently Asked Questions
Why are central bank meetings so important?
They influence borrowing costs, inflation expectations, currency values, and investment decisions worldwide.
How do interest rates affect stock markets?
Higher rates generally increase financing costs and can reduce company valuations, while lower rates often support economic activity and equity markets.
Why is AI influencing monetary policy discussions?
Large-scale investment in AI infrastructure is reshaping productivity, corporate spending, and long-term inflation expectations.
Discover more from The Economy
Subscribe to get the latest posts sent to your email.

Pakistan Gulf Investment Outflows 2026: Peace Deal Stakes Explained

Canada Trade Diversification 2026: China, Indonesia, UAE Deals Explained

US Forced-Labour Tariffs on 60 Countries: The Hidden Trade Shock of 2026

Global Central Banks 2026: Fed, BoE and BoJ Decisions Could Reshape Markets

Gulf Capital Retreat From Pakistan 2026: UAE Loan Freeze & What It Means

Pakistan’s Most Reliable Export Is Its People: Remittances Hit $41.6 Billion, Overtaking Total Exports

Indonesia’s Confidence Problem: Record Investment, a Sinking Rupiah, and a Widening Credibility Gap

Down But Not Out: Inside the Slow Sinking of Russia’s War Economy

China’s Growth Slips to a Four-Year Low: Why Beijing Still Won’t Pull the Stimulus Trigger

The Johor-Singapore Corridor: How Malaysia Became Southeast Asia’s AI Infrastructure Powerhouse

Canada’s Economy ‘On Pause’: Inside the CUSMA Deadline That Passed Without a Deal

Dubai’s Millionaire Magnet: How the UAE Turned Middle East Turmoil Into a Capital Safe-Haven Boom

Britain’s Sixth Prime Minister in a Decade: What Starmer’s Exit Means for Gilts, Sterling and Your Portfolio

Anthropic Offers Up to $600,000 Salary for Critical IPO Role as AI Giant Prepares for Wall Street Debut

Carry Trade Unwind 2026: How the Yen’s Snapback Triggered a Global Margin Call

AI Bubble Warning 2026: Why BIS, IMF and Bank of England Fear a Market Crash

BRICS De‑Dollarization Strategy Takes Shape with $15 Billion Local‑Currency Push

The AI Super Bubble Is Ready to Burst

Russia Bans Diesel Exports 2026: Global Fuel Market Impact Explained

Strait of Hormuz Blockade 2026: Oil Prices Surge 9% as US-Iran Conflict Reignites

Private Credit Warning: Most BDCs Turn Unprofitable in 2026, Reuters Finds

Bitcoin $150k Milestone Achieved as US Sovereign Crypto Pivot Looms

IMF Cuts Pakistan Growth Forecast, Raises Inflation to 8.4%
Gulf Capital Retreat From Pakistan 2026: UAE Loan Freeze & What It Means

India Economic Rise 2026: How the Subcontinent Toppled Japan

Strait of Hormuz 2026: Why Markets Still Don’t Trust It’s Open

China Housing Market Turnaround: White‑List Model Stabilises Prices

Chipmakers Just Lost 6.7% in Two Days: Inside the Great AI Trade Rotation
-

 Markets & Finance7 months ago
Top 15 Stocks for Investment in 2026 in PSX: Your Complete Guide to Pakistan’s Best Investment Opportunities
-

 Analysis5 months ago
Johor’s Investment Boom: The Hidden Costs Behind Malaysia’s Most Ambitious Economic Surge
-

 Analysis5 months ago
Top 10 Stocks for Investment in PSX for Quick Returns in 2026
-

 Analysis6 months ago
Brazil’s Rare Earth Race: US, EU, and China Compete for Critical Minerals as Tensions Rise
-

 Banks6 months ago
Best Investments in Pakistan 2026: Top 10 Low-Price Shares and Long-Term Picks for the PSX
-

 Investment7 months ago
Top 10 Mutual Fund Managers in Pakistan for Investment in 2026: A Comprehensive Guide for Optimal Returns
-

 Global Economy7 months ago
15 Most Lucrative Sectors for Investment in Pakistan: A 2025 Data-Driven Analysis
-

 Global Economy7 months ago
Pakistan’s Export Goldmine: 10 Game-Changing Markets Where Pakistani Businesses Are Winning Big in 2025