
Global Economy
Trump’s December Address: The Reality Behind the Rhetoric


As approval ratings crater, the president’s primetime speech reveals a White House struggling to reconcile campaign promises with economic headwinds
When President Trump declared from the Diplomatic Reception Room on Wednesday evening that he had “inherited a mess” and was now “fixing it,” he unknowingly captured the central paradox of his second term. Nearly eleven months into his presidency, Trump claims to have brought “more positive change to Washington than any administration in American history,” yet this assertion collides uncomfortably with economic data showing Americans increasingly pessimistic about their financial futures. The disconnect between the president’s triumphalist rhetoric and voters’ lived experience isn’t merely a messaging problem—it’s become a political crisis that threatens Republican control of Congress in 2026.
The most revealing aspect of Trump’s address wasn’t what he announced, but what he avoided. Beyond unveiling a $1,776 “warrior dividend” for military personnel—a $2.5 billion expenditure funded by tariff revenues—the twenty-minute speech broke little new policy ground. Instead, it offered a familiar litany of achievements, exaggerated statistics, and blame directed at his predecessor. What went unmentioned speaks volumes: Trump’s economic approval has plummeted to just 36% according to the latest NPR/PBS News/Marist poll, marking the lowest point of either of his presidential terms. For a politician who built his brand on economic competence, this represents a devastating reversal.
The Affordability Crisis Trump Can’t Spin Away
The numbers tell a story Trump’s rhetoric cannot obscure. Sixty-eight percent of Americans, including 44% of Republicans, now say the economy is in poor shape, according to the Associated Press-NORC survey conducted in early December. Perhaps more troubling for the White House, 45% of Americans identify prices as their top economic concern—more than double the next highest category. This isn’t abstract economic anxiety; it’s concrete kitchen-table distress.
Trump claimed gasoline now costs under $2.50 per gallon “in much of the country,” but AAA data shows the national average at $2.90—only 13 cents lower than a year ago. His assertion that egg prices have fallen 82% since March, while directionally accurate about wholesale prices, masks a more complex story about supply chain disruptions and avian flu recovery. These selective statistics reveal a White House more focused on crafting favorable narratives than addressing underlying economic pressures.
The president’s boast about solving grocery price inflation rings particularly hollow. While it’s true that some commodity prices have moderated, 70% of Americans now describe the cost of living as “not very affordable” or “not affordable at all”—the highest level since Marist began tracking this measure in 2011. Just six months earlier, only 45% expressed similar concerns. This dramatic deterioration in perceived affordability represents one of the sharpest swings in consumer sentiment in recent memory.
The Tariff Trap: When Economic Theory Meets Political Reality
Trump’s warrior dividend announcement inadvertently highlighted the administration’s central economic gamble: that tariff revenues can fund government priorities without imposing costs on American consumers and businesses. This assumption has proven spectacularly wrong.
The Tax Foundation estimates that Trump’s imposed tariffs will reduce U.S. GDP by 0.5% and amount to an average tax increase of $1,100 per household in 2025, rising to $1,400 in 2026. These aren’t abstract economic projections—they’re manifesting in real-world price increases across sectors. Research by Harvard economist Alberto Cavallo and colleagues found that the inflation rate would have been 2.2% rather than current levels had it not been for Trump’s tariffs.
The political consequences are becoming apparent. Two-thirds of Americans express concern about tariffs’ impact on their personal finances, while business uncertainty has contributed to a dramatic slowdown in hiring. November saw just 64,000 jobs added, while October recorded a loss of 105,000 positions, driven largely by federal workforce reductions but exacerbated by private sector caution. The unemployment rate climbed to 4.6%—the highest level in four years.
Small businesses bear a disproportionate burden. Unlike large retailers with sophisticated supply chains and pricing power, small importers face existential pressure. One small business owner told CNBC that complexity in her supply chain has increased tenfold, while revenue has declined year-over-year. With approximately 36 million small businesses accounting for 43% of U.S. GDP, their struggles have macroeconomic implications that extend far beyond individual balance sheets.
The Midterm Mathematics Don’t Add Up
Trump’s address comes as Republicans confront an uncomfortable political reality: the affordability message that propelled them to victory in 2024 has become a vulnerability. Recent Quinnipiac polling shows only 40% of Americans approve of Trump’s job performance, with 54% disapproving, while his economic approval sits even lower. Among critical swing constituencies, the erosion is severe—rural voters and white women without college degrees, both core Republican groups, now disapprove of his economic stewardship by significant margins.
The November off-year elections offered a preview of potential 2026 outcomes. Democrats swept gubernatorial races in Virginia and New Jersey, and captured the New York City mayoralty—all by centering campaigns on affordability and cost-of-living concerns. In an echo of the Republican playbook from 2024, progressive candidates successfully framed GOP economic policies as benefiting corporations while hurting families. The political tables have turned with stunning speed.
Historical precedent suggests danger ahead. Trump’s overall approval stands at 38% in some surveys—comparable to his April 2018 rating, which preceded Republicans losing 40 House seats in the midterm elections. The intensity of disapproval is particularly concerning; 50% of registered voters say they “strongly disapprove” of the president’s performance, a level of polarized opposition that typically drives high opposition turnout.
The Federal Reserve Dilemma
Trump’s promise to announce “someone who believes in lower interest rates by a lot” as the next Federal Reserve chairman reveals a fundamental misunderstanding—or deliberate misrepresentation—of monetary policy constraints. The Fed faces a trilemma: supporting growth, controlling inflation, and maintaining dollar stability. Trump’s tariff policies have made this balancing act significantly more difficult.
Average hourly earnings rose just 0.1% in November, suggesting wage pressures remain subdued. Yet inflation persists at around 3%—above the Fed’s 2% target and sticky enough to limit aggressive rate cuts. The November jobs report, showing unemployment at a four-year high alongside sluggish hiring, presents precisely the stagflationary scenario that gives central bankers nightmares.
Political pressure on the Fed to prioritize growth over inflation stability could undermine the institution’s credibility, risking long-term economic damage for short-term political gains. Markets appear skeptical; despite Trump’s optimistic projections, probability of a January rate cut remains low, with traders pricing in limited easing through 2026.
What Wasn’t Said Matters More Than What Was
The twenty-minute address notable omissions reveal a White House in damage-control mode. Trump made no mention of health care, despite millions of Americans facing higher premiums in 2026 due to expiring Affordable Care Act subsidies—a crisis that contributed to the recent government shutdown. He offered no concrete plan to address housing affordability, despite promising “some of the most aggressive housing reform plans in American history.” These vague future commitments suggest policy initiatives remain underdeveloped even as political pressure mounts.
Perhaps most tellingly, Trump avoided discussing the budget deficit or federal debt, despite his tariff-for-revenue strategy falling short of financing goals. The warrior dividend, while symbolically appealing, exemplifies the problem: using trade policy to fund discrete initiatives without addressing systemic fiscal challenges. It’s governance by announcement rather than comprehensive planning.
The Road Ahead: Campaign Mode Cannot Solve Governing Challenges
The address “had the feel of a Trump rally speech, without the rally,” one observer noted—an apt description of an administration struggling to transition from campaign mode to governing reality. Rally rhetoric energizes the base but doesn’t lower grocery bills or create jobs. As Democrats discovered during Biden’s tenure, economic perception often matters more than economic statistics, and perception has turned decisively negative.
Trump faces an increasingly narrow path forward. His approval among Republicans remains robust at around 84%, providing a stable floor but insufficient for broader political success. To rebuild credibility on economic management, the administration needs to deliver tangible affordability improvements before the 2026 midterm campaign begins in earnest—likely by summer 2026.
Three potential scenarios emerge. First, the administration could scale back tariffs, accepting short-term political embarrassment to ease price pressures and business uncertainty. Second, the White House might pursue aggressive fiscal stimulus, risking inflation but boosting consumer spending power. Third—and most likely—Trump continues doubling down on his current approach, gambling that economic conditions improve independently or that he can successfully blame Democrats for ongoing problems.
The December address suggests the third path. Trump spent more time deflecting blame toward Biden than outlining forward-looking solutions. This backward-looking posture may satisfy core supporters but does little to win back skeptical independents and suburban voters whose support determines congressional majorities.
The Bigger Picture: Populism Meets Economic Reality
Trump’s predicament illustrates a broader challenge facing populist economic nationalism: converting campaign slogans into sustainable policy proves considerably harder than winning elections. Tariffs were supposed to protect American workers, rebuild manufacturing, and generate government revenue—a win-win-win proposition. Instead, they’ve produced a lose-lose-lose outcome: higher consumer prices, business uncertainty dampening investment and hiring, and insufficient revenue to offset their economic drag.
The president’s address revealed an administration caught between its ideological commitments and economic realities. Unable to acknowledge that signature policies might be failing, yet unable to convince voters that those policies are succeeding, Trump has retreated into an increasingly defensive crouch. The warrior dividend—a one-time payment to a politically sympathetic constituency—exemplifies the thinking: targeted gestures to shore up support rather than comprehensive solutions to systemic problems.
As the 2026 midterms approach, Republicans face an uncomfortable question: Can Trump’s personal political skills overcome objective economic headwinds? History suggests the answer is no. Midterm elections typically serve as referendums on presidential performance, particularly economic performance. With affordability concerns at fourteen-year highs, unemployment rising, and business confidence weakening, the political environment increasingly resembles 2018’s Democratic wave election—only in reverse.
The December address offered reassurance to supporters but did little to expand the coalition Trump needs to maintain congressional majorities. Perhaps that was always its purpose: shoring up the base rather than persuading skeptics. If so, it represents a strategic retreat from the ambitious claims that opened the speech. Bringing “more positive change than any administration in American history” requires more than declaring it—it requires delivering results that voters can see and feel. On that metric, Trump’s second term remains very much a work in progress, and patience is wearing thin.
Discover more from The Economy
Subscribe to get the latest posts sent to your email.



Executive Summary & Key Takeaways
The global macroeconomic landscape is defined by monetary policy shifts, technological supply chain realignments, and shifting demographic dynamics. According to official economic monitoring by the International Monetary Fund (IMF World Economic Outlook) and the World Bank Group, global GDP exceeds $125 trillion in nominal terms.
- Top Position: The United States maintains its position as the largest nominal economy at $32.38 trillion, driven by tech innovation, resilient consumer demand, and deep capital markets, as highlighted by the U.S. Bureau of Economic Analysis.
- PPP Leader: China dominates Purchasing Power Parity (PPP) with an output of $44.30 trillion, reflecting its massive industrial capacity and domestic consumption scale.
- European Dynamics: Germany holds the 3rd spot nominally ($5.45 trillion), navigating energy transitions and industrial re-tooling ahead of Japan ($4.38 trillion).
- Emerging Growth Engines: India leads among major emerging markets with real GDP growth expanding above 6.4%, positioning it to challenge top-tier positions over the coming decade.
Global GDP Ranking Matrix: Top 10 Economies
Below is a comparative breakdown of the top 10 economies, combining Nominal GDP, PPP GDP, Nominal GDP Per Capita, and Real GDP Growth Rates aggregated from primary statistical repositories including Eurostat and the Federal Reserve Economic Data (FRED).
| Rank | Country | Nominal GDP (USD)∣PPPGDP(Int.) | Nominal GDP Per Capita | Real Growth Rate (%) | Key Dominant Sector |
| 1 | United States | $32.38 Trillion | $32.38 Trillion | $94,430 | 2.32% |
| 2 | China | $20.85 Trillion | $44.30 Trillion | $14,874 | 4.41% |
| 3 | Germany | $5.45 Trillion | $6.41 Trillion | $65,303 | 0.79% |
| 4 | Japan | $4.38 Trillion | $7.26 Trillion | $35,703 | 0.72% |
| 5 | United Kingdom | $4.26 Trillion | $4.72 Trillion | $61,056 | 0.80% |
| 6 | India | $4.15 Trillion | $18.90 Trillion | $2,813 | 6.48% |
| 7 | France | $3.60 Trillion | $4.73 Trillion | $52,083 | 0.86% |
| 8 | Italy | $2.74 Trillion | $3.87 Trillion | $46,505 | 0.52% |
| 9 | Russia | $2.66 Trillion | $7.53 Trillion | $18,525 | 1.09% |
| 10 | Brazil | $2.64 Trillion | $5.23 Trillion | $12,313 | 1.91% |
In-Depth Profile of the Top 10 Economies
1. United States
- Nominal GDP: $32.38 Trillion | PPP GDP: $32.38 Trillion | Per Capita: $94,430
- Growth Rate: 2.32%
- Economic Analysis: The U.S. economy remains the world’s chief financial powerhouse. Its growth is underpinned by flexible labor markets, dominant technology giants, and capital allocation mechanisms tracked by the Federal Reserve System. The nation’s strength in artificial intelligence, software infrastructure, biotechnology, and energy self-sufficiency shields it against foreign supply chokepoints.
- Macro Risk: High national debt levels and elevated interest rates aimed at controlling service-sector inflation.
2. China
- Nominal GDP: $20.85 Trillion | PPP GDP: $44.30 Trillion | Per Capita: $14,874
- Growth Rate: 4.41%
- Economic Analysis: China is the world’s industrial foundation and the largest economy measured by Purchasing Power Parity. According to global trade documentation from UNCTAD, China leads in global manufacturing export volumes, electric vehicle supply chains, solar tech, and rare earth processing.
- Macro Risk: Real estate market structural adjustments, local government debt debt-servicing burdens, and demographic headwinds from an aging workforce.
3. Germany
- Nominal GDP: $5.45 Trillion | PPP GDP: $6.41 Trillion | Per Capita: $65,303
- Growth Rate: 0.79%
- Economic Analysis: Germany serves as the industrial core of the European Union. Supported by a specialized network of medium-sized industrial leaders (Mittelstand), Germany excels in high-precision engineering, chemical processing, and industrial machinery.
- Macro Risk: Transitioning away from historically cheap pipeline gas toward green hydrogen/renewable infrastructure, combined with structural labor shortages.
4. Japan
- Nominal GDP: $4.38 Trillion | PPP GDP: $7.26 Trillion | Per Capita: $35,703
- Growth Rate: 0.72%
- Economic Analysis: Known for technological innovation and precision manufacturing, Japan benefits from high foreign assets, advanced robotics, and heavy domestic research investment. Trade flows published by the OECD iLibrary highlight Japan’s high value-add manufacturing integration across Asia and the Americas.
- Macro Risk: Persistent demographic contraction and high public debt-to-GDP ratios managed by the Bank of Japan.
5. United Kingdom
- Nominal GDP: $4.26 Trillion | PPP GDP: $4.72 Trillion | Per Capita: $61,056
- Growth Rate: 0.80%
- Economic Analysis: The UK relies heavily on services, which account for roughly 80% of total economic output. London remains one of the world’s premier financial centers, excelling in asset management, insurance, cross-border fintech, and legal services.
- Macro Risk: Supply-chain re-anchoring post-Brexit and sluggish domestic capital investment rates.
6. India
- Nominal GDP: $4.15 Trillion | PPP GDP: $18.90 Trillion | Per Capita: $2,813
- Growth Rate: 6.48%
- Economic Analysis: India is the world’s fastest-growing major economy. Driven by rapid digital public infrastructure expansion, nationwide transport investments, and expanding manufacturing under global supply chain diversification strategies (“China + 1”), India is rapidly scaling up both domestic consumption and industrial exports.
- Macro Risk: Job creation for a massive young workforce and infrastructure expansion bottlenecks.
7. France
- Nominal GDP: $3.60 Trillion | PPP GDP: $4.73 Trillion | Per Capita: $52,083
- Growth Rate: 0.86%
- Economic Analysis: France operates a diversified economy featuring strong tourism, aerospace (Airbus), luxury consumer conglomerates (LVMH, Kering), and nuclear energy generation. Its low-carbon electricity grid provides cost-stability advantages over neighboring industrial markets.
- Macro Risk: Public deficit management and rigid labor market structural adjustments.
8. Italy
- Nominal GDP: $2.74 Trillion | PPP GDP: $3.87 Trillion | Per Capita: $46,505
- Growth Rate: 0.52%
- Economic Analysis: Italy’s economy relies on an export-oriented manufacturing base in its northern regions, specializing in luxury automobiles, industrial automation, pharmaceutical production, and high-end textiles.
- Macro Risk: Public sector debt servicing and structural regional economic disparities between North and South.
9. Russia
- Nominal GDP: $2.66 Trillion | PPP GDP: $7.53 Trillion | Per Capita: $18,525
- Growth Rate: 1.09%
- Economic Analysis: Russia’s economy is anchored by natural resources, defense-industrial state expenditures, and energy commodity exports to non-Western trading partners across Eurasia and Africa.
- Macro Risk: International financial restrictions, currency volatility, and sanctions-driven technology supply constraints.
10. Brazil
- Nominal GDP: $2.64 Trillion | PPP GDP: $5.23 Trillion | Per Capita: $12,313
- Growth Rate: 1.91%
- Economic Analysis: Brazil dominates Latin America’s economic landscape, propelled by agricultural exports (soybeans, beef, sugar), iron ore extraction via Vale, deepwater oil exploration, and a sophisticated fintech banking sector.
- Macro Risk: Fiscal deficit volatility and vulnerability to global commodity price cycles.
Methodology: How Economic Output is Measured
Evaluating economic scale requires understanding three primary economic indicators:
                  ┌────────────────────────────────────────────────┐
                  │          Gross Domestic Product (GDP)          │
                  └───────────────────────┬────────────────────────┘
                                          │
            ┌─────────────────────────────┼─────────────────────────────┐
            ▼                             ▼                             ▼
┌───────────────────────┐     ┌───────────────────────┐     ┌───────────────────────┐
│     Nominal GDP       │     │        PPP GDP        │     │    GDP Per Capita     │
├───────────────────────┤     ├───────────────────────┤     ├───────────────────────┤
│ Expressed in current  │     │ Adjusted for local    │     │ Total output divided  │
│ USD exchange rates.   │     │ purchasing power.     │     │ by population.        │
│ Identifies global     │     │ Reflects internal     │     │ Measures average      │
│ capital power.        │     │ economic scale.       │     │ living standard.      │
└───────────────────────┘     └───────────────────────┘     └───────────────────────┘
- Nominal GDP (Current Prices in USD): Measures the market value of all final goods and services produced within a country in a given year. Nominal values convert domestic output using prevailing market exchange rates. While ideal for assessing international purchasing power, it fluctuates with currency market swings.
- Purchasing Power Parity (PPP): Adjusts for relative price levels and local living costs using an international basket of goods. According to data methodology guides from the Bank for International Settlements (BIS), PPP offers a realistic view of domestic production capability and domestic consumer capacity.
- GDP Per Capita: Divides total economic output by total population. This distinguishes between sheer economic scale (e.g., India or China) and individual living standards (e.g., Switzerland, Luxembourg, or the United States).
Key Takeaways for Global Economic Trends
- The Shift Toward Multipolar Growth: Asia’s expanding market share—led by China, India, Indonesia, and Vietnam—continues to outpace global growth averages, shifting the center of gravity of manufacturing and consumption.
- Energy Transition Dynamics: Nations with sovereign clean tech supply chains (China) or independent nuclear grids (France) gain structural cost advantages over those dependent on imported fossil fuels.
- Demographics vs. Productivity: Aging populations across Europe and East Asia mean future expansion depends heavily on capital deployment into automation, AI infrastructure, and high-margin service exports.
Discover more from The Economy
Subscribe to get the latest posts sent to your email.
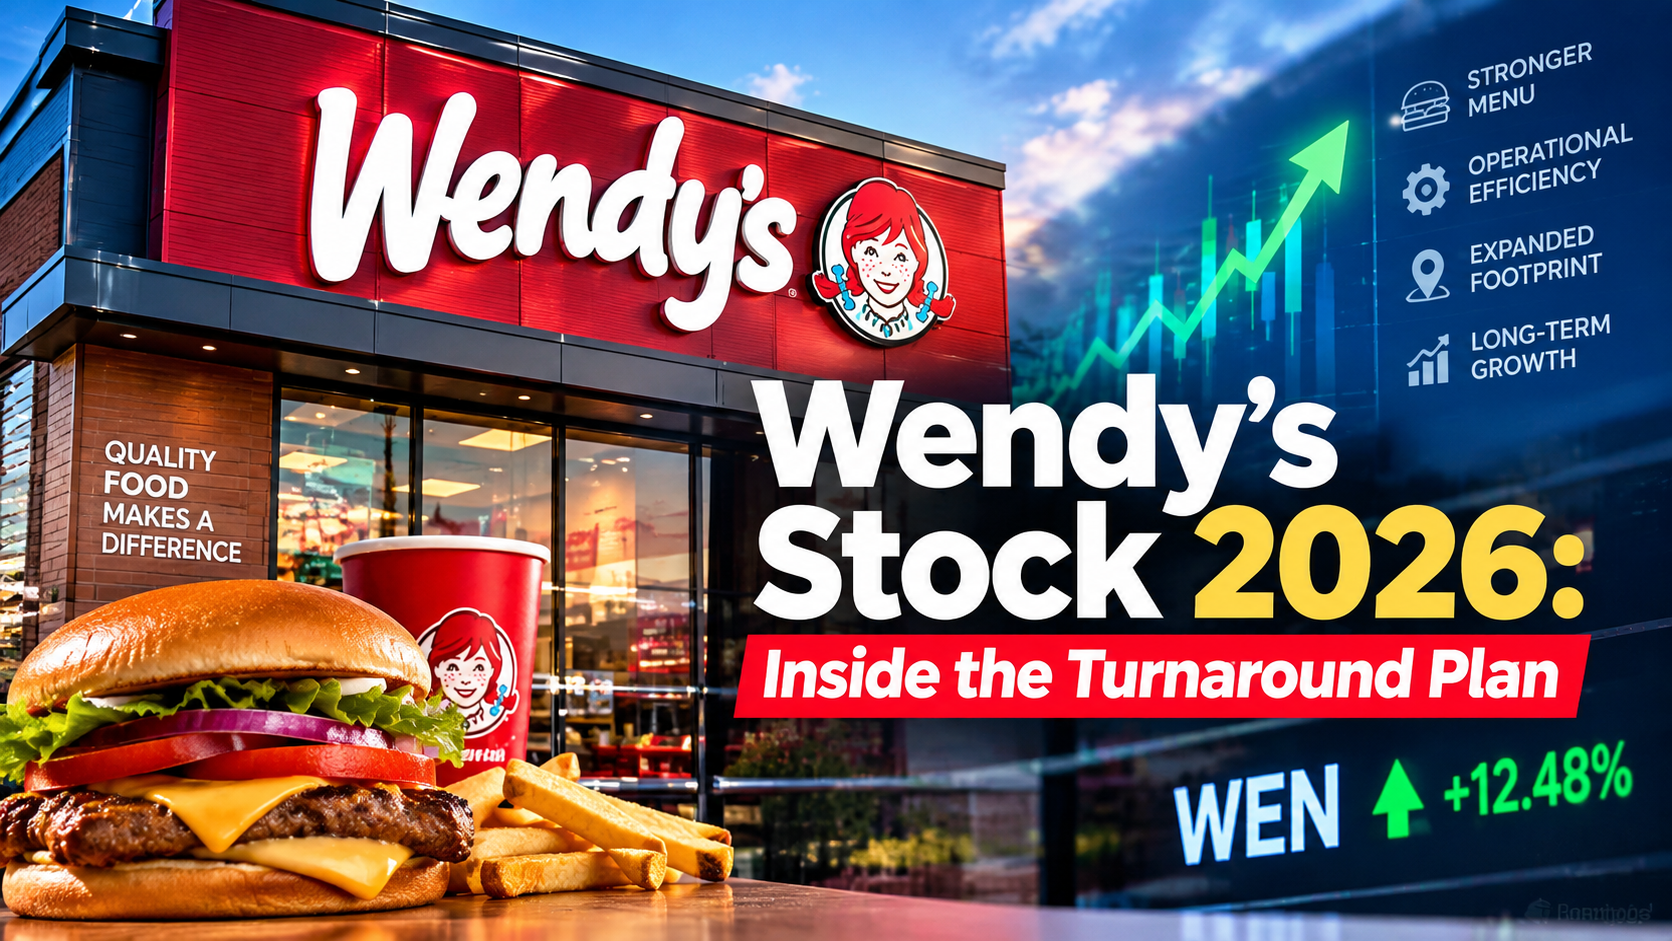
Why did Wendy’s stock fall in 2026? The Wendy’s Company withdrew its full-year 2026 financial outlook and cut its dividend to help fund a turnaround effort after reporting second-quarter results showing global systemwide sales down 6.5% year-over-year, according to the company’s official second-quarter earnings release. The decline was driven by an 8.2% drop in U.S. sales, only partially offset by 3.4% growth internationally — a split that has defined the company’s story for most of the year.
New leadership has been blunt about the scale of the problem. President and CEO Bob Wright, who returned to the company to lead the turnaround, said directly that traffic, the brand’s value proposition, and franchisee economics were not meeting expectations, while outlining five specific areas of focus: rebuilding a quality menu at compelling value, marketing that drives demand, operational excellence, a stronger digital experience, and turning restaurants themselves into a growth engine.
The Numbers Behind the Turnaround
Featured Snippet Target: Wendy’s Q2 2026 results showed revenue of $571 million, net income of $32.6 million, and adjusted EBITDA of $124.1 million, but global systemwide sales fell 6.5% year-over-year — driven primarily by an 8.2% U.S. sales decline — prompting the company to withdraw its full-year guidance and cut its dividend.
The pressure had been building for several quarters before the Q2 announcement. In the first quarter of 2026, Wendy’s reported revenue of $541 million (up 3.3% year-over-year) but adjusted earnings per share of just $0.12 — down 40% from $0.20 in the same quarter of 2025 — as global systemwide sales fell 5.5% on a constant-currency basis, driven by a 7.8% drop in U.S. same-restaurant sales, according to financial analysis from TIKR. Management attributed part of that decline to severe winter weather in January and February, alongside intentional operating-hour reductions tied to the company’s store-footprint optimization initiative, known internally as Project Fresh.
International growth has been the one consistent bright spot. Wendy’s international business delivered 6% systemwide sales growth in the first quarter, powered by new restaurant development in the Philippines and Mexico — a pattern that continued into the second quarter, when international sales grew 3.4% even as the U.S. business contracted sharply.
Is Project Fresh Actually Working?
Company-operated restaurants that have fully implemented the Project Fresh operational playbook outperformed the broader U.S. system by 310 basis points in same-restaurant sales during the first quarter, according to comments from Interim CEO and CFO Ken Cook on the Q1 earnings call — an early data point management has pointed to as evidence the turnaround approach works where it has actually been rolled out. On the subsequent Q4 earnings call, Cook told analysts that October marked the low point for the business, with sequential improvement through late 2025 and early 2026, before adverse January weather disrupted that recovery trend, according to call notes compiled by StockStory.
The restructuring has a real physical footprint: roughly 5% to 6% of U.S. Wendy’s locations are set to close, with most of those closures concentrated in the first half of 2026 — building on 240 U.S. location closures the chain had already carried out the prior year, according to reporting picked up by Fast Company. Franchisee buy-in has been a recurring analyst question on earnings calls, with Cook emphasizing frequent communication and flexibility as franchisees weigh whether the new operational playbook genuinely improves their unit economics.
What Wall Street Thinks
Analyst sentiment on Wendy’s stock has remained genuinely split rather than converging on a clear verdict. Coverage compiled by Barchart noted that the stock trades at roughly 12 times current-year earnings and under eight times 2030 forecasts — a valuation implying significant potential upside if the turnaround succeeds — but also flagged that the number of analysts covering the stock rose 30% in the first quarter of 2026 alone, with the resulting consensus landing on a “Hold” rating and a roughly even split between Buy and Sell recommendations. That’s an unusually wide disagreement for a large-cap consumer stock, reflecting genuine uncertainty about whether management’s turnaround playbook can offset structural share losses to competitors such as McDonald’s.
Rising beef costs added a separate layer of margin pressure through the first half of the year. Wendy’s Chief Accounting Officer and Global Head of FP&A Suzanne Thuerk indicated commodity inflation would run in the high single digits during the first half of 2026 due to double-digit beef inflation, before moderating to a low single-digit pace in the back half of the year as the company began cycling past the prior year’s elevated beef costs.
The Bottom Line
Wendy’s 2026 story is a genuine turnaround-in-progress rather than a settled outcome in either direction. The company has been transparent about the scale of its U.S. traffic and value-proposition problems, has a specific operational framework (Project Fresh) with early data suggesting it improves results where implemented, and has an international business that continues to grow steadily even as the U.S. core contracts. But the dividend cut, withdrawn guidance, and split analyst sentiment all signal that management itself is not yet confident enough in the pace of recovery to make firm forward commitments.
Next step: Investors and franchise-industry watchers should track same-restaurant sales trends specifically at fully-converted Project Fresh locations in upcoming quarters — that cohort, more than the blended company-wide average, is the clearest read on whether the turnaround strategy itself is working.
Discover more from The Economy
Subscribe to get the latest posts sent to your email.
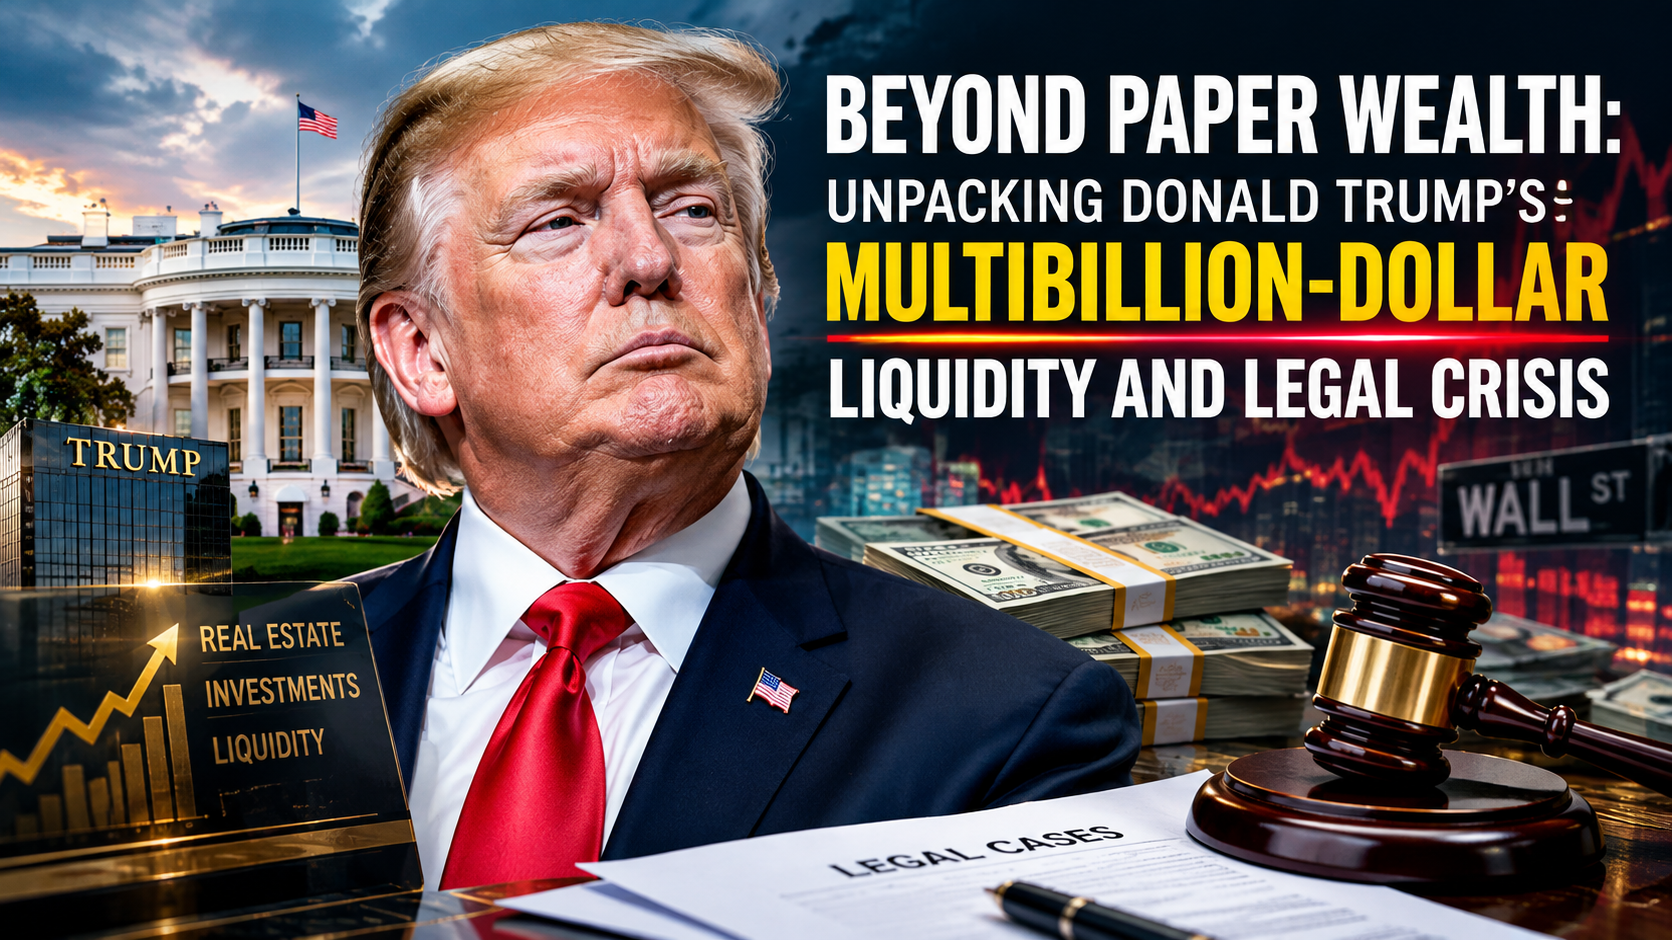
Former President Donald Trump’s financial balance sheet is undergoing unprecedented pressure. While his estimated net worth fluctuated dramatically following the public listing of Trump Media & Technology Group (TMTG), his real-world liquidity faces severe headwinds from court-ordered judgments, mounting interest, commercial real estate debt maturities, and escalating legal fees.
Understanding the magnitude of Trump’s financial landscape requires separating volatile paper equity from available cash, real estate assets, and legal liabilities.
1. The $454 Million Civil Fraud Judgment and Appeal Bond Dynamics
The largest immediate financial threat stems from New York State Supreme Court Judge Arthur Engoron’s ruling in the civil fraud lawsuit brought by New York Attorney General Letitia James.
- Initial Ruling: Trump was found liable for systematically inflating asset values to secure favorable loan terms and insurance rates.
- Financial Penalty: The court ordered disgorgement of approximately $354 million in ill-gotten gains, plus pre-judgment interest that pushed the initial obligation past $454 million.
- Accruing Interest: Statutory post-judgment interest accrues at 9% per annum (roughly $112,000 per day), steadily increasing the total debt while appeals proceed.
According to legal reporting from [Reuters], securing an appeal bond proved exceptionally difficult. Over 30 surety companies rejected Trump’s requests to guarantee the full amount without liquid collateral, as insurers overwhelmingly refuse to accept real estate as bond backing. An appellate bench subsequently allowed a reduced bond of $175 million, which Trump posted via Knight Specialty Insurance Company to stay enforcement while the appellate division reviews the merit of the ruling.
2. E. Jean Carroll Defamation Verdicts: $88.3 Million in Liability
In addition to state-level regulatory judgments, federal jury decisions in New York have created substantial financial commitments:
| Case | Jury Award | Status / Collateral Mechanism |
| Carroll I (Sexual Abuse & Defamation) | $5.0 Million | Placed in court-monitored escrow during appeal. |
| Carroll II (Defamation) | $83.3 Million | Secured via an $91.6 million appeal bond posted through Federal Insurance Co. (Chubb). |
As detailed by [CNBC], these judgments require collateralization regardless of ongoing appeals. Trump was forced to lock up cash or liquid securities to secure these bonds, directly contracting his available operational liquid reserves.
3. Trump Media (DJT): Paper Billions vs. Realizable Cash
The public debut of Trump Media & Technology Group Corp. (NASDAQ: DJT) via a SPAC merger briefly added billions to Trump’s paper net worth. However, financial analysts at [Forbes] note that transforming paper valuation into usable cash presents critical structural obstacles:
- Fundamental Disconnect: TMTG’s multi-billion-dollar valuation stands in stark contrast to its underlying balance sheet, which showed modest revenues against notable operational expenses.
- Market Impact of Cashing Out: Trump owns roughly 57% to 60% of the company. Any large-scale liquidation of his shares to cover cash liabilities risks signaling a loss of confidence, potentially triggering a sharp price decline before significant volume can be sold.
- Lock-Up Agreement Expirations: While lock-up restrictions initially prevented insider selling, the expiration of these periods subjects the stock to heightened market volatility and short-selling pressure.
4. Commercial Real Estate Exposure & Refinancing Headwinds
A substantial portion of Trump’s traditional wealth remains tied up in commercial real estate—a sector currently suffering from high interest rates, declining office occupancies, and tightened banking credit standards.
Trump Asset Portfolio Exposure
├── Commercial Properties (High debt exposure / Refinancing risk)
│   ├── 40 Wall Street (NYC)
│   └── Trump Tower Commercial Space (NYC)
├── Golf Courses & Resorts (Stable cash flow / High capital expenditure)
└── Brand Licensing & Cash Equivalents (Encumbered by legal escrow/bonds)
Key commercial debt obligations reported by [The Wall Street Journal] highlight specific vulnerabilities:
- 40 Wall Street (New York): The property’s debt was placed on lender watchlists in recent years due to rising vacancy rates, falling net operating income (NOI), and elevated ground-lease costs.
- Refinancing Risks: With commercial mortgage-backed securities (CMBS) debt maturing across several properties, refinancing in a high-rate environment significantly increases debt service payments, squeezing operational margins.
5. Political Action Committee (PAC) Legal Expense Drain
Legal fees have consumed a massive share of Trump’s available political fundraising funds. As documented by [The New York Times], Donald Trump’s leadership PAC, Save America, has spent tens of millions of dollars funding legal defense fees for the former president and co-defendants across multiple jurisdictions.
This drain on donor funds creates a dual liability:
- It diverts resources away from political field operations and advertising.
- It exposes the campaign structure to ongoing cash demands as criminal and civil proceedings drag on.
Financial Outlook & Solvency Risks
Trump’s asset portfolio is characterized by a strong imbalance between illiquid real estate equity and immediate cash demands.
Total Cash Demands (Judgments + Bonds Posted) : ~$260M+ Cash Restricted/Encumbered
Pending Liabilities (If Appeals Fail)        : ~$540M+ Total Direct Civil Cash Penalties
While Trump’s overall asset base—including golf courses, residential property, and brand licensing—remains valuable, his immediate solvency depends heavily on appellate court decisions. Should the appellate courts uphold the full civil fraud judgment without reduction, the need for immediate cash could force distressed asset sales or high-cost private equity financing, fundamentally altering the Trump Organization’s financial baseline.
Discover more from The Economy
Subscribe to get the latest posts sent to your email.

Solar Panel Installation Cost in 2026: Why the Math Changed Overnight

Business Insurance: What Coverage You Actually Need and What It Costs in 2026

Auto Insurance Quotes: How to Get the Lowest Rate Without Losing Coverage

Huntington Online Banking: Full Features, Fees, and How It Compares in 2026

Apply for a Bank Account Online: What You Need and How Long It Actually Takes

World’s Largest Economies: Ranking the Top Global Powers

Business Loan: A Complete 2026 Guide to Rates, Types, and Qualifying

Fast Invoice Factoring: How to Turn Unpaid Invoices Into Cash Within 24 Hours

Investment Banking Services: What They Cost and How to Choose the Right Firm in 2026

Structured Settlement Loan: What “Cash Now” Offers Actually Cost You

DUI Attorney: Why Your First Call After an Arrest Should Never Be to the Court

Personal Injury Lawyer: A Complete Guide to Filing Your Claim in 2026

Commercial Vehicle Accident Lawyer: Holding Companies Accountable Beyond the Driver

Inside the White House Feud: How Trump’s Allies Are Painting Anthropic’s Dario Amodei as the Face of ‘AI Doomerism’

Top 30 Stocks for Investment in PSX for Massive ROI in 2026

SpaceX Starship Flight 14: First Orbital Attempt & Starlink V3 Launch Explained

Oil Prices Break $100 in 2026: Middle East Conflict & Energy Markets

Fidelity Investments Review 2026: SPAXX Yields & Zero-Fee Funds

AI Chip Stocks 2026: The Best Semiconductor Investments Beyond Marvell

BRICS+ Cross-Border Payments 2026: Interoperability Explained

Tween Back-to-School Trends 2026: What’s Driving the $85B Season

10-Year Treasury Yield Hits 4.80%: What It Means for Rates & Portfolios

Shein Clothes Quality & Safety in 2026: What Lab Tests Show

China’s US$10.8 Billion Trade Shortcut: Why the Pinglu Canal Matters

MRVL Earnings 2026: Why Marvell Sank Despite Beating Estimates

IMF & World Bank 2026 Global Economic Outlook: Growth, Inflation, Debt

High-CPM Finance Niches 2026: Publisher Monetization Blueprint

Middle East War Economics 2026: Oil Prices & Energy Markets
-

 Markets & Finance9 months ago
Top 15 Stocks for Investment in 2026 in PSX: Your Complete Guide to Pakistan’s Best Investment Opportunities
-

 Analysis7 months ago
Johor’s Investment Boom: The Hidden Costs Behind Malaysia’s Most Ambitious Economic Surge
-

 Analysis7 months ago
Top 10 Stocks for Investment in PSX for Quick Returns in 2026
-

 Banks8 months ago
Best Investments in Pakistan 2026: Top 10 Low-Price Shares and Long-Term Picks for the PSX
-

 Analysis8 months ago
Brazil’s Rare Earth Race: US, EU, and China Compete for Critical Minerals as Tensions Rise
-

 Investment9 months ago
Top 10 Mutual Fund Managers in Pakistan for Investment in 2026: A Comprehensive Guide for Optimal Returns
-

 Global Economy9 months ago
15 Most Lucrative Sectors for Investment in Pakistan: A 2025 Data-Driven Analysis
-

 Global Economy9 months ago
Pakistan’s Export Goldmine: 10 Game-Changing Markets Where Pakistani Businesses Are Winning Big in 2025