
Exclusive
What Trump Said About the U.S. Economy at Davos — and What the Data Reveals
The alpine air in Davos was brisk on January 23, 2026, but the atmosphere inside the Congress Centre was even icier. President Donald Trump, addressing the World Economic Forum via video link for the second time in his current term, delivered a characteristically bold assessment of the American economy—one that painted a portrait of roaring industrial revival, plummeting energy costs, and imminent housing affordability.
His tone was triumphant, his claims sweeping. Yet in the ornate hall where global elites gathered, the reaction was notably muted. Polite applause punctuated pauses, but skeptical glances were exchanged among finance ministers and CEOs who’ve been parsing the actual trajectory of U.S. economic indicators since Trump’s so-called “Liberation Day” tariffs took effect last April.
Trump’s Davos economy speech in 2026 was vintage political theater—part victory lap, part sales pitch to international investors. He touted a manufacturing renaissance driven by his tariff regime, pledged to make America a “nation of owners, not renters,” and criticized European energy policy while boasting of American dominance at the pump. These proclamations resonated with his domestic base watching from home, but they landed awkwardly among an audience acutely aware of contradictory data emerging from U.S. federal agencies, independent research institutions, and global markets.
This disconnect between rhetoric and reality isn’t merely academic. As the world’s largest economy navigates an era of protectionist trade policy, elevated interest rates, and geopolitical volatility, understanding what Trump actually said at Davos—and how it compares to verifiable economic data—matters profoundly for investors, policymakers, and citizens alike. What follows is a rigorous examination of the president’s key claims, measured against the latest available evidence from the Bureau of Labor Statistics, Federal Reserve databases, energy markets, and housing sector analytics.
Key Highlights From Trump’s Davos 2026 Address
President Trump’s virtual address touched on several core economic themes that have defined his second term. Here are the most significant quotes and policy assertions from his speech:
- On tariffs and manufacturing: “We’ve unleashed the greatest factory boom in American history. Companies are pouring back into our country because they know tariffs mean business stays home. The Liberation Day tariffs are working exactly as planned.”
- On housing affordability: “We’re going to make America a nation of owners again, not renters. Homeownership is the American Dream, and my administration is cutting through red tape and bringing down costs so every family can achieve it.”
- On energy dominance: “American energy is the cheapest in the world. While Europe pays through the nose for inefficient green policies, Americans are filling up their tanks for less than they have in years. We’re producing more oil and gas than ever before.”
- On trade negotiations: “Countries that have ripped us off for decades are finally coming to the table with fair deals. We’re not backing down. America First means America wins.”
- On global competitiveness: “Investment is flooding into the United States. The world knows we’re the safest, strongest economy on the planet, and that’s not changing under my watch.”
These talking points were delivered with Trump’s characteristic confidence, designed to project strength and economic competence to both domestic and international audiences. But each claim invites scrutiny against measurable outcomes.

Tariffs and Trade Policy: Manufacturing Boom or Industrial Backfire?
Perhaps no aspect of Trump’s economic agenda has been more contentious than his aggressive use of tariffs. The “Liberation Day” tariffs announced on April 2, 2025, imposed sweeping levies on imports from China, the European Union, and other major trading partners—ostensibly to protect American manufacturing and force better trade terms. At Davos, Trump framed this policy as an unqualified success, claiming it sparked a “factory boom” that’s bringing industrial jobs flooding back to American shores.
The data tells a markedly different story. According to the Bureau of Labor Statistics, U.S. manufacturing employment has declined in seven of the nine months following the April 2025 tariff implementation. The sector shed approximately 43,000 jobs between April and December 2025, with particularly steep losses in auto parts manufacturing, electronics assembly, and metals fabrication—industries heavily dependent on integrated global supply chains that tariffs disrupted.
More revealing still is the trajectory of factory construction spending, a leading indicator of long-term industrial investment confidence. Federal Reserve Economic Data (FRED) from the St. Louis Fed tracks this metric closely through its TLMFGCONS series, which measures total manufacturing construction spending in millions of dollars. This data shows factory construction spending peaked in mid-2024 at approximately $225 billion annually, then began a steady decline through October 2025 (the most recent data available), falling to roughly $198 billion—a drop of about 12% that coincides almost precisely with the tariff rollout and subsequent supply chain reconfiguration costs.
The disconnect between Trump’s triumphalist rhetoric and these government statistics isn’t easily explained away. Economists at the Peterson Institute for International Economics have noted that while some reshoring announcements made headlines in 2025, many represented planned investments predating the tariffs, while others were subsequently canceled or scaled back as companies confronted the reality of higher input costs and retaliatory measures from trading partners.
The European Union’s counter-tariffs on American agricultural exports, for instance, have devastated Midwest soybean farmers—a politically sensitive constituency that Trump carried heavily in 2024. China’s pivot toward Brazilian and Argentine suppliers for industrial commodities has cost U.S. producers an estimated $18 billion in lost export revenue since mid-2025, according to the U.S. Department of Agriculture.
What Trump didn’t mention at Davos were these unintended consequences: rising input costs for American manufacturers who depend on imported components, retaliatory tariffs hammering export-oriented sectors, and investment hesitation as companies await clarity on whether tariff rates represent permanent policy or negotiating theater. The National Association of Manufacturers—hardly a liberal advocacy group—issued a cautious statement in December 2025 noting that while some tariff protections benefited specific industries, the overall impact had been “mixed at best” with supply chain disruptions offsetting gains.
Financial markets have reflected this ambiguity. The S&P Manufacturing PMI has hovered around the 50-point threshold separating expansion from contraction for most of late 2025, suggesting an industrial sector treading water rather than surging forward. For context, the manufacturing PMI averaged 52.8 in 2023 and 51.6 in 2024—both higher than the current reading, despite those years preceding Trump’s “factory boom” tariffs.
Housing Affordability: Bold Promises Meet Stubborn Market Realities
Trump’s pledge to transform America into “a nation of owners, not renters” resonated emotionally at Davos, tapping into a deep anxiety about housing affordability that transcends partisan divisions. The president pointed to regulatory rollbacks his administration has pursued, including attempts to streamline federal environmental reviews for residential development and pressure on local zoning boards to permit higher-density construction.
Yet housing affordability in January 2026 remains stubbornly elusive for most American households. The median existing home price stands at approximately $412,000 according to the National Association of Realtors—up 4.8% from January 2025 and nearly 47% higher than pre-pandemic levels in early 2020. Meanwhile, mortgage rates, while down slightly from their 2023 peaks, remain elevated at around 6.7% for a 30-year fixed-rate loan as of mid-January 2026, according to Freddie Mac’s Primary Mortgage Market Survey.
This combination—high prices plus high borrowing costs—has crushed affordability for first-time buyers. The monthly payment on that median-priced home with a standard 20% down payment now exceeds $2,200, compared to roughly $1,400 in early 2020. Real wage growth, while positive in some sectors, hasn’t kept pace. The result: homeownership rates have actually ticked downward slightly since Trump took office in January 2025, from 65.7% to 65.4% as of Q4 2025, per Census Bureau data.
The core challenge Trump’s rhetoric glosses over is supply. The United States has underbuilt housing for more than a decade relative to household formation, creating a structural deficit economists estimate at 3-4 million units. Regulatory streamlining—while potentially helpful at the margins—cannot quickly overcome labor shortages in construction (a sector that lost workers during the pandemic and hasn’t fully recovered), elevated materials costs (partly driven by tariffs on imported lumber and steel), and local political resistance to density that federal policy struggles to override.
Trump’s housing proposals have focused heavily on demand-side interventions—tax credits for first-time buyers, pressure on the Federal Reserve to lower interest rates—while offering less concrete action on supply constraints. The Federal Reserve, notably, has maintained its benchmark interest rate in the 4.25-4.50% range through early 2026, citing persistent inflation concerns partly related to tariff-driven price increases, effectively limiting how much mortgage rates can fall in the near term.
At Davos, Trump criticized rental markets and institutional investors purchasing single-family homes, rhetoric that polls well but doesn’t address why those investors find the market attractive in the first place: insufficient supply creates pricing power. Without a credible, large-scale plan to accelerate homebuilding—particularly affordable starter homes—the homeownership dream Trump invoked remains out of reach for millions.
Energy Dominance: Low Pump Prices and the European Contrast
On energy, Trump’s Davos messaging was characteristically combative. He contrasted what he described as America’s energy abundance and low consumer prices with Europe’s expensive, unreliable renewable transition—a critique designed to validate his administration’s “drill, baby, drill” philosophy and continued support for fossil fuel production.
Here, Trump’s claims align more closely with observable reality—though not quite as cleanly as his speech suggested. The average price of regular gasoline in the United States in mid-January 2026 sits at approximately $3.18 per gallon, according to AAA data. This represents a meaningful decline from the $3.85 average a year prior and is well below the peak of nearly $5.00 reached in summer 2022. American consumers are indeed paying less at the pump than most European counterparts, where taxes and carbon pricing keep fuel costs significantly higher.
U.S. crude oil production has remained robust, averaging about 13.2 million barrels per day in late 2025—near record levels—according to the Energy Information Administration. Natural gas production similarly continues at historic highs, supporting both domestic consumption and liquefied natural gas (LNG) exports that have made the United States a major global supplier, particularly to Europe following the disruption of Russian pipeline gas.
However, Trump’s portrayal omits crucial context. First, much of America’s oil and gas production boom predates his current term, accelerating during the 2010s shale revolution under both Obama and first-term Trump policies. Current production levels largely reflect long-cycle investments made years ago, plus market dynamics (higher global prices incentivizing drilling) rather than specific Trump administration actions since January 2025.
Second, while pump prices have fallen, this owes considerably to global crude oil market conditions—including OPEC+ production discipline weakening, demand growth in China slowing, and mild winter weather in the Northern Hemisphere reducing heating fuel consumption. The president’s energy policies, which primarily involve expanding federal leasing for drilling and rolling back emissions regulations, contribute at the margins but don’t singularly determine prices set in global markets.
Third, Trump’s critique of European energy policy ignores the rationale driving it: long-term energy security and climate mitigation. European leaders at Davos—while diplomatically refraining from direct rebuttals—have argued consistently that initial transition costs will yield strategic independence from volatile fossil fuel suppliers and position Europe competitively in clean technology manufacturing. Whether that bet pays off remains uncertain, but dismissing it as mere inefficiency oversimplifies a complex strategic calculation.
The energy picture Trump painted is thus partially accurate—Americans benefit from abundant domestic resources and relatively low prices—but his framing omits market complexities and overstates his administration’s causal role in outcomes substantially shaped by factors beyond presidential control.
Broader Implications for the U.S. and Global Economy in 2026
Stepping back from individual claims, Trump’s Davos appearance reflected a fundamental tension in his economic approach: confidence-building narratives aimed at sustaining business and consumer sentiment versus tangible policy outcomes that frequently disappoint the rhetoric’s promises.
From a global investor perspective, the United States retains substantial advantages—deep capital markets, technological leadership in AI and biotech, rule of law, and demographic dynamism relative to aging competitors like Japan and much of Europe. These structural strengths mean capital continues flowing into dollar-denominated assets despite policy uncertainties. U.S. equity markets have performed reasonably well through early 2026, with the S&P 500 up modestly year-to-date, suggesting investors see growth continuing even if not at the torrid pace Trump advertises.
Yet risks are accumulating. The tariff regime has introduced unpredictability into supply chains and raised costs that companies are increasingly passing to consumers, contributing to inflation persistence that constrains Federal Reserve flexibility. Manufacturing weakness, if sustained, could ripple into broader labor markets. Housing unaffordability threatens to become a generational crisis, with implications for wealth accumulation and social mobility. Trade partners are diversifying away from dollar dependence and U.S. supply chains where possible—a slow-moving but significant shift.
Economists surveyed by the Financial Times in early January projected U.S. GDP growth of 2.1% for 2026—solid but unspectacular, and down from 2.5% in 2025. Inflation is expected to remain around 2.8-3.0%, above the Fed’s 2% target, partly due to tariff effects. Unemployment, currently at 4.1%, is forecast to edge up slightly as labor demand softens. This is hardly a crisis scenario, but neither is it the “greatest economy ever” Trump routinely invokes.
The Davos audience—sophisticated actors who allocate capital based on probabilities, not slogans—likely digested Trump’s speech with professional detachment. They understand political leaders must project optimism. But they also track hard data, and that data suggests an economy of contradictions: resilient fundamentals shadowed by self-inflicted policy wounds, rhetorical confidence masking sectoral stress, and a president whose economic promises consistently outpace deliverable results.
Conclusion: Parsing Rhetoric From Reality in an Election Season
Trump’s Davos economy speech in 2026 was quintessential political communication—designed to shape perception, rally supporters, and project American strength to global elites. For those inclined to support the president, it offered reassurance that his policies are working. For skeptics, it provided fresh evidence of a widening gap between political messaging and economic fundamentals.
The reality, as data demonstrates, is more nuanced than either Trump’s boosters or critics typically acknowledge. Manufacturing isn’t booming, but neither has it collapsed. Housing affordability remains a serious challenge, yet homeownership rates haven’t cratered. Energy production is strong, though not uniquely attributable to current policies. Tariffs have created winners and losers, with aggregate effects tilting negative but not catastrophic.
What matters most for Americans trying to navigate this landscape—whether as workers, investors, or voters—is maintaining clear-eyed assessment grounded in verifiable information. Presidential speeches at global forums like Davos will always blend aspiration with salesmanship. The antidote is rigorous engagement with data from non-partisan sources: the Bureau of Labor Statistics for employment, the Federal Reserve for construction and monetary policy, the Census Bureau for housing, and the Energy Information Administration for production and prices.
As 2026 unfolds and another election cycle looms, these numbers—not political rhetoric—will determine whether Trump’s economic legacy is ultimately judged as successful stewardship or overpromised underdelivery. The Davos speech offered a preview of the narrative he’ll run on. The data provides the standard against which that narrative must be measured.
Discover more from The Economy
Subscribe to get the latest posts sent to your email.


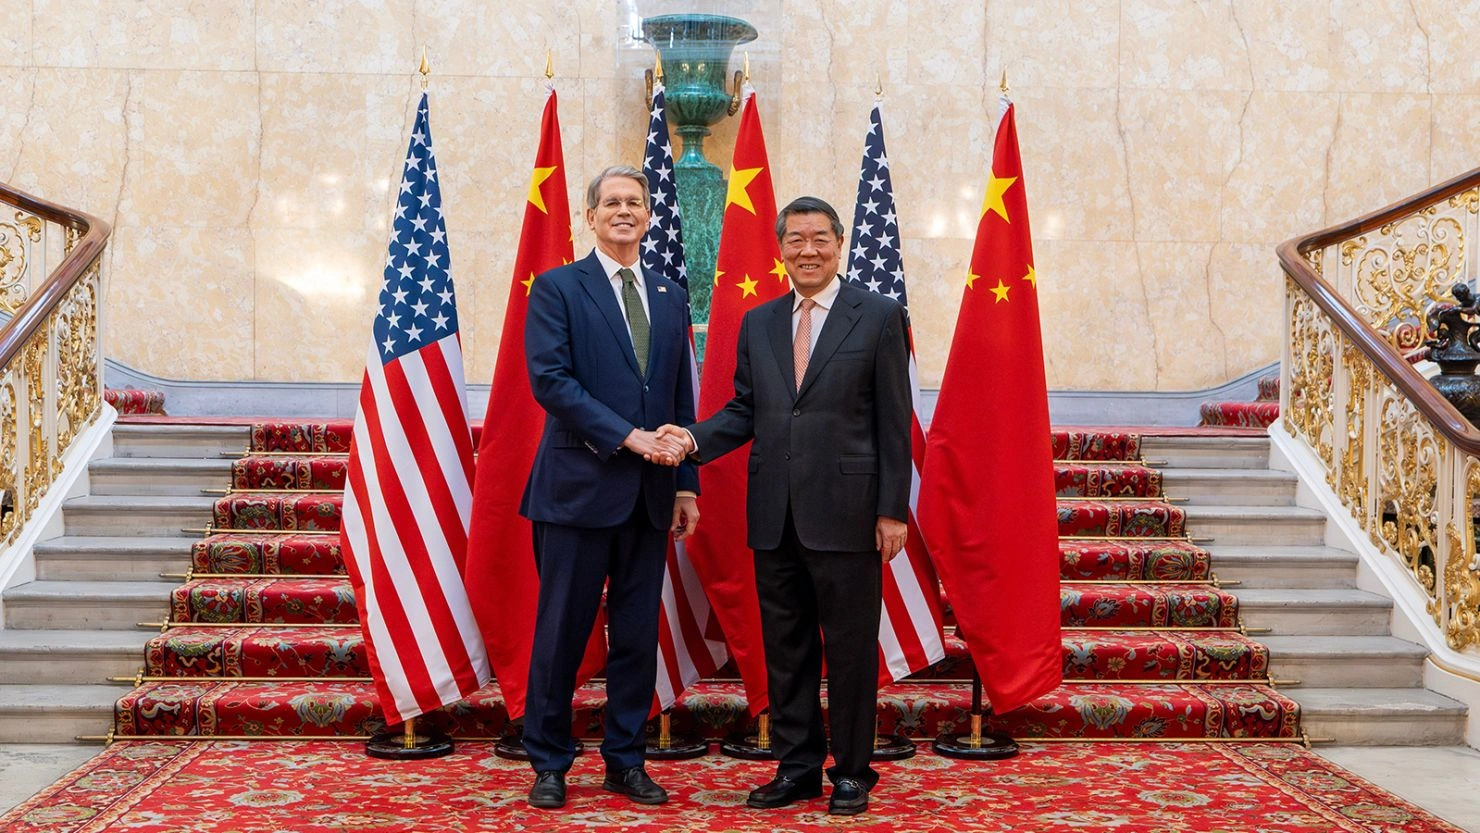
Bessent and He Lifeng meet at OECD Paris to review the Busan trade truce before Trump’s Beijing summit. Rare earths, Hormuz oil shock, and Section 301 cloud the path ahead.
The 16th arrondissement of Paris is not a place that announces itself. Discreet, residential, its wide avenues lined with haussmann facades, it is the kind of neighbourhood where power moves quietly. On Sunday morning, as French voters elsewhere in the city queued outside polling stations for the first round of local elections, a motorcade slipped through those unassuming streets toward the headquarters of the Organisation for Economic Co-operation and Development. Inside, the world’s two largest economies were attempting something rare in 2026: a structured, professional conversation.
Talks began at 10:05 a.m. local time, with Vice-Premier He Lifeng accompanied by Li Chenggang, China’s foremost international trade negotiator, while Treasury Secretary Scott Bessent arrived flanked by US Trade Representative Jamieson Greer. South China Morning Post Unlike previous encounters in European capitals, the delegations were received not by a host-country official but by OECD Secretary-General Mathias Cormann South China Morning Post — a small detail that spoke volumes. France was absorbed in its own democratic ritual. The world’s most consequential bilateral relationship was, once again, largely on its own.
The Stakes in Paris: More Than a Warm-Up Act
It would be tempting to dismiss the Paris talks as logistical scaffolding for a grander event — namely, President Donald Trump’s planned visit to Beijing at the end of March for a face-to-face with President Xi Jinping. That reading would be a mistake. The discussions are expected to cover US tariff adjustments, Chinese exports of rare earth minerals and magnets, American high-tech export controls, and Chinese purchases of US agricultural commodities CNBC — a cluster of issues that, taken together, constitute the structural skeleton of the bilateral relationship.
Analysts cautioned that with limited preparation time and Washington’s strategic focus consumed by the US-Israeli military campaign against Iran, the prospects for any significant breakthrough — either in Paris or at the Beijing summit — remain constrained. Investing.com As Scott Kennedy, a China economics specialist at the Center for Strategic and International Studies, put it with characteristic precision: “Both sides, I think, have a minimum goal of having a meeting which sort of keeps things together and avoids a rupture and re-escalation of tensions.” Yahoo!
That minimum — preserving the architecture of the relationship, not remodelling it — may, in the current environment, be ambitious enough.
Busan’s Ledger: What Has Been Delivered, and What Has Not
The two delegations were expected to review progress against the commitments enshrined in the October 2025 trade truce brokered by Trump and Xi on the sidelines of the APEC summit in Busan, South Korea. Yahoo! On certain metrics, the scorecard is encouraging. Washington officials, including Bessent himself, have confirmed that China has broadly honoured its agricultural obligations under the deal Business Standard — a meaningful signal at a moment when diplomatic goodwill is scarce.
The soybean numbers are notable. China committed to purchasing 12 million metric tonnes of US soybeans in the 2025 marketing year, with an escalation to 25 million tonnes in 2026 — a procurement schedule that begins with the autumn harvest. Yahoo! For Midwestern farmers and the commodity desks that serve them, these are not abstractions; they are the difference between a profitable season and a foreclosure notice.
But the picture darkens considerably when attention shifts to critical materials. US aerospace manufacturers and semiconductor companies are experiencing acute shortages of rare earth elements, including yttrium — a mineral indispensable in the heat-resistant coatings that protect jet engine components — and China, which controls an estimated 60 percent of global rare earth production, has not yet extended full export access to these sectors. CNBC According to William Chou, a senior fellow at the Hudson Institute, “US priorities will likely be about agricultural purchases by China and greater access to Chinese rare earths in the short term” Business Standard at the Paris talks — a formulation that implies urgency without optimism.
The supply chain implications are already registering. Defence contractors reliant on rare-earth permanent magnets for guidance systems, electric motors in next-generation aircraft, and precision sensors are operating on diminished buffers. The Paris talks, if they yield anything concrete, may need to yield this above all.
A New Irritant: Section 301 Returns
Against this backdrop of incremental compliance and unresolved bottlenecks, the US side has introduced a fresh complication. Treasury Secretary Bessent and USTR Greer are bringing to Paris a new Section 301 trade investigation targeting China and 15 other major trading partners CNBC — a revival of the legal mechanism previously used to justify sweeping tariffs during the first Trump administration. The signal it sends is deliberately mixed: Washington is simultaneously seeking to consolidate the Busan framework and reserving the right to escalate it.
For Chinese negotiators, the juxtaposition is not lost. Beijing has staked considerable domestic political credibility on the proposition that engagement with Washington produces tangible results. A Section 301 investigation, even if procedurally nascent, raises the spectre of a new tariff architecture layered atop the existing one — and complicates the case for continued compliance within China’s own policy bureaucracy.
The Hormuz Variable: When Geopolitics Enters the Room
No diplomatic meeting in March 2026 can be quarantined from the wider strategic environment, and the Paris talks are no exception. The ongoing US-Israeli military campaign against Iran has introduced a variable of potentially severe economic consequence: the partial closure of the Strait of Hormuz, the narrow waterway through which approximately a fifth of the world’s oil passes.
China sources roughly 45 percent of its imported oil through the Strait, making any disruption there a direct threat to its industrial output and energy security. Business Standard After US forces struck Iran’s Kharg Island oil loading facility and Tehran signalled retaliatory intent, President Trump called on other nations to assist in protecting maritime passage through the Strait. CNBC Bessent, for his part, issued a 30-day sanctions waiver to permit the sale of Russian oil currently stranded on tankers at sea CNBC — a pragmatic, if politically contorted, attempt to soften the energy-price spike.
For the Paris talks, the Hormuz dimension introduces a paradox. China has an acute economic interest in stabilising global oil flows and might, in principle, be receptive to coordinating with the United States on maritime security. Yet Beijing’s deep reluctance to be seen as endorsing or facilitating US-led military operations in the Middle East constrains how far it can go. The corridor between shared interest and political optics is narrow.
What Trump Wants in Beijing — and What Xi Can Deliver
With Trump’s Beijing visit now functioning as the near-term endpoint of this diplomatic process, the outlines of a summit package are beginning to take shape. The US president is expected to seek major new Chinese commitments on Boeing aircraft orders and expanded purchases of American liquefied natural gas Yahoo! — both commercially significant and symbolically resonant for domestic audiences. Boeing’s recovery from years of regulatory and reputational turbulence has made its order book a quasi-barometer of US industrial confidence; LNG exports represent a strategic diversification of American energy diplomacy.
For Xi, the calculus involves threading a needle between delivering enough to make the summit worthwhile and conceding so much that it invites criticism at home from nationalist constituencies already sceptical of engagement. China’s state media has consistently characterised the Paris talks as a potential “stabilising anchor” for an increasingly uncertain global economy Republic World — language carefully chosen to frame engagement as prudent statecraft rather than capitulation.
The OECD itself, whose headquarters serves as neutral ground for today’s meeting, cut its global growth forecast earlier this year amid trade fragmentation fears — underscoring that the bilateral relationship between Washington and Beijing carries systemic weight far beyond its two principals. A credible summit, even one short of transformative, would send a signal to investment desks and central banks from Frankfurt to Singapore that the world’s two largest economies retain the institutional capacity to manage their rivalry.
The Road to Beijing, and Beyond
What happens in the 16th arrondissement today will not resolve the structural tensions that define the US-China relationship in this decade. The rare-earth bottleneck is systemic, not administrative. The Section 301 investigation reflects a bipartisan American political consensus that China’s industrial subsidies represent an existential competitive threat. And the Iran war has introduced a geopolitical variable that neither side fully controls.
But the Paris talks serve a purpose that transcends their immediate agenda. They demonstrate, to a watching world, that diplomacy between great powers remains possible even as military operations unfold and supply chains fracture. They keep open the channels through which, eventually, more durable arrangements might be negotiated — whether at a Beijing summit, at the G20 in Johannesburg later this year, or in another European capital where motorcades slip, unannounced, through quiet streets.
The minimum goal, as CSIS’s Kennedy observed, is avoiding rupture. In the spring of 2026, with the Strait of Hormuz partially closed and yttrium shipments stalled, that minimum has acquired the weight of ambition.
Discover more from The Economy
Subscribe to get the latest posts sent to your email.

On a Friday afternoon in early March, Boeing’s stock did something it hadn’t done in months: it surged. Shares of the aerospace giant jumped as much as 4 percent — the best performance on the Dow Jones Industrial Average that day — after Bloomberg reported that the company is closing in on one of the largest aircraft sales in its 109-year history. The prize: a 500-aircraft order for 737 Max jets from China, to be unveiled when President Donald Trump makes his first state visit to Beijing since 2017 — scheduled for March 31 to April 2.
If confirmed, the deal would represent nothing less than Boeing’s formal re-entry into the world’s second-largest aviation market after years of diplomatic cold-shouldering, safety-related groundings, and trade-war turbulence. It would also cement a pattern that has quietly defined Trump’s second term: the systematic use of America’s largest exporter as a diplomatic sweetener in geopolitical negotiations.
The Numbers Behind the Boeing 737 Max China Deal
Let’s be precise about what is reportedly on the table. According to people familiar with the negotiations cited by Bloomberg, the headline figure is 500 Boeing 737 Max jets — narrowbody, single-aisle workhorses that form the backbone of Chinese domestic aviation. Separately, the two sides are in advanced discussions over a widebody package of approximately 100 Boeing 787 Dreamliners and 777X jets, though that portion of the deal is expected to be announced at a later date and would not feature in the Trump-Xi summit communiqué.
At current list prices — the 737 Max 8 carries a sticker price of roughly $101 million per aircraft — the narrowbody package alone would approach $50 billion in nominal terms before the standard deep discounts that large airline orders attract. Factor in the widebody tranche, and the full package could eventually represent the single largest bilateral aviation deal ever struck between the United States and China.
Boeing itself declined to comment. China’s Ministry of Commerce did not respond to requests outside regular hours. The White House offered no immediate statement. But the market spoke clearly enough.
A Decade of Order Drought — and Why China Needs Boeing Now
To appreciate the magnitude of this potential agreement, consider the context. China once made up roughly 25 percent of Boeing’s order book. Today, Boeing holds only 133 confirmed orders from Chinese airlines — approximately 2 percent of its total book. Investing.com That collapse in Chinese demand was not accidental. It was the deliberate consequence of a cascade of crises: the global grounding of the 737 Max following two fatal crashes in 2018 and 2019, the trade tensions of Trump’s first term, and the pandemic-era freeze on civil aviation procurement.
Yet Chinese airlines have been quietly suffocating under constrained fleet capacity. Aviation analysts and industry sources say China needs at least 1,000 imported planes to maintain growth and replace older aircraft. WKZO The country’s carriers — Air China, China Eastern, China Southern — are operating aging fleets while passenger demand has rebounded sharply. The arithmetic of Chinese aviation is unforgiving: a country of 1.4 billion people, a rapidly expanding middle class, and a domestic network that still relies heavily on Western-certified jet technology cannot simply wait indefinitely for political stars to align.
Beijing has also been hedging. China is simultaneously in talks for another 500-jet order with Airbus that would be in addition to any Boeing deal — negotiations that have been in on-off discussions since at least 2024. WKZO But Airbus has its own capacity constraints and delivery backlogs. The reality is that both European and American planemakers are needed to feed China’s aviation appetite, which gives Boeing considerable strategic leverage — if it can navigate the politics.
Trump’s Boeing Diplomacy: A Playbook Refined
There is a recognizable pattern here, and it is worth naming explicitly. Trump has used Boeing as a tool to sweeten accords with other governments Yahoo Finance, and the China deal fits squarely within that framework. Earlier in his second term, large Boeing orders from Gulf carriers and Southeast Asian airlines followed Trump diplomatic visits — deals that generated political headlines and tangible employment commitments in American manufacturing states.
The Beijing summit, however, would be the most significant deployment of this strategy yet. US-China trade tensions have been acute in early 2026. Trump threatened to impose export controls on Boeing plane parts in Washington’s response to Chinese export limits on rare earth minerals. Yahoo Finance During earlier trade clashes, Beijing ordered Chinese airlines to temporarily stop taking deliveries of new Boeing jets — before resuming later that spring. WKZO
That on-off pattern illustrates the extraordinary vulnerability of commercial aviation to geopolitical temperature. Unlike soybeans or semiconductors, a Boeing 737 Max is not a fungible commodity. It requires years of certified maintenance infrastructure, pilot training, and regulatory framework built around American aviation standards. Both sides know this, which is precisely why aircraft orders have become such potent bargaining chips.
The planned summit structure — Trump in Beijing from March 31 to April 2, followed by Xi visiting Washington later in the year — also suggests a two-stage negotiation architecture. The 737 Max order would serve as a confidence-building gesture at the first meeting; the widebody 787 and 777X tranche would follow as trust is consolidated.
Boeing’s Recovery Trajectory: Why Timing Matters
For Boeing CEO Kelly Ortberg, the timing of a China breakthrough could scarcely be more critical. Boeing’s total company backlog grew to a record $682 billion in 2025, primarily reflecting 1,173 commercial aircraft net orders for the year, with all three segments at record levels. Boeing Yet the Chinese market has remained conspicuously absent from that recovery story.
Boeing has achieved FAA approval to increase 737 Max production to 42 jets per month, a significant step toward restoring manufacturing capacity, and the company plans to raise 787 Dreamliner output to 10 aircraft per month during 2026. Investing.com In short, for the first time in several years, Boeing actually has the industrial capacity to absorb a massive new order. Management has targeted approximately 500 737 deliveries in 2026 and 787 deliveries of roughly 90–100 aircraft, while targeting positive free cash flow of $1–3 billion for the year. TipRanks
A confirmed China order of this scale would not merely boost the backlog — it would validate the entire recovery narrative. It would signal to Wall Street that the 737 Max safety rebound is complete, that Chinese regulators have definitively recertified the aircraft, and that geopolitical risk has sufficiently receded to justify multi-year procurement commitments. As Reuters reported, Boeing’s share price rose 3.7 percent on the news — but analysts caution that several sticking points remain unresolved, and a deal is not yet assured.
Aviation Ripple Effects: What a China Mega-Deal Means for Global Travelers
The significance of a Boeing 737 Max China order in 2026 extends well beyond corporate balance sheets. Chinese carriers operating newer, more fuel-efficient 737 Max jets would dramatically expand route networks — both domestically and internationally. The 737 Max 10, capable of flying roughly 3,300 nautical miles at maximum range, opens trans-regional routes that older Chinese narrowbody fleets cannot economically serve.
For the global travel industry — and for the Expedia-era traveler booking multi-stop itineraries across Asia — this translates into more competitive airfares, denser flight schedules out of Chinese hub airports, and expanded connectivity between Chinese secondary cities and international destinations. Tourism economists estimate that each percentage point increase in seat capacity on a major international corridor correlates with a 0.6 to 0.8 percent increase in inbound tourist arrivals. A Chinese aviation expansion of this magnitude, fuelled by 500 new-generation jets, would register meaningfully in global travel demand forecasts through the late 2020s.
The geopolitical calculus cuts the other way too. Should talks collapse — perhaps due to escalation over Taiwan, renewed rare-earth export controls, or a postponement of the Trump visit, which Bloomberg noted could occur if the ongoing US-Iran situation deteriorates — Boeing’s China exposure remains an open wound rather than a healed scar.
Historical Context: The Ghosts of Boeing-China Deals Past
This would not be the first time a US presidential visit to China generated a headline Boeing order. In 2015, during Barack Obama’s final engagement with Xi Jinping, Chinese carriers placed orders for over 300 Boeing jets — a deal that at the time was celebrated as a pillar of the bilateral commercial relationship. It took less than four years for that relationship to unravel under the dual pressures of the MAX crisis and Trump’s first-term tariffs.
The lesson is not that such deals are illusory. It is that they are fragile by design — deeply dependent on the political weather. A Boeing 500-plane order tied to Trump’s Beijing summit is, in that sense, simultaneously a genuine commercial transaction and a diplomatic performance. Its durability will depend less on what is signed in Beijing in April than on what is negotiated, month by month, in the trade relationship that follows.
Forward Outlook: Promise, Risk, and the Long Game
Boeing’s aircraft stand to feature prominently in whatever trade framework emerges from the Trump-Xi summit. But seasoned observers of US-China commercial aviation will note that a similar mega-deal euphoria surrounded Airbus last year — and ultimately failed to materialize. Given the fraught geopolitical backdrop, Boeing’s order bonanza is not assured, and two people familiar with the talks have specifically cautioned that deal completion remains uncertain. Yahoo Finance
What is certain is this: the structural demand is real, the production capacity is finally in place, and the political incentive on both sides has rarely been stronger. For Boeing, recapturing even a fraction of what was once a market that constituted a quarter of its order book would represent a transformation of its strategic position. For China’s airlines, new Boeing jets mean competitive fleets, lower operating costs, and the capacity to serve a travelling public that has never stopped wanting to fly.
The planes, as ever, are ready. The question is whether the politics will let them take off.
Discover more from The Economy
Subscribe to get the latest posts sent to your email.
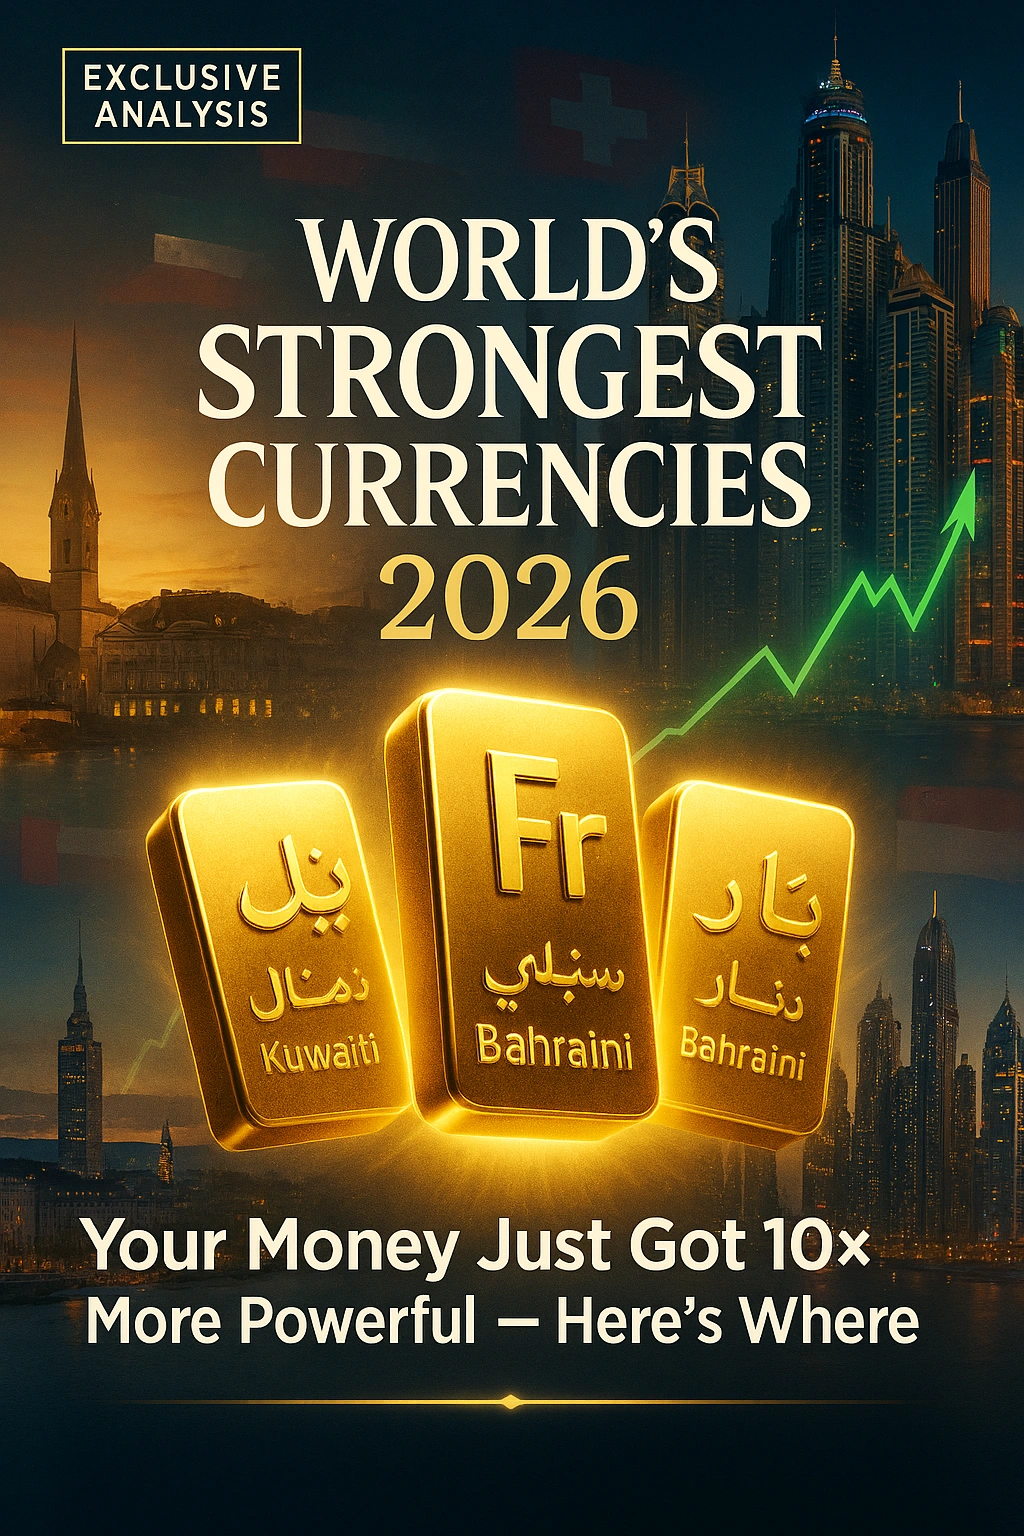
Discover the world’s strongest currencies in 2026 — ranked by exchange value, economic backing & purchasing power. From Kuwait’s $3.27 dinar to the Swiss franc’s unmatched stability, the definitive guide.
Where Money Is Worth More Than You Think
There is a question that unsettles most travellers the moment they land at an unfamiliar airport and squint at a currency board: how much, exactly, is this money worth? The instinct is to reach for the US dollar as a yardstick — to ask, almost reflexively, whether the local note in your hand represents more or less than a single greenback. That reflex is understandable. The dollar remains, by a vast margin, the most traded and most held reserve currency on the planet. But it is not the strongest.
That distinction belongs to a small Gulf emirate whose population would fit comfortably inside greater Manchester, and whose currency has quietly dominated every global ranking for more than two decades. It is joined on the podium by neighbours whose names rarely make mainstream financial headlines, and by a landlocked Alpine republic whose monetary tradition has become almost mythological in global finance circles.
Currency strength is, of course, a deceptively complicated concept. A high nominal exchange rate — the number of US dollars one unit of a foreign currency can buy — is the most intuitive measure, but it captures only part of the picture. Purchasing power parity (PPP), the stability of the issuing central bank, inflation history, current-account balances, and forex reserve depth all feed into a fuller assessment of monetary credibility. The rankings below attempt to honour that complexity: they are ordered primarily by nominal value against the USD as of early March 2026, but enriched with structural and macroeconomic context at every step.
For travellers, the implications are vivid and practical: a strong home currency means your holiday budget stretches further in weaker-currency markets. For investors, it signals where monetary policy is disciplined, inflation is tamed, and capital preservation is most plausible. For economists, it is a mirror of a nation’s fiscal choices — and occasionally its geological luck.
Here, then, is the definitive ranking of the world’s strongest currencies in 2026.

Methodology: How We Ranked the World’s Strongest Currencies
Ranking currencies by strength is not a single-variable exercise. Our methodology combines four weighted criteria:
1. Nominal exchange rate vs. USD (primary weight: 50%) — the most cited metric globally; how many US dollars one unit of the currency buys as of early March 2026.
2. Purchasing Power Parity (PPP) and domestic price stability (25%) — drawing on the IMF World Economic Outlook database and World Bank ICP data to assess what each currency actually buys at home.
3. Central bank credibility, forex reserves, and current-account balance (15%) — using BIS data, central bank publications, and IMF Article IV consultations.
4. Long-term inflation track record and monetary regime stability (10%) — a currency pegged rigidly to the dollar for decades earns credit for predictability; a currency that preserved purchasing power across multiple global crises earns even more.
Geographic territories whose currencies are pegged 1:1 to a sovereign currency (Gibraltar Pound, Falkland Islands Pound) are noted but not separately ranked; they effectively mirror their parent currency’s fundamentals.
The World’s Strongest Currencies in 2026: Comparative Table
| Rank | Country / Territory | Currency | Code | Value vs. USD (Mar 2026) | 1-Year Change | Exchange Regime |
|---|---|---|---|---|---|---|
| 1 | Kuwait | Kuwaiti Dinar | KWD | ≈ $3.27 | Stable (±0.5%) | Managed basket peg |
| 2 | Bahrain | Bahraini Dinar | BHD | ≈ $2.66 | Stable (fixed) | Hard USD peg |
| 3 | Oman | Omani Rial | OMR | ≈ $2.60 | Stable (fixed) | Hard USD peg |
| 4 | Jordan | Jordanian Dinar | JOD | ≈ $1.41 | Stable (fixed) | Hard USD peg |
| 5 | United Kingdom | Pound Sterling | GBP | ≈ $1.26 | −1.8% | Free float |
| 6 | Cayman Islands | Cayman Dollar | KYD | ≈ $1.20 | Stable (fixed) | Hard USD peg |
| 7 | Switzerland | Swiss Franc | CHF | ≈ $1.13 | +2.1% | Managed float |
| 8 | European Union | Euro | EUR | ≈ $1.05 | −1.2% | Free float |
| 9 | Singapore | Singapore Dollar | SGD | ≈ $0.75 | +1.4% | NEER-managed |
| 10 | United States | US Dollar | USD | $1.00 | Benchmark | Free float |
Exchange rates are indicative mid-market values, early March 2026. Sources: Central Bank of Kuwait, Central Bank of Bahrain, Central Bank of Oman, Bloomberg, Reuters.
#10 — United States: The Dollar That Rules the World (Even When It Isn’t the Strongest)
USD/USD: 1.00 | Reserve share: ~56% of global FX reserves (IMF COFER, mid-2025)
It would be intellectually dishonest to construct any list of monetarily significant currencies without beginning — or in this case, ending — with the US dollar. Technically ranked tenth by nominal exchange rate, the dollar’s omission from any strong-currency discussion would be absurd. It is the global reserve currency, the denomination of roughly 90% of all international foreign-exchange transactions, and the standard against which every other currency on this list is measured.
The dollar’s structural power derives not from its face value but from the depth and liquidity of US capital markets, the legal enforceability of US-dollar-denominated contracts, and the unrivalled network effects that come from decades of institutional entrenchment. When the world is frightened — by a banking crisis, a pandemic, or a geopolitical rupture — capital flows into dollars, not away from them. That is the ultimate credential.
The Federal Reserve’s aggressive rate-hiking cycle of 2022–2023 temporarily turbocharged the greenback to multi-decade highs. Since then, a gradual easing cycle has modestly softened the dollar index (DXY), which hovered around the mid-100s range in early 2026. Yet its dominance in global trade invoicing and central bank reserves remains essentially unchallenged.
Travel angle: For American travellers abroad, the dollar’s reserve status means widespread acceptance and generally favourable conversion, particularly in emerging markets. The caveat: in the Gulf states above the dollar on this list, the local currencies are pegged to the dollar, so there is no exchange-rate advantage — the mathematics are already baked in.
#9 — Singapore: The Asian Precision Instrument
SGD/USD: ≈ 0.75 | Inflation: ~2.1% (MAS, 2025) | Current account: strong surplus
Singapore manages its currency with the kind of institutional exactitude one might expect from a city-state that has spent sixty years treating good governance as a competitive export. The Monetary Authority of Singapore (MAS) does not set interest rates in the conventional sense; it manages the Singapore dollar’s value against an undisclosed basket of currencies through a “nominal effective exchange rate” (NEER) policy band — a mechanism that gives it enormous flexibility to use currency appreciation as an anti-inflation tool.
The result is a currency that, while not high in nominal USD terms, has consistently outperformed peers in Asia on purchasing-power stability. Singapore’s AAA sovereign credit rating (Standard & Poor’s, Fitch), perennially current-account surplus, and status as Asia’s pre-eminent financial hub all feed into the SGD’s credibility premium. The SGD appreciated modestly against the dollar in 2025 as MAS maintained a slightly appreciating NEER slope — a deliberate policy response to residual imported inflation from elevated global commodity prices.
For investors, the Singapore dollar is one of very few Asian currencies worth holding as a diversification tool in a hard-currency portfolio. For travellers from weaker-currency nations, Singapore’s cost of living will feel punishing — this is, after all, consistently one of the world’s most expensive cities. But that high cost is the precise reflection of the currency’s strength.
#8 — The Euro: Collective Strength, Individual Tensions
EUR/USD: ≈ 1.05 | ECB deposit rate: 2.25% (as of Feb 2026) | Eurozone GDP growth: ~0.9% (IMF 2026 forecast)
The euro is the world’s second most traded currency and the reserve currency of choice after the dollar, held in roughly 20% of global central bank foreign exchange portfolios. It represents the collective monetary credibility of twenty nations — a fact that is simultaneously its greatest source of strength and its most persistent structural vulnerability.
The European Central Bank’s prolonged rate-hiking campaign of 2022–2024 was executed with more determination than many in financial markets expected, and it produced results: eurozone core inflation fell from its 2022 peak of above 5% to below 2% by mid-2025, a trajectory that restored considerable credibility to the ECB’s inflation-targeting framework. The subsequent easing cycle has been cautious; the deposit rate stood at approximately 2.25% in early 2026, a level the ECB’s governing council has characterised as still moderately restrictive.
The euro’s Achilles heel remains the fiscal divergence between its member states. Germany’s near-recessionary growth in 2024–2025, combined with France’s persistent budget deficit challenges and Italy’s elevated debt-to-GDP ratio (above 135%), keeps sovereign risk premia alive in bond markets and periodically unsettles the currency. Still, the Eurozone’s aggregate current-account position is in surplus, and the ECB’s “Transmission Protection Instrument” — its bond-buying backstop — has effectively capped the threat of another existential sovereign debt crisis for now.
Travel angle: For USD- or GBP-holders, the euro’s current rate around $1.05 represents a relatively modest barrier. Western European travel remains expensive not because of the exchange rate but because of local price levels — a function of high wages and robust social provision rather than currency manipulation.
#7 — Switzerland: The Safe-Haven That Earned Its Reputation
CHF/USD: ≈ 1.13 | SNB policy rate: 0.25% | Inflation: ~0.3% (SNB, Feb 2026) | Current account surplus: ~9% of GDP
If the Kuwaiti dinar wins on headline exchange rate, the Swiss franc wins on something arguably more impressive: institutional longevity. Switzerland has managed its monetary affairs with such consistent discipline that the franc has preserved real purchasing power across multiple global crises, two world wars (in which Switzerland remained neutral), the collapse of the Bretton Woods system, the 2008 global financial crisis, and the COVID-19 shock. That record of monetary continuity, spanning more than 175 years since the franc’s introduction in 1850, is essentially without parallel among modern fiat currencies.
The Swiss National Bank (SNB) operates with an independence and a long-termism that remains the envy of its peers. Its mandate — price stability, defined as annual CPI inflation of 0–2% — has been met with remarkable consistency. Swiss inflation in early 2026 stood at approximately 0.3%, one of the lowest in the developed world, and a reflection of the SNB’s willingness in previous years to tolerate the economic pain of a strong franc (which reduces import costs and anchors domestic prices) rather than engineer currency weakness for short-term competitiveness.
Switzerland’s current-account surplus, running at roughly 9% of GDP, reflects a country that consistently exports more value than it imports — in pharmaceuticals, precision machinery, financial services, and, of course, the world’s most trusted watches. That structural external surplus is a bedrock of franc credibility.
The SNB’s policy rate stood at 0.25% in early 2026 — low, because very low inflation means there is no need for restrictive policy. The franc’s strength is not conjured by high interest rates attracting hot capital; it is built on structural surpluses, institutional credibility, and a century and a half of monetary conservatism.
Investor angle: The CHF remains one of the most reliable safe-haven plays in global markets. When geopolitical risk flares — and it has consistently done so across 2024–2026 — capital rotates into the franc. Its appreciation during such episodes is the price of insurance.
#6 — Cayman Islands: Offshore Stronghold, Surprising Currency
KYD/USD: 1.20 (fixed since 1974) | Sector: International financial centre
The Cayman Islands may be small — approximately 65,000 residents across three Caribbean islands — but their currency punches well above its geographic weight. The Cayman Islands dollar has been pegged to the US dollar at a fixed rate of 1.20 since 1974, a peg that has held without interruption for over five decades.
The peg is sustainable because the Cayman Islands economy generates exceptional foreign currency inflows. As one of the world’s leading offshore financial centres, the Cayman Islands hosts thousands of hedge funds, private equity vehicles, structured finance vehicles, and the regional offices of major global banks. This financial infrastructure creates persistent capital inflows that underpin the peg’s credibility without recourse to the kind of oil revenues that sustain Gulf currencies.
The absence of direct taxation — no corporate tax, no income tax, no capital gains tax — also functions as a structural attractor for international capital, further reinforcing demand for the local currency.
For travellers, the Cayman Islands’ combination of strong currency and luxury resort economy makes it one of the Caribbean’s more expensive destinations. But that premium reflects something real: it is, genuinely, one of the most politically stable and financially sophisticated jurisdictions in the Western Hemisphere.
#5 — United Kingdom: History’s Most Enduring Major Currency
GBP/USD: ≈ 1.26 | Bank of England base rate: 4.25% (Feb 2026) | UK GDP growth forecast: 1.3% (IMF 2026)
The pound sterling has a plausible claim to being the world’s oldest currency still in active use. Predating the United States by more than a millennium in its earliest forms, sterling carries the weight of institutional memory — and the scars of historical crises, from the 1976 IMF bailout to Black Wednesday in 1992 to the post-Brexit adjustment of 2016. That the pound has navigated all of this and still trades above $1.25 says something significant about the resilience of UK monetary institutions.
The Bank of England, established in 1694, has been on a cautious easing path since mid-2024, reducing its base rate from the post-pandemic peak of 5.25% to 4.25% by early 2026 as UK inflation — which ran brutally hot in 2022–2023 — returned closer to the 2% target. Core CPI had moderated to approximately 2.7% by early 2026, still slightly elevated but no longer the acute political crisis it was.
The UK’s economic structure — highly service-oriented, with the City of London representing one of the world’s two or three most important financial centres — means sterling’s value has always been intimately connected to confidence in UK financial governance. Post-Brexit trade frictions have not destroyed that confidence, though they have permanently restructured some trade flows and depressed productivity estimates.
Travel angle: Sterling’s strength makes UK residents among the best-positioned travellers in the world, particularly when visiting North Africa, South-East Asia, or Eastern Europe, where exchange rate differentials translate into substantial purchasing power advantages. The pound buys significantly more in emerging markets today than it did five years ago.
#4 — Jordan: Strength Without Oil
JOD/USD: 1.41 (fixed peg) | Inflation: ~2.8% | IMF programme: Extended Fund Facility (ongoing)
Jordan’s presence in the top four is the most intellectually interesting entry on this list, because it is a standing refutation of the narrative that strong currencies require oil. Jordan has no significant hydrocarbon reserves. Its economy depends on phosphate exports, manufacturing, services, remittances from a large diaspora, foreign aid — primarily from the United States, Saudi Arabia, and the EU — and its strategic geopolitical position at the intersection of three continents and several of the region’s most complex political dynamics.
The Jordanian dinar has been pegged to the US dollar at a fixed rate of 0.709 JOD per dollar (implying approximately $1.41 per dinar) since 1995, a commitment the Central Bank of Jordan has maintained through multiple regional crises — the 2003 Iraq war, the 2011 Arab Spring, the Syrian refugee crisis (Jordan hosts one of the world’s largest refugee populations relative to its size), and the ongoing regional tensions of 2024–2025.
The peg’s credibility is purchased at a fiscal cost: Jordan must maintain sufficient foreign exchange reserves to defend it, which constrains domestic monetary flexibility and requires disciplined fiscal policy, often in collaboration with IMF structural adjustment programmes. That discipline — painful as it has periodically been — is precisely what makes the dinar’s high nominal value sustainable.
Investor angle: The JOD peg makes Jordan one of the more predictable currency environments in the Middle East, which partly explains why Amman has attracted meaningful foreign direct investment in logistics, technology, and pharmaceuticals in recent years.
#3 — Oman: The Prudent Gulf State
OMR/USD: 2.60 (fixed peg) | Oil production: ~1 mbpd | Moody’s rating: Ba1
The Omani rial’s fixed exchange rate of 2.6008 USD per rial has been unchanged for decades — a testament to the consistency of Oman’s monetary framework. Like its Gulf neighbours, Oman’s currency strength is anchored in hydrocarbon wealth, but the sultanate has pursued a more earnest diversification agenda than some of its neighbours, with meaningful investment in tourism, logistics, fisheries, and renewable energy under its Vision 2040 framework.
Oman’s fiscal position has improved markedly since the turbulence of the low-oil-price years of 2015–2016, when the country ran significant budget deficits and accumulated external debt. Higher oil prices in the early 2020s rebuilt fiscal buffers, and the government has since pursued subsidy reform and revenue diversification with greater determination than before. Moody’s upgraded Oman’s sovereign credit in 2023, reflecting improving balance-of-payment dynamics.
The Central Bank of Oman manages the currency through a currency board-style arrangement, holding sufficient USD reserves to back every rial in circulation at the fixed rate. This mechanistic commitment is what gives the OMR its enviable nominal stability — and what keeps it permanently ranked as the world’s third most valuable currency by exchange rate.
Travel angle: Oman’s strong currency, combined with its emergence as a luxury-eco-tourism destination, means it is not an especially cheap place to visit. But for holders of stronger currencies like the pound or the Swiss franc, the arithmetic is favourable — and Oman’s landscapes, from the Musandam fjords to the Wahiba Sands, make the cost worthwhile.
#2 — Bahrain: The Gulf’s Financial Hub
BHD/USD: 2.659 (fixed peg since 1980) | Financial sector: ~17% of GDP | Moody’s: B2
Bahrain’s dinar has been fixed to the US dollar at 0.376 BHD per dollar — implying approximately $2.66 per dinar — since 2001, maintaining an unchanged peg for a quarter century. That consistency, in a region not historically associated with monetary conservatism, is itself a form of credibility.
Bahrain’s economy is more diversified than Kuwait’s: the financial services sector contributes roughly 17% of GDP, making Manama one of the Gulf’s two dominant financial centres alongside Dubai. The country also has a more developed manufacturing base, including aluminium smelting, and has positioned itself as a regional hub for Islamic finance. This economic diversification is strategically significant because Bahrain has proportionally lower oil reserves than Kuwait or Saudi Arabia — the financial sector was, to some extent, a deliberate hedge against that exposure.
The BHD’s nominal strength is reinforced by Saudi Arabia’s implicit backstop role: the two countries share a causeway, a deep economic relationship, and a security alliance. Saudi Arabia’s vast financial resources have historically been seen as an informal guarantor of Bahraini monetary stability — a factor markets price into the risk premium attached to the dinar’s peg.
Investment angle: Bahrain’s status as a relatively open economy with few capital controls makes the BHD more accessible to international investors than most Gulf currencies. Its fintech regulatory sandbox and digital banking framework have drawn growing interest from global financial institutions in 2024–2025.
#1 — Kuwait: The Uncontested Crown
KWD/USD: ≈ 3.27 | Oil reserves: world’s 6th largest | Inflation: ~2.1% | FX reserves: > $45bn (CBK)
The Kuwaiti dinar is, by the most direct measure available — how many US dollars it takes to buy one unit — the strongest currency in the world. One dinar buys approximately $3.27 at current exchange rates, a premium that has been maintained, with only modest fluctuation, for decades.
Kuwait’s monetary position begins with geology. The country sits atop the world’s sixth-largest proven oil reserves, estimated at approximately 101 billion barrels — a figure that, relative to the country’s population of around 4.3 million citizens (and a total population of roughly 4.7 million including expatriates), represents extraordinary per-capita resource wealth. Oil and petroleum products account for more than 85% of government revenue and over 90% of export earnings. When oil prices are elevated — as they broadly have been across 2022–2025 — the fiscal arithmetic is essentially self-reinforcing.
The Central Bank of Kuwait manages the dinar through a managed peg to an undisclosed basket of international currencies, with the US dollar believed to constitute the largest single weight, given Kuwait’s oil revenues are denominated in dollars. This basket arrangement gives the CBK marginally more flexibility than a simple USD peg — it insulates the dinar slightly from bilateral dollar volatility.
Kuwait’s sovereign wealth fund, the Kuwait Investment Authority (KIA), is among the oldest and largest in the world, with assets variously estimated at over $900 billion. This vast stock of externally held financial wealth provides an additional buffer for the currency — in extremis, the KIA’s assets could theoretically be liquidated to defend the dinar. In practice, they have never needed to be. The combination of ongoing oil revenues, low domestic inflation (circa 2.1%), and conservative fiscal management has kept the dinar stable in nominal terms for as long as most investors can remember.
It is worth acknowledging the critique: Kuwait’s currency strength reflects resource rents and fiscal subsidies rather than diversified economic productivity. The dinar has not been “stress-tested” in the way the Swiss franc has, across multiple non-commodity-linked monetary regimes. A world permanently transitioning away from fossil fuels would eventually restructure the fiscal basis of KWD strength. But “eventually” is doing considerable work in that sentence. In March 2026, with global oil demand still running at near-record levels and the energy transition proceeding more slowly than many modelled, the Kuwaiti dinar remains — unchallenged — the most valuable currency on the planet by exchange rate.
Travel angle: For visitors holding stronger currencies (GBP, CHF, EUR), Kuwait is a genuinely affordable destination for what it offers — a sophisticated urban environment, world-class dining, and proximity to the rest of the Gulf. For those arriving with weaker currencies, the dinar’s strength can feel formidable at the exchange counter.
The Big Picture: What Strong Currencies Mean for Travel and Investment in 2026
The Travel Equation
Currency strength creates a purchasing-power asymmetry that sophisticated travellers have long exploited. Holding a strong currency — Kuwaiti dinar, British pound, Swiss franc, or euro — means that destinations with weaker currencies effectively go “on sale” from the holder’s perspective.
In 2026, the most compelling value gaps are between strong-currency nations and emerging markets where inflation has eroded local purchasing power without triggering proportionate currency depreciation. South-East Asia (Thailand, Vietnam, Indonesia), parts of Central and Eastern Europe, and much of Sub-Saharan Africa offer exceptional experiential value for travellers from the currencies on this list.
For travellers from weaker-currency nations visiting strong-currency countries — the United Kingdom, Switzerland, or the Gulf states — the inverse applies. The exchange rate headwind is real and material. Budget accordingly.
The Investment Case
Strong currencies are not automatically superior investment vehicles. A currency that is strong because it is pegged to the dollar (BHD, OMR, JOD, KYD) offers exchange-rate stability but does not offer upside appreciation. The Swiss franc and Singapore dollar — both managed floats — have historically appreciated in real terms over time, making them genuine long-term stores of value.
The broader investment signal from strong-currency nations is less about the currency itself and more about the policy environment it implies: low inflation, institutional independence, disciplined fiscal management, and rule of law. These are also the conditions most conducive to long-term capital preservation and, frequently, to strong equity market performance.
The Geopolitical Dimension
Several currencies on this list are exposed to geopolitical tail risks that their stable exchange rates do not fully price. Gulf currencies depend on continued hydrocarbon demand and regional stability. The pound is permanently sensitive to UK fiscal credibility and any resurgence of concerns about debt sustainability. The euro faces structural tensions that have been managed but not resolved.
The Swiss franc and Singapore dollar stand apart: their strength is built on institutional foundations that are largely independent of any single commodity price, political decision, or regional dynamic. In a world of elevated geopolitical uncertainty, that institutional bedrock commands a premium that is likely to persist.
Conclusion: Currency Strength as a Mirror of National Character
The currencies at the top of this ranking are not accidents. The Kuwaiti dinar is strong because Kuwait made conservative choices about how to manage extraordinary resource wealth — choices that not every resource-rich nation has made. The Swiss franc is strong because Switzerland has maintained institutional discipline across a century and three-quarters of monetary history. The pound retains its position because British financial markets have earned global trust over decades, even while political decisions have periodically tested it.
For travellers, the lesson is straightforward: when your home currency is strong, the world effectively gives you a discount on its experiences. For investors, the lesson is more nuanced: strength by nominal exchange rate and strength by structural monetary credibility are not the same thing — and in the long run, the latter matters more.
In 2026, the world’s currency hierarchy reflects, as it always has, the aggregate of every monetary policy decision, every fiscal choice, and every institutional investment that preceded it. The dinar, the franc, the pound, the rial — each is a ledger of its nation’s choices, settled daily on the world’s foreign exchange markets.
Frequently Asked Questions (FAQ Schema)
Q1: What is the strongest currency in the world in 2026?
The Kuwaiti Dinar (KWD) is the strongest currency in the world in 2026 by nominal exchange rate, trading at approximately $3.27 per dinar as of early March 2026. Its strength is underpinned by Kuwait’s vast oil reserves, conservative central bank management, and a managed basket peg that maintains extraordinary stability.
Q2: Which country has the strongest currency for travel in 2026?
For travellers, holding UK Pounds Sterling (GBP), Swiss Francs (CHF), or Euros (EUR) provides the most practical travel purchasing power advantage globally, as these currencies are widely accepted worldwide and deliver significant exchange-rate advantages in emerging markets across Asia, Africa, and Eastern Europe.
Q3: Why is the Kuwaiti Dinar so strong?
The Kuwaiti Dinar’s strength derives from Kuwait’s position as one of the world’s largest per-capita oil exporters, responsible fiscal management by the Central Bank of Kuwait, a managed currency peg to a basket of international currencies, low domestic inflation, and the backing of the Kuwait Investment Authority — one of the world’s largest sovereign wealth funds, with assets estimated at over $900 billion.
Q4: Is a strong currency good for a country’s economy?
A strong currency has both benefits and costs. Benefits include lower import costs (reducing inflation), greater purchasing power for citizens abroad, and stronger investor confidence. Costs include reduced export competitiveness, as locally produced goods become more expensive for foreign buyers, and potential pressure on manufacturing sectors. Countries like Switzerland and Singapore manage this tension deliberately through monetary policy.
Q5: What are the best currencies to hold as an investment in 2026?
For capital preservation, the Swiss Franc (CHF) and Singapore Dollar (SGD) have the strongest track records of long-term purchasing-power preservation among free-floating or managed-float currencies. For nominal stability, USD-pegged Gulf currencies (KWD, BHD, OMR) offer predictable exchange rates but limited upside appreciation. The US Dollar retains unparalleled liquidity and reserve-currency status. Diversification across multiple hard currencies remains the consensus recommendation from institutional investors.
Sources : Data sourced from Central Bank of Kuwait, Central Bank of Bahrain, Central Bank of Oman, Monetary Authority of Singapore, Swiss National Bank, Bank of England, European Central Bank, IMF World Economic Outlook (Oct 2025 / Jan 2026 update), World Bank International Comparison Programme, BIS Triennial Survey, Bloomberg FX data, and Reuters market data. Exchange rates are indicative mid-market values as of early March 2026 and are subject to market fluctuation.
Discover more from The Economy
Subscribe to get the latest posts sent to your email.
-

 Markets & Finance4 months ago
Top 15 Stocks for Investment in 2026 in PSX: Your Complete Guide to Pakistan’s Best Investment Opportunities
-

 Analysis3 months ago
Brazil’s Rare Earth Race: US, EU, and China Compete for Critical Minerals as Tensions Rise
-

 Analysis2 months ago
Top 10 Stocks for Investment in PSX for Quick Returns in 2026
-

 Investment3 months ago
Top 10 Mutual Fund Managers in Pakistan for Investment in 2026: A Comprehensive Guide for Optimal Returns
-

 Banks3 months ago
Best Investments in Pakistan 2026: Top 10 Low-Price Shares and Long-Term Picks for the PSX
-

 Global Economy4 months ago
Pakistan’s Export Goldmine: 10 Game-Changing Markets Where Pakistani Businesses Are Winning Big in 2025
-

 Global Economy4 months ago
15 Most Lucrative Sectors for Investment in Pakistan: A 2025 Data-Driven Analysis
-

 Asia4 months ago
China’s 50% Domestic Equipment Rule: The Semiconductor Mandate Reshaping Global Tech