
Business
Top 4 World’s CEOs Making a Mark in Business in 2026

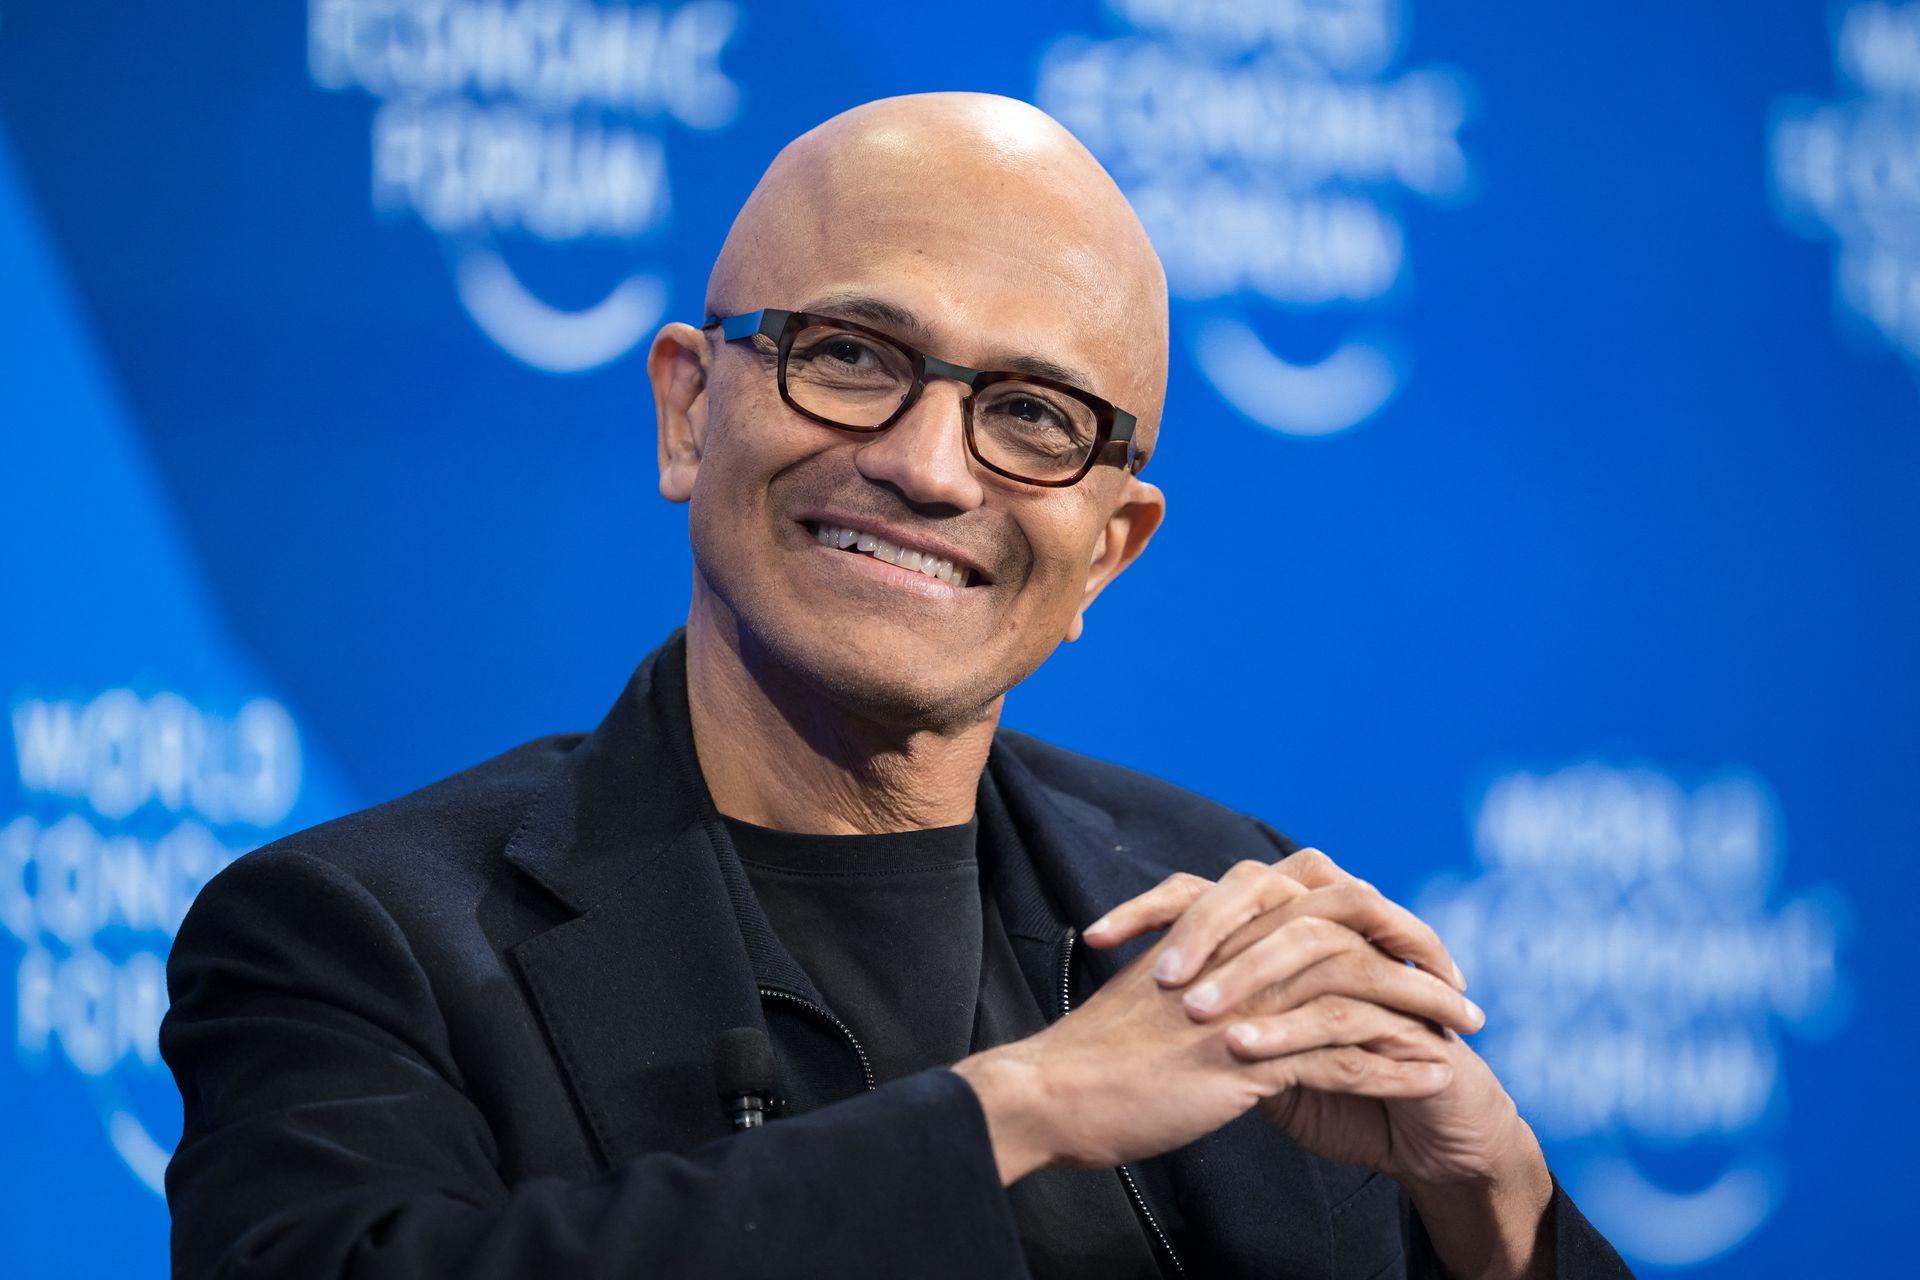
Discover the top business leaders 2026 is defined by — and how their strategies are reshaping the global economy, AI infrastructure, and the future of innovation.
Introduction: The Leaders Who Are Rewriting the Rules
There’s a moment every generation produces — a handful of figures who don’t merely respond to a changing world, but architect it. In 2026, we are living inside one of those moments. Artificial intelligence has ceased to be a product category and become the operating system for civilization itself. Geopolitical fractures are redrawing supply chains. Capital expenditure figures from the tech industry are now measured in the hundreds of billions — rivaling the GDP of nations. And through it all, four CEOs have emerged not just as survivors of this turbulence, but as its engineers.
Among the most influential CEOs of 2026, Satya Nadella of Microsoft, Jensen Huang of NVIDIA, Lisa Su of AMD, and Tim Cook of Apple are the names that analysts, economists, and competitors watch most closely. Together, they command companies worth a combined market capitalization exceeding $14 trillion. They compete fiercely, collaborate opportunistically, and share one unifying obsession: the race to define what AI-powered enterprise looks like at planetary scale.
“These are not four rivals — they are four essential links in the chain that is remaking global business.”
This is not a celebration of wealth. It is an examination of strategy, vision, and the kind of leadership that moves markets — and societies — forward. These top business leaders of 2026 are making decisions today that will ripple through economies for decades.
Satya Nadella, Microsoft: The Architect of the AI Enterprise
From Cloud Pioneer to AI Factory Builder

When Satya Nadella took over as Microsoft’s CEO in 2014, the company’s stock was trading in the mid-$30s. On February 25, 2026, it hovers near $478 — still digesting a correction from its all-time high, yet representing one of the most remarkable corporate transformations in business history. Nadella’s own phrase — “thinking in decades, executing in quarters” — is perhaps the most accurate summary of his tenure.
Born in Hyderabad, India, and trained as an electrical engineer before earning an MBA from the University of Chicago, Nadella rebuilt Microsoft’s culture around what he calls a “growth mindset” — borrowed deliberately from psychologist Carol Dweck. The shift from a “know-it-all” to a “learn-it-all” culture unlocked innovations that made Microsoft the indispensable infrastructure provider for the AI era.
2026 Innovations and Financial Performance
The numbers are staggering. In its fiscal Q2 2026 earnings, Microsoft reported $81.3 billion in quarterly revenue — an increase of 17% year-over-year. Net income surged 60% on a GAAP basis to $38.5 billion. Microsoft Cloud revenue crossed $50 billion for the first time in a single quarter (Source: Microsoft Investor Relations, January 2026).
GitHub Copilot, Microsoft’s coding AI, now counts 4.7 million paid subscribers — up 75% year-over-year — while Dragon Copilot, its healthcare AI agent, serves 100,000 medical providers and documented 21 million patient encounters in a single quarter. To fuel this, Microsoft spent $37.5 billion in capital expenditures in just one quarter, with roughly two-thirds allocated to GPUs and CPUs.
Nadella on the AI opportunity: “We are only at the beginning phases of AI diffusion and already Microsoft has built an AI business that is larger than some of our biggest franchises. We are pushing the frontier across our entire AI stack to drive new value for our customers and partners.”
Challenges and the Road Ahead
Microsoft’s stock has underperformed the broader tech sector, falling roughly 14% from its all-time high as investors question whether AI investment will translate into proportional returns. As sovereign nations demand localized AI infrastructure and enterprise buyers grow more selective, Nadella’s ability to balance global ambition with local relevance will define Microsoft’s next chapter. Through Microsoft Foundry, the company is already enabling enterprises in 190 countries to customize and fine-tune AI models for sovereign requirements — a strategic differentiator that few competitors can match.
Jensen Huang, NVIDIA: The Man Who Built the Engine of the AI Age
A Denny’s Napkin to a $5 Trillion Company

The mythology around Jensen Huang begins at a Denny’s restaurant in Silicon Valley in 1993, where he co-founded NVIDIA with two friends over pancakes and coffee. Three decades later, NVIDIA became the first company in history to surpass a $5 trillion market capitalization — a milestone reached in October 2025. As of January 2026, Huang’s net worth is estimated at $164.1 billion, making him the eighth-wealthiest person on earth (Source: Forbes, January 2026).
Huang received the 2026 IEEE Medal of Honor — the highest honor bestowed by the Institute of Electrical and Electronics Engineers — in January 2026. It is a fitting capstone for an engineer-CEO who has spent thirty years making GPUs into the most valuable industrial commodity of the information age.
2026: $500 Billion in Visibility and the Rubin Era
At CES 2026 in Las Vegas, Huang confirmed that NVIDIA’s next-generation AI chip, Rubin, is in full production, with systems expected to begin shipping in the second half of 2026. The GPU is designed to deliver five times the performance for AI inference compared to the previous Blackwell architecture, and is projected to slash the cost of generating AI tokens to one-tenth the previous cost.
NVIDIA’s Q3 fiscal 2026 revenue reached $57 billion, up 62% year-over-year, with data center revenue of $51.2 billion — up 66%. Analysts project NVIDIA’s full-year fiscal 2026 revenue at approximately $213 billion. At his GTC developer conference, Huang disclosed that the company has secured more than $500 billion in chip orders through the end of 2026 — a level of revenue visibility he described as unprecedented in technology history.
“I think we are probably the first technology company in history to have visibility into half a trillion dollars [in revenue].” — Jensen Huang, NVIDIA CEO
Challenges: China, Competition, and the ASIC Question
NVIDIA’s most pressing geopolitical challenge is China, where U.S. export controls have reduced its market share from 95% to effectively zero. The financial cost runs into billions. Domestically, the existential question was whether hyperscalers would abandon NVIDIA GPUs for custom ASICs. When Meta committed billions to NVIDIA GPUs — despite developing its own MTIA chips — as part of its $115–135 billion 2026 AI capex plan, it sent a signal that NVIDIA’s rivals could not ignore.
Lisa Su, AMD: The Underdog CEO Redefining Semiconductor Competition
From Near-Irrelevance to AI Powerhouse

When Lisa Su became AMD’s CEO in 2014, the company was burning cash and widely considered an also-ran. Today, AMD commands a market capitalization in the hundreds of billions, and Su is cited as one of the most technically gifted CEOs in the semiconductor industry. An MIT-trained electrical engineer, Su brings the rigor of a research scientist to global leadership.
At CES 2026 in Las Vegas, Su declared the dawn of the “Yottascale era” — a period in which AI systems will require computational power measured in yottaflops (10²⁴ floating-point operations per second). She unveiled the “Gorgon Point” platform — a modular data center design integrating AMD’s Ryzen AI chips with high-bandwidth memory, enabling seamless scaling without proportional energy increases.
2026: MI455, OpenAI Partnerships, and a 35% Growth Runway
AMD’s Q4 2025 earnings reported revenue of $10.27 billion — above Wall Street expectations of $9.67 billion. Su’s analyst day projections outlined 35% annual revenue growth over the next three to five years, with data center AI chip revenue growing at 50% CAGR. The total AI data center market, Su projects, will reach $1 trillion annually by 2030.
A landmark partnership with OpenAI — announced in late 2025 — cemented AMD’s place in the AI chip conversation. Under the deal, AMD will sell OpenAI billions of dollars in Instinct AI chips over multiple years, starting with enough chips in 2026 to use 1 gigawatt of power. Su has also secured long-term deals with Oracle and Meta.
“AI is accelerating at a pace that I would not have imagined.” — Lisa Su, AMD CEO
Challenges: The Nvidia Gap and Export Controls
AMD’s stock dropped 17% after its Q4 2026 earnings — its worst session since 2017 — as analysts felt guidance didn’t reflect the full scale of AI spending. Export restrictions limit AMD’s advanced chip sales to China, with only $100 million in China-related AI chip revenue forecast for Q1 2026. The MI450 chip — AMD’s answer to NVIDIA’s Rubin series — is expected to begin contributing revenue in Q3 2026, with Su projecting over 60% annual data center growth for the next three to five years.
Tim Cook, Apple: The Supply Chain Maestro Navigating the AI Pivot
Mastery in Execution, Questions in Vision

There are CEOs who change industries, and then there is Tim Cook — a CEO who has mastered the art of extracting extraordinary value from a product ecosystem built by someone else, while quietly building something entirely new. Since taking over from Steve Jobs in 2011, Cook has grown Apple from a $350 billion company to a $3.8 trillion enterprise. His weapon is not the dramatic product reveal — it is the relentless optimization of every variable from Taiwanese chip foundries to Cupertino retail stores.
2026: Record Revenue, iPhone Supercycle, and the AI Reckoning
Apple’s fiscal Q1 2026 results — covering the holiday quarter ending December 27, 2025 — were historic. Revenue reached $143.8 billion, up 16% year-over-year, with net profit of $42.1 billion. iPhone revenue hit an all-time record of $85.3 billion, nearly 60% of total company revenue. Services revenue crossed $30 billion for the first time, up 14% year-over-year. Apple now counts more than 2.5 billion active devices worldwide (Source: Apple Q1 2026 Earnings, CNBC).
In China, iPhone sales surged 38%, with Cook declaring “the best iPhone quarter in history in Greater China.” Apple spent a record $10.9 billion on R&D in the quarter — its largest-ever quarterly R&D investment — signaling an internal urgency to close the AI gap with rivals. The company also inked a deal with Alphabet to use Google Gemini to power elements of its Apple Intelligence platform.
“The majority of users on enabled iPhones are actively leveraging the power of Apple Intelligence.” — Tim Cook, Apple CEO
Challenges: The Vision Problem and Siri 2.0
Apple’s challenge in 2026 is the gap between its hardware excellence and its AI ambitions. While Microsoft spends $37.5 billion per quarter on AI infrastructure, Apple’s capital expenditures for the same period were $2.37 billion — reflecting a fundamentally different strategy: privacy-first, on-device AI deployed across 2.5 billion devices. Whether Siri 2.0 — built in partnership with Google and powered by Apple’s own foundation models — arrives with enough capability to reignite the AI conversation will determine whether Cook’s bet pays off.
Comparative Analysis: What These Four Leaders Tell Us About Business in 2026
The Great AI Infrastructure Divide
One of the defining emerging CEO trends of 2026 is the bifurcation of AI strategy. Nadella and Huang are building the physical infrastructure of AI at a scale that would have seemed science fiction five years ago. Su is building the components that power that infrastructure. Cook is betting on the device layer — the consumer-facing end of the stack where AI becomes personal.
These four leaders are not four rivals — they are four essential links in a chain that is remaking global business. NVIDIA’s GPUs power Microsoft’s Azure, which trains models that run on AMD chips in enterprise data centers, which ultimately integrate with Apple Intelligence on iPhones carried by billions of people.
The Sustainability Imperative
Each of these leaders is confronting a challenge that will define the next decade of global CEO impact: the environmental cost of AI. Computing at yottascale could consume the power output of small nations. Microsoft’s Nadella has committed to sourcing 34 gigawatts of renewable energy and contracting nearly 20 million metric tons of carbon removal. Apple’s Cook has committed to carbon neutrality across the entire supply chain by 2030. Jensen Huang, speaking at Davos 2026, acknowledged that energy investment is the prerequisite for Europe to build competitive AI.
Leadership in Uncertainty: The Common Thread
All four share a quality that leadership researchers at the Korn Ferry Institute and The Conference Board consistently identify as central to elite leadership in volatile environments: the ability to hold long-term conviction while executing short-term discipline. Nadella’s decades-long thinking. Huang’s relentless technology roadmapping. Su’s methodical market share accumulation. Cook’s supply chain precision. The top business leaders of 2026 are not great because of one decision — they are great because of thousands of decisions made with incomplete information, under enormous pressure, over long periods of time.
Conclusion: What These Leaders Mean for the Future
The world’s best CEOs in tech in 2026 are not great because of a single decision, a single product, or a single quarter. They are great because of the cumulative weight of conviction over time.
Satya Nadella rebuilt a culture and then rebuilt the company from the inside out. Jensen Huang saw that GPUs would become the most important industrial commodity of the information age — and spent thirty years making sure they would. Lisa Su took a broken company and rebuilt it into a genuine contender through engineering rigor and patient execution. Tim Cook turned operational excellence into a moat so deep that $143.8 billion in a single quarter barely raised an eyebrow.
For aspiring leaders watching these four, the lesson is both humbling and liberating: the most influential CEOs of 2026 didn’t get there by following a framework. They got there by developing a point of view on where the world was going, building teams capable of executing that view, and refusing to let short-term market reactions override long-term conviction.
In a world powered by artificial intelligence, navigated through geopolitical complexity, and increasingly held accountable for its environmental footprint, the leaders who will define the next decade are not the loudest voices in the room. They are the ones who understand — as these four do — that the most powerful thing a CEO can do is create the conditions in which others can do their best work.
The race is on. And the scoreboard is being rewritten every quarter.
SOURCES & CITATIONS
• Microsoft Q2 FY2026 Earnings — Microsoft Investor Relations (microsoft.com)
• NVIDIA Becomes First $5 Trillion Company — Fortune (DA 92)
• Davos 2026: Jensen Huang on the Future of AI — World Economic Forum (DA 91)
• AMD CEO Lisa Su Sees 35% Annual Sales Growth — CNBC (DA 93)
• Apple Q1 2026 Earnings Report — CNBC (DA 93)
• Apple Q1 2026 R&D Spend Reveals AI Ambitions — AppleInsider
• Jensen Huang IEEE Medal of Honor 2026 — Wikipedia / IEEE
Discover more from The Economy
Subscribe to get the latest posts sent to your email.


Banks
Pakistan’s Most Reliable Export Is Its People: Remittances Hit $41.6 Billion, Overtaking Total Exports
Introduction
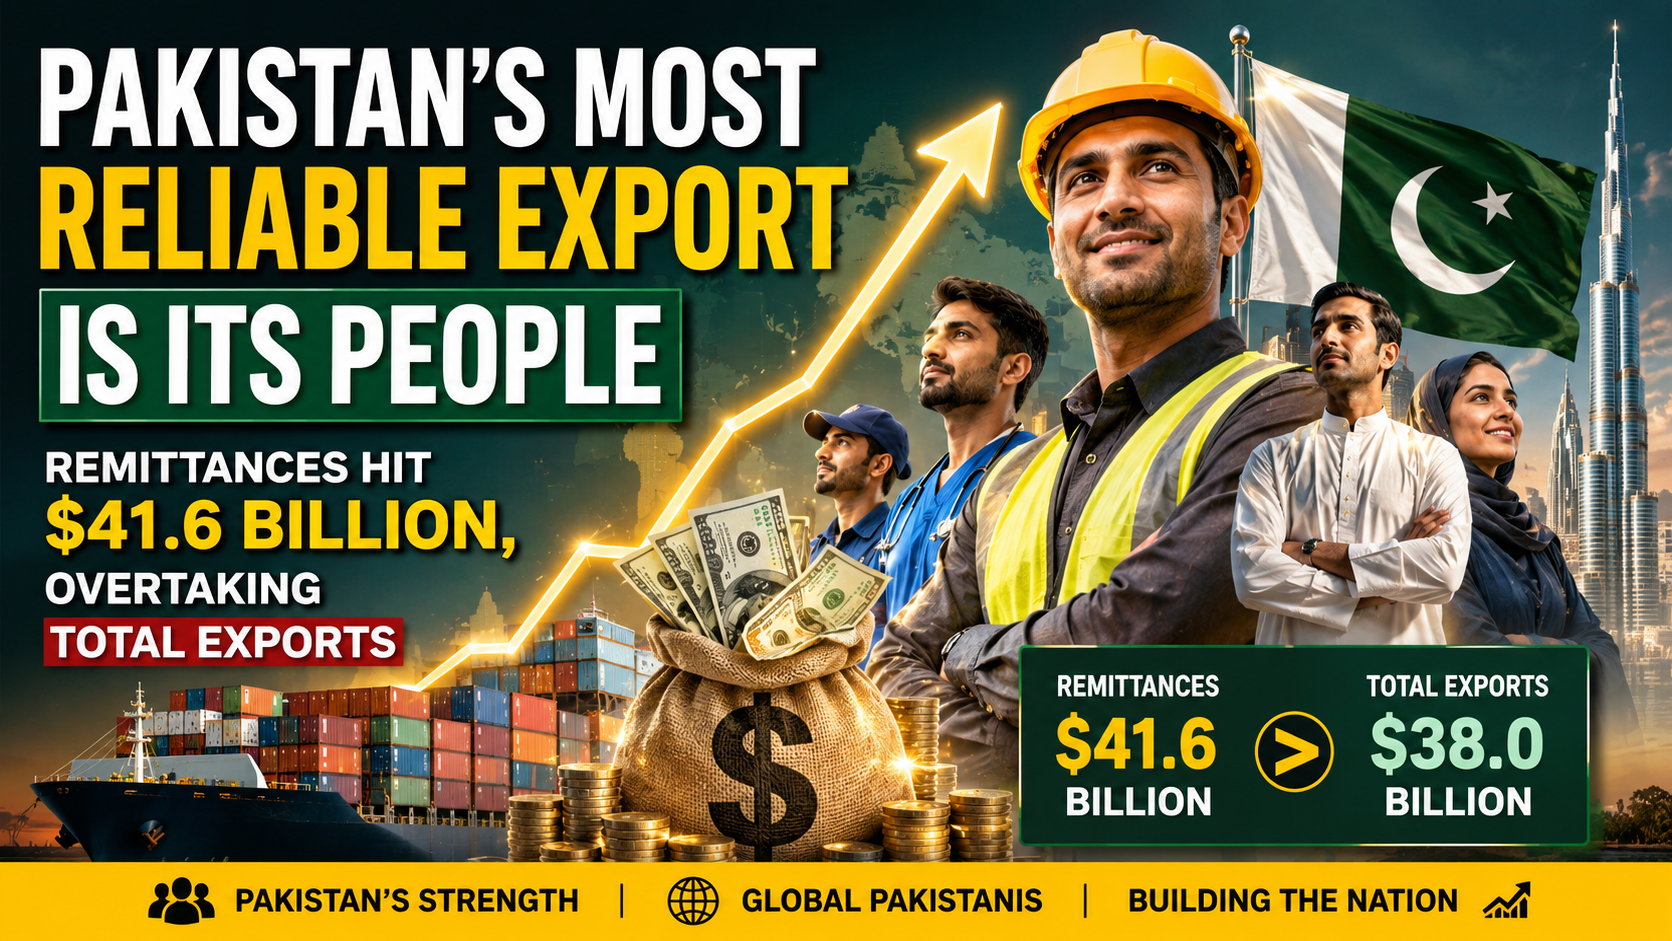
For the first time in the country’s history, money sent home by Pakistan’s overseas workers has exceeded the value of everything Pakistan actually sells abroad. Remittances hit a record $41.6 billion in the fiscal year ending June 30, 2026, according to State Bank of Pakistan data — surpassing total merchandise exports for the same period and cementing a structural shift that economists are increasingly uneasy about (VOI World/State Bank of Pakistan).
The Numbers Behind the Milestone
Remittance inflows rose 8.6% year-on-year in FY26, up from $38.3 billion in FY25 (VOI World). Some reporting puts the full 11-month figure even higher at $38 billion before the final month was tallied, with May 2026 alone contributing $4.25 billion — an amount roughly equal to what the entire country spends on imports in a single month (Express Tribune). A separate Express Tribune report puts the full FY26 total even higher, at $41.58 billion, an increase of nearly $3.29 billion over the prior year, delivered “without structured educational, training or welfare support” for the overseas workforce generating it (Express Tribune — Remittances Without Structured Support).
Saudi Arabia remained the single largest source of remittances in June 2026 at $829.6 million, followed by the UAE ($792.3 million), the United Kingdom ($514.9 million) and the United States ($296.8 million), with Italy and Oman each contributing more than $100 million (VOI World). That geographic concentration matters: a substantial share of Pakistan’s remittance base originates from the Gulf, leaving the country’s external account exposed to labor market reforms, economic cycles and geopolitical developments concentrated in a single, currently volatile region (Business Recorder Editorial).
Exports Have Been Stuck for Years
The remittance surge stands in sharp contrast to Pakistan’s export performance, which has shown little sustained dynamism despite years of concessional financing, preferential tariff regimes and subsidized energy for exporters (Business Recorder Editorial). The textile sector — long considered the backbone of Pakistan’s export economy — has been stuck in a $15–18 billion annual range for years, even as a handful of forward-thinking textile groups have managed to grow exports and diversify product lines under the exact same operating conditions others cite as prohibitive (Express Tribune). Separately reported nine-month data for the fiscal year showed exports contracting 5.8% to $23.3 billion even as imports rose nearly 8% to $46.8 billion, widening the trade gap further (Minute Mirror).
Over the three fiscal years from 2023 to 2025, Pakistan received $95.8 billion in remittances compared with $91 billion in merchandise exports — a gap that reflects, according to Business Recorder analysis, a deliberate policy orientation that has effectively institutionalized remittances as the default tool for stabilizing the current account rather than addressing the underlying export weakness (Business Recorder Opinion).
The Dutch Disease Warning
Independent economists have begun explicitly framing this pattern as a precursor to Dutch disease — the phenomenon where a large, easy source of foreign currency inflow reduces the pressure and incentive to build a competitive tradeable export sector (Business Recorder Opinion). The policy dimension is not incidental: under IMF program conditions, a long-standing subsidy that had encouraged banks to actively mobilize remittance transfers was withdrawn in the 2026 Budget, contributing to a temporary slowdown in inflows during the early months of the fiscal year before the government released Rs30 billion from its contingency fund to help revive momentum (Business Recorder Opinion).
A Business Recorder editorial published in July 2026 was blunt about the implication: Pakistan’s overseas workers have effectively become the country’s “most reliable export,” with its own people functioning as its largest export commodity — a framing the editorial explicitly calls an unsustainable foundation for long-term development strategy (Business Recorder Editorial).
The Silver Linings
The remittance boom has provided genuine macroeconomic stabilization. Total liquid foreign reserves crossed $23.98 billion as of early July 2026, including $18.47 billion held by the State Bank of Pakistan itself, with the rupee holding relatively steady around Rs278 per dollar in the interbank market (Express Tribune — Remittances Without Structured Support). Inflation has also been easing, and large-scale manufacturing showed signs of recovery with 5.9% growth in earlier-reported data, while agricultural lending rose 14.4% during July–February, extending credit access to farmers (Minute Mirror). Separately, Pakistan has reportedly repaid roughly Rs4,722 billion in debt ahead of schedule and posted a historic milestone in IT sector exports, suggesting pockets of genuine structural improvement exist alongside the broader export stagnation (Radio Pakistan).
Why This Matters Beyond Pakistan
Pakistan’s experience is a useful case study for other remittance-dependent emerging economies navigating IMF program conditions. The core tension — using a reliable, low-effort capital inflow to paper over a harder structural problem in the tradeable goods sector — is not unique to Pakistan, but few economies illustrate the scale of the imbalance as starkly as a country where remittances now formally exceed total exports.
Key Takeaways
- Pakistan’s FY26 remittances hit a record $41.6 billion, surpassing total merchandise exports for the first time in the country’s history.
- Saudi Arabia and the UAE remain the largest single sources, concentrating external account risk in the Gulf region.
- Textile exports have been stuck between $15–18 billion annually for years despite sustained government support.
- Economists are increasingly framing the remittance-export imbalance as a Dutch disease risk rather than a stabilization success story.
- Reserves have strengthened to nearly $24 billion and the rupee has stabilized, but the underlying export competitiveness problem remains unresolved.
Sources: VOI World, Express Tribune — Remittances Dwarf Exports, Express Tribune — Remittances Without Structured Support, Business Recorder Opinion, Business Recorder Editorial, Minute Mirror, Radio Pakistan
Discover more from The Economy
Subscribe to get the latest posts sent to your email.
AI
Anthropic Offers Up to $600,000 Salary for Critical IPO Role as AI Giant Prepares for Wall Street Debut

As anticipation builds around what could become one of the largest technology listings in recent history, artificial intelligence company Anthropic is offering an eye-catching base salary of up to $600,000 for a key investor relations position, underscoring how seriously the company is preparing for its expected initial public offering (IPO).
The San Francisco-based AI developer, best known for its Claude family of AI models, has posted a vacancy for a Director of Investor Relations with a base compensation ranging from $425,000 to $600,000, making it one of the most strategically important hires ahead of its anticipated public market debut. According to a report by Business Insider, the company is expected to pursue an IPO as early as fall 2026, following a surge in valuation and extraordinary revenue growth.
A Strategic Hire Ahead of a Landmark IPO
The investor relations director will be responsible for shaping Anthropic’s investment narrative, maintaining relationships with institutional investors, and helping Wall Street understand the company’s long-term strategy and financial outlook.
According to the job description, the successful candidate will:
- Develop Anthropic’s investment story for public markets.
- Serve as a primary liaison between executive leadership and investors.
- Analyze AI industry developments and communicate their financial implications.
- Support earnings communications, investor presentations, and regulatory disclosures.
- Work closely with the company’s newly appointed Head of Investor Relations.
The position reports into Kenneth Dorell, who joined Anthropic earlier this year after previously leading investor relations at Meta. His appointment reflects the company’s broader effort to build an experienced leadership team capable of navigating public market expectations.
Why Investor Relations Matters More Than Ever
While investor relations roles are common among public companies, they become especially significant during the transition from private to public ownership.
For Anthropic, the challenge extends beyond explaining quarterly financial results. The company must convince investors that its massive investments in AI research, computing infrastructure, and talent acquisition can translate into sustainable long-term growth.
Unlike many traditional software companies, Anthropic operates as a public benefit corporation, meaning it is legally committed to balancing shareholder returns with the responsible development of advanced artificial intelligence. The company’s official mission emphasizes building reliable, interpretable, and safe AI systems for the long-term benefit of society, according to the company’s website.
This dual mandate creates a unique communication challenge for investor relations executives, who must explain how commercial success aligns with responsible AI development.
AI Boom Drives Extraordinary Compensation
The offered salary highlights the increasingly fierce competition for executive talent across the AI industry.
Although a base salary of $600,000 is exceptional by conventional corporate standards, compensation at leading AI companies frequently includes stock awards, bonuses, and long-term incentives that can substantially increase total earnings.
Anthropic has become one of Silicon Valley’s fastest-growing companies, with demand for its enterprise AI products accelerating rapidly. The company’s coding assistant, Claude Code, has gained significant traction among software developers and businesses seeking AI-powered programming tools.
Recent reporting indicates that Anthropic’s annualized revenue has expanded dramatically as enterprise adoption of generative AI continues to accelerate, strengthening investor expectations ahead of a potential IPO.https://www.businessinsider.com/anthropic-ipo-hiring-investor-relations-director-2026-7
Preparing Wall Street for an Unconventional AI Company
Anthropic’s investor relations team faces a unique assignment.
Unlike mature technology companies with decades of operating history, frontier AI companies remain difficult to value because they invest billions of dollars annually in computing infrastructure, model training, and research talent while operating in a rapidly evolving competitive environment.
Potential investors will likely seek clarity on several key questions:
- Future profitability.
- Infrastructure spending.
- AI safety governance.
- Regulatory risks.
- Competitive positioning against OpenAI, Google, Meta, and xAI.
- Long-term monetization strategy.
The investor relations director will play a central role in translating these complex issues into a compelling investment thesis.
Strong Financial Momentum Strengthens IPO Expectations
Anthropic has emerged as one of the world’s most valuable privately held AI companies.
Backed by major investors including Amazon and Google, the company has attracted substantial funding over the past several years while rapidly expanding its enterprise customer base.
Its Claude models have become widely used for coding, research, enterprise automation, and business productivity, placing Anthropic among the strongest competitors to OpenAI.
The company’s remarkable financial momentum has fueled growing speculation that its IPO could become one of the defining public offerings of the AI era.
Competition for AI Talent Intensifies
The generous compensation package also reflects the broader battle for experienced executives across the artificial intelligence sector.
Companies developing frontier AI systems increasingly compete not only for elite researchers and engineers but also for specialists in finance, public markets, communications, and regulatory affairs.
As valuations continue climbing into the hundreds of billions of dollars, experienced executives capable of guiding companies through IPOs have become increasingly valuable.
Industry observers expect executive compensation across AI firms to remain elevated as competition intensifies.
The Bigger Picture
Anthropic’s decision to offer a base salary reaching $600,000 for an investor relations executive sends a clear signal that preparations for public markets are accelerating.
Beyond the headline salary, the recruitment reflects a broader transformation within the AI industry. As companies mature from venture-backed startups into global technology leaders, success increasingly depends not only on breakthrough research but also on convincing investors that enormous AI investments can produce sustainable long-term returns.
If Anthropic proceeds with its widely anticipated IPO, this investor relations hire could become one of the most influential behind-the-scenes roles in shaping how one of the world’s most valuable AI companies is introduced to public investors.
Sources
- Business Insider, Anthropic is offering a $600,000 salary for one of its most important IPO hires: https://www.businessinsider.com/anthropic-ipo-hiring-investor-relations-director-2026-7
- Anthropic, Official Company Website: https://www.anthropic.com/
Discover more from The Economy
Subscribe to get the latest posts sent to your email.
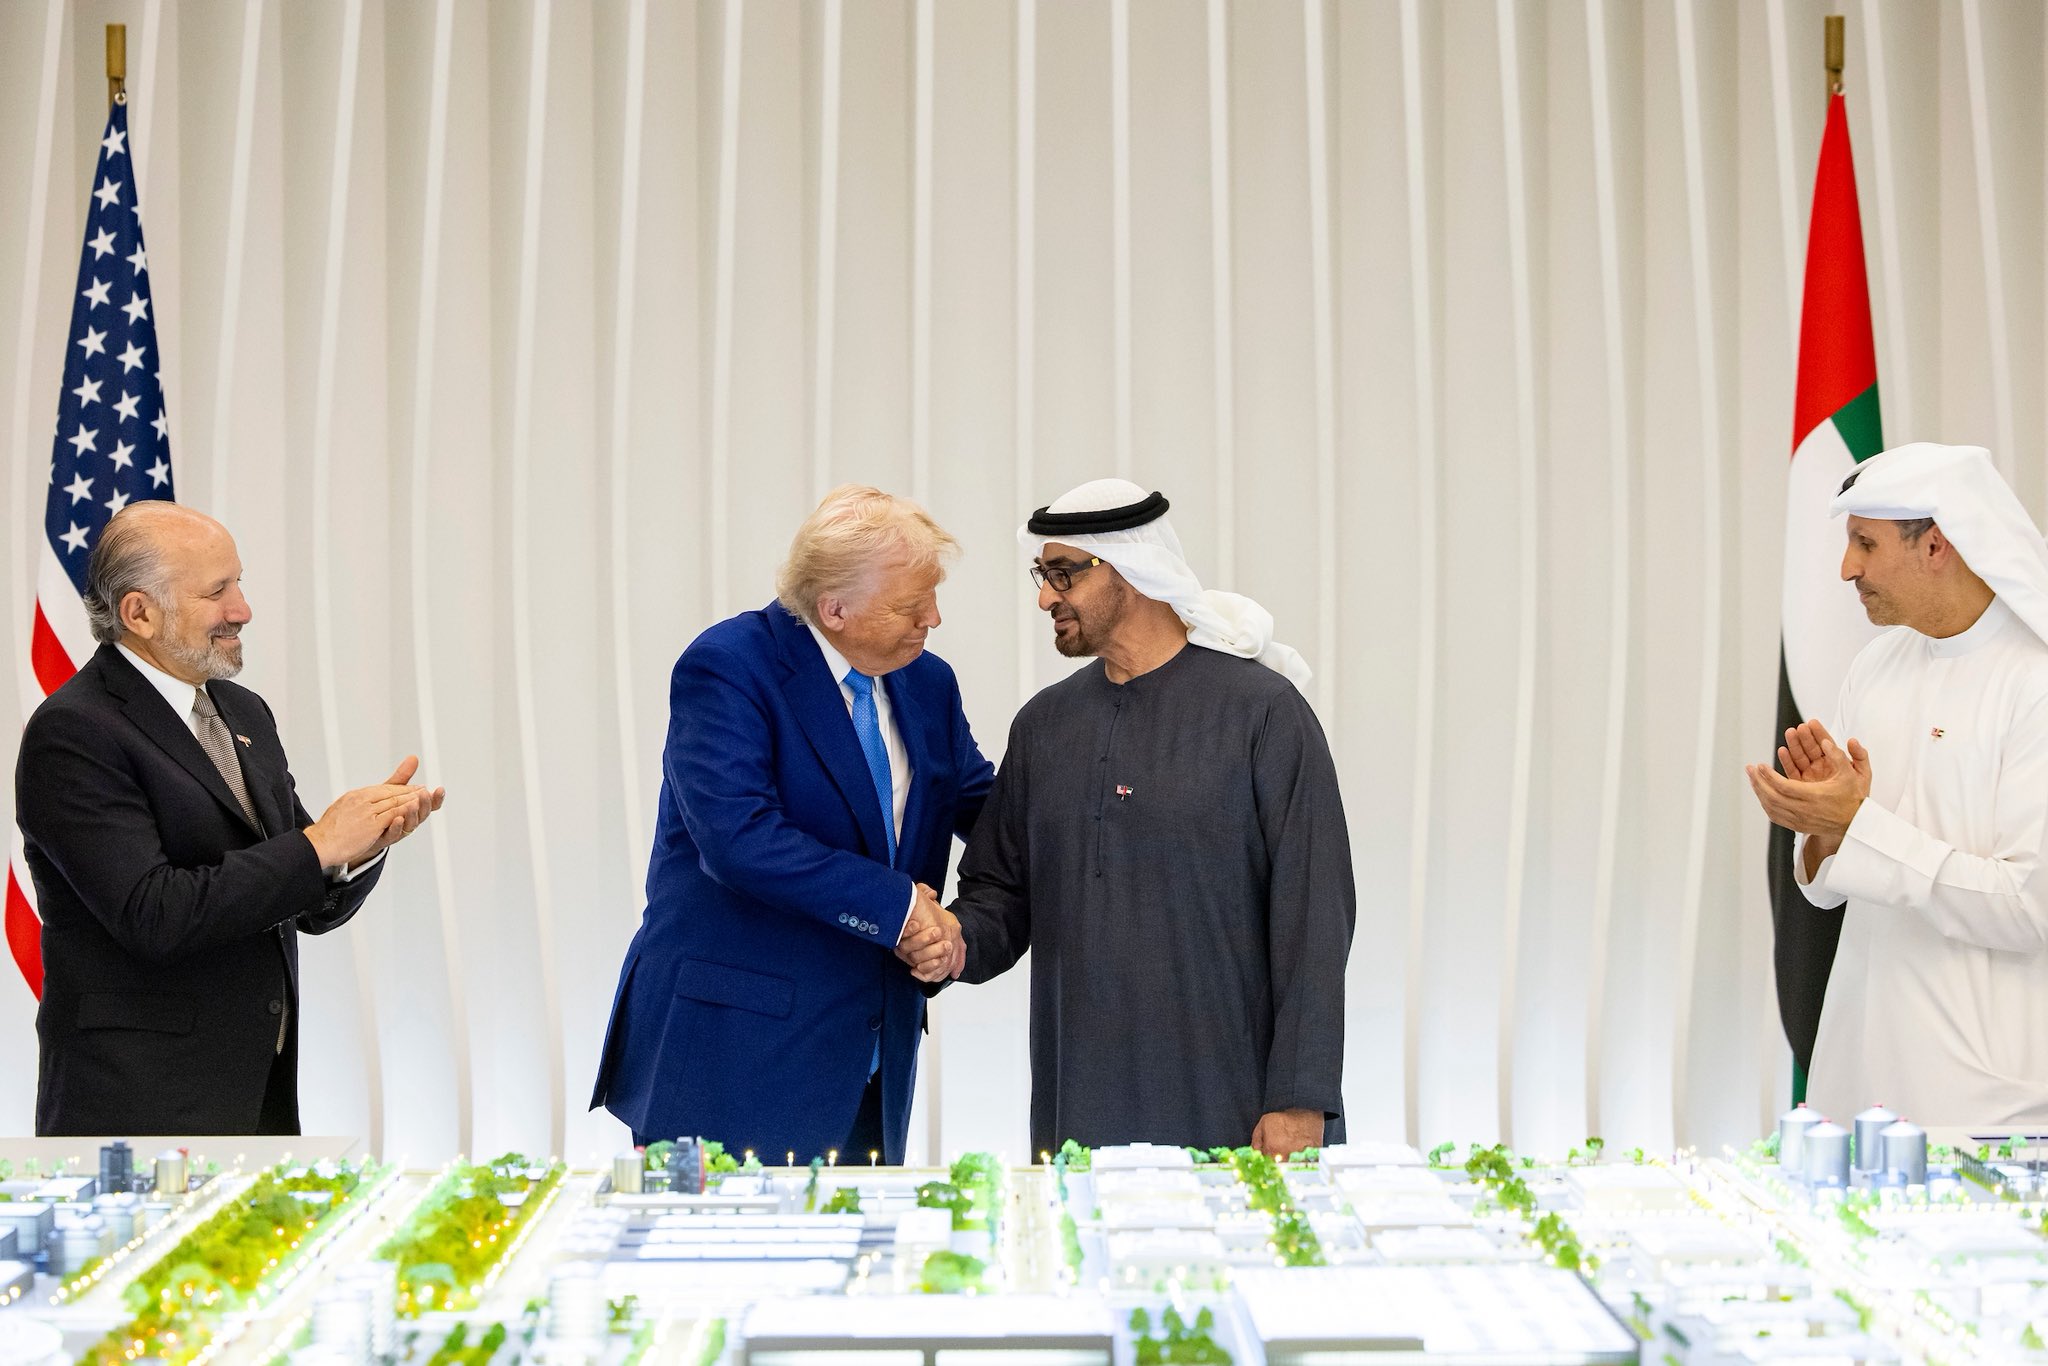
The United States is removing restrictions on the sale of advanced American technology and other sensitive goods to the UAE, effectively placing the Gulf state on the same access tier as Washington’s closest allies. The move, confirmed in mid-July 2026, arrives as Dubai posts steady non-oil-driven GDP growth and positions itself as a regional AI and data infrastructure hub — a development that has received comparatively little coverage relative to its long-term significance for Gulf-Asia trade and technology corridors.
What Changed
Reporting from the Gulf business press confirms that the US is easing restrictions on advanced technology and sensitive-goods exports to the UAE, a policy shift that effectively upgrades the country’s access status (AGBI). While the mechanics of implementation are still emerging, the shift matters because export-control tiers have become one of the primary tools Washington uses to manage the flow of advanced semiconductors and AI-relevant hardware globally — the same framework that governs, and restricts, technology flows to China.
Why Now
The timing lines up with a broader UAE economic story. Dubai’s economy grew 2.4% year-on-year in the first quarter of 2026, reaching AED 232 billion (about $63.1 billion), driven by finance, construction, healthcare, wholesale trade and real estate (Arab News; Gulf Business). More broadly, the UAE’s non-oil sector is projected to grow around 5.3% in 2026, according to World Bank data cited in regional business setup analysis, with technology, green energy and healthcare identified as the leading sectors (Barchart).
Emirates NBD projects Dubai’s economy will grow 4.5% for the full year 2026, matching 2025’s pace, supported by continued strength in tourism, infrastructure investment and population growth, alongside expectations of softer US monetary policy and reduced global trade uncertainty (Gulf News).
The Strategic Logic
Easing tech export restrictions for the UAE fits a pattern: as Washington tightens the export-control net around China — including new total-processing-power thresholds for advanced AI chips introduced in January 2026 — it has simultaneously sought to deepen technology partnerships with trusted Gulf allies to anchor AI infrastructure investment outside adversarial jurisdictions. The UAE’s aggressive push into AI data centers, sovereign compute capacity and digital infrastructure — including new sovereign data residency projects flagged in regional business coverage — positions it to absorb exactly the kind of technology transfer this policy shift would enable (Barchart).
Competitive Implications for Singapore
The UAE’s improved access tier adds a new dimension to its long-running rivalry with Singapore as Asia and the Middle East’s leading business hub. The World Bank has previously ranked Singapore the world’s most pro-business economy, with the UAE also in the global top 20 for ease of doing business (Statrys). Singapore has responded by opening its own outreach infrastructure in the Gulf — including a Middle East Enterprise Centre in Dubai launched to help Singaporean firms tap Gulf opportunities, with bilateral merchandise trade between the two economies reaching S$24 billion in 2024 (Gulf News).
An easier US technology pipeline into the UAE could accelerate Dubai’s positioning as a neutral, high-trust node for AI compute — a role increasingly sought after by companies looking to hedge exposure to both US-China tech tensions and regional instability.
Key Takeaways
- The US is lifting technology export restrictions on the UAE, aligning its access with America’s closest allies.
- The move coincides with strong non-oil GDP growth in Dubai and a broader UAE push into AI infrastructure and sovereign compute.
- The policy shift reflects Washington’s broader strategy of tightening controls on China while deepening technology ties with trusted partners.
- Singapore and the UAE remain in active competition for the role of leading global business and technology hub, with each ramping up outreach to the other’s region.
Discover more from The Economy
Subscribe to get the latest posts sent to your email.

Gulf Capital Retreat From Pakistan 2026: UAE Loan Freeze & What It Means

Pakistan’s Most Reliable Export Is Its People: Remittances Hit $41.6 Billion, Overtaking Total Exports

Indonesia’s Confidence Problem: Record Investment, a Sinking Rupiah, and a Widening Credibility Gap

Down But Not Out: Inside the Slow Sinking of Russia’s War Economy

China’s Growth Slips to a Four-Year Low: Why Beijing Still Won’t Pull the Stimulus Trigger

The Johor-Singapore Corridor: How Malaysia Became Southeast Asia’s AI Infrastructure Powerhouse

Canada’s Economy ‘On Pause’: Inside the CUSMA Deadline That Passed Without a Deal

Dubai’s Millionaire Magnet: How the UAE Turned Middle East Turmoil Into a Capital Safe-Haven Boom

Britain’s Sixth Prime Minister in a Decade: What Starmer’s Exit Means for Gilts, Sterling and Your Portfolio

Anthropic Offers Up to $600,000 Salary for Critical IPO Role as AI Giant Prepares for Wall Street Debut

EU Readies Crisis Team for Potential China Rare Earths Stand-Off as Supply Chain Risks Mount

Singapore Weighs Hedge Fund Tax Cuts to Counter Hong Kong’s Growing Financial Challenge

Facebook and Instagram Experience Global Outage

Inside the $1 Billion Tap-to-Pay Fraud Rings Targeting Banks and Retailers

Carry Trade Unwind 2026: How the Yen’s Snapback Triggered a Global Margin Call

AI Bubble Warning 2026: Why BIS, IMF and Bank of England Fear a Market Crash

Male Labor Force Participation Rate 2026: Why Men Are Leaving & Economic Impact

BRICS De‑Dollarization Strategy Takes Shape with $15 Billion Local‑Currency Push

Russia Bans Diesel Exports 2026: Global Fuel Market Impact Explained

The AI Super Bubble Is Ready to Burst

Strait of Hormuz Blockade 2026: Oil Prices Surge 9% as US-Iran Conflict Reignites

IMF Cuts Pakistan Growth Forecast, Raises Inflation to 8.4%

Private Credit Warning: Most BDCs Turn Unprofitable in 2026, Reuters Finds

India Economic Rise 2026: How the Subcontinent Toppled Japan
Gulf Capital Retreat From Pakistan 2026: UAE Loan Freeze & What It Means

Bitcoin $150k Milestone Achieved as US Sovereign Crypto Pivot Looms

Strait of Hormuz 2026: Why Markets Still Don’t Trust It’s Open

Chipmakers Just Lost 6.7% in Two Days: Inside the Great AI Trade Rotation
-

 Markets & Finance7 months ago
Top 15 Stocks for Investment in 2026 in PSX: Your Complete Guide to Pakistan’s Best Investment Opportunities
-

 Analysis5 months ago
Johor’s Investment Boom: The Hidden Costs Behind Malaysia’s Most Ambitious Economic Surge
-

 Analysis5 months ago
Top 10 Stocks for Investment in PSX for Quick Returns in 2026
-

 Analysis6 months ago
Brazil’s Rare Earth Race: US, EU, and China Compete for Critical Minerals as Tensions Rise
-

 Banks6 months ago
Best Investments in Pakistan 2026: Top 10 Low-Price Shares and Long-Term Picks for the PSX
-

 Investment7 months ago
Top 10 Mutual Fund Managers in Pakistan for Investment in 2026: A Comprehensive Guide for Optimal Returns
-

 Global Economy7 months ago
15 Most Lucrative Sectors for Investment in Pakistan: A 2025 Data-Driven Analysis
-

 Global Economy7 months ago
Pakistan’s Export Goldmine: 10 Game-Changing Markets Where Pakistani Businesses Are Winning Big in 2025