
Analysis
The $15 Million Pork Deal Debacle: Unmasking Foreign Investment Risks in China and Lessons for Global Investors


How a promising pork processing venture became a decade-long legal nightmare—and what it reveals about the hidden architecture of Chinese investment risk
Imagine wiring $15 million into what looks like a textbook emerging-market opportunity: a growing Chinese middle class, a company processing a protein that feeds 1.4 billion people, and a founding entrepreneur with the kind of origin story that makes investor decks sing. Now imagine watching that investment slowly, methodically disappear—not through market forces or honest failure, but through a labyrinth of alleged fraud, locked boardrooms, and local authorities who seem oddly incurious about your legal rights as a foreign shareholder.
That is not a hypothetical. That is the lived reality of the investors behind the Chuming Group saga—a case that has quietly become one of the starkest cautionary tales about foreign investment risks in China to emerge in years, and one that every global executive contemplating a China entry strategy needs to understand before signing anything.
A Promising Start Turns Sour: The Chuming Group Saga
In 2007, the China investment story was still intoxicating. GDP growth was humming above 11%. Consumer demand was exploding. And pork—the single most consumed meat in China—was a sector with the kind of fundamentals that make fund managers salivate.
Against this backdrop, a coalition of foreign investors that included U.S.-based Hunter Wise Financial Group and Canada’s Redwood Capital committed a combined $15.4 million into Dalian-based Chuming Group, a pork processing company founded by entrepreneur Shi Huashan. The investment was structured through a British Virgin Islands special-purpose vehicle—a common mechanism for offshore capital entering China, designed in theory to provide legal insulation and repatriation flexibility.
For years, the arrangement appeared to function. Chuming expanded. Shi cultivated relationships with local government. The pork moved, the ledgers balanced—or appeared to.
Then came 2019.
According to documents reviewed by Caixin Global, Chuming entered what investors describe as a fraudulent bankruptcy restructuring that year—a process they allege was engineered to dilute and ultimately expropriate foreign shareholdings rather than genuinely rehabilitate a financially distressed enterprise. Investors say they were locked out of shareholder meetings, denied access to audited financials, and stonewalled when they attempted to exercise basic governance rights. Local authorities in Dalian, they claim, proved either unwilling or unable to intervene on their behalf.
What followed was not a swift courtroom resolution. It was a years-long legal odyssey through Chinese courts, arbitration panels, and diplomatic back-channels that has, as of early 2026, yet to deliver meaningful restitution.
Hidden Pitfalls: Regulatory and Local Authority Hurdles in China
The Chuming case is not unique. It is, in fact, symptomatic of a structural vulnerability that foreign investors have been documenting for decades—one that China’s recent legal reforms have done little to fully address.
Regulatory opacity sits at the heart of the problem. China’s corporate insolvency framework, governed primarily by the Enterprise Bankruptcy Law of 2006, grants local courts wide discretion in managing restructuring proceedings. In practice, this discretion frequently advantages locally connected insiders over foreign creditors and shareholders. As Reuters reported in April 2025 in its investigation into murky bankruptcy proceedings across Chinese manufacturing sectors, the restructuring mechanism has become, in certain cases, a tool of asset extraction rather than debt resolution—with offshore investors bearing the terminal losses.
Local government interference compounds the problem. In China’s political economy, municipal and provincial governments maintain deep, often opaque relationships with major local employers. A company like Chuming—one that provides jobs, pays local taxes, and cultivates ties with the party apparatus—benefits from a gravitational field of institutional protection that foreign minority shareholders simply cannot penetrate. This is what economists sometimes call the “local champion” dynamic: the implicit prioritization of domestic economic interest over foreign legal claims, particularly when enforcement would require embarrassing a well-connected local entrepreneur.
The obstacles facing Chuming’s investors map with uncomfortable precision onto a broader typology of China investment pitfalls that includes:
- Variable Interest Entity (VIE) structure vulnerabilities, where contractual arrangements substitute for equity ownership and create enforcement gaps
- Opaque related-party transactions that obscure the movement of assets before restructuring events
- Judicial partiality, particularly in lower courts where local government influence is most pronounced
- Shareholder lockout mechanisms, including irregular amendments to articles of association that dilute or void foreign voting rights
- Information asymmetry, where auditors and advisors with local relationships provide sanitized reporting to offshore investors
Chinese Business Scams Targeting Foreign Investors: A Wider Pattern
It would be intellectually dishonest to treat the Chuming situation as an isolated aberration. The Business Times documented in its February 22, 2026 analysis how the pattern of Chinese business scams targeting foreign investors has evolved over the past decade—from outright pump-and-dump schemes in small-cap Chinese stocks listed on U.S. exchanges to more sophisticated, longer-horizon investment extraction via fraudulent restructuring.
Consider the comparative landscape:
| Case Type | Mechanism | Typical Loss Horizon | Recourse Available |
|---|---|---|---|
| Chuming Group (2019) | Fraudulent bankruptcy restructuring | 5–15 years post-investment | Extremely limited |
| U.S.-listed Chinese stock fraud (2020–2023) | Accounting manipulation, delistings | 1–3 years | SEC enforcement, class action |
| VIE structure collapse | Contractual voiding, regulatory shift | Variable | Minimal; offshore arbitration |
| Real estate JV expropriation | Asset transfer to local partner | 3–10 years | Bilateral treaty dependent |
The pattern that emerges is troubling: the more patient and committed the foreign capital, the more vulnerable it tends to be. Short-term portfolio investors in liquid Chinese equities at least have an exit. Long-term direct investors in operating companies—particularly those in sectors touching food security, technology, or strategic infrastructure—find themselves entangled in relationships where exit is costly and legal enforcement is effectively discretionary.
The Macro Context: FDI Collapse and Geopolitical Headwinds
None of this happens in a vacuum. The Chuming saga is unfolding against a macroeconomic backdrop that should give every global CFO pause.
China’s inbound foreign direct investment fell to approximately $4.5 billion in 2024—a figure so stark it represents a multi-decade low, and one that Mitsui’s economic research unit flagged as evidence of a structural, not merely cyclical, investor retreat. For context, China was attracting well over $150 billion annually as recently as 2021. That collapse reflects not just U.S.-China geopolitical tensions, but a dawning recognition among multinational corporations that the risk-return calculus of China exposure has fundamentally shifted.
China’s negative list—the catalogue of sectors formally restricted to foreign investment—has been incrementally trimmed in recent years as Beijing attempts to signal openness. The 2024 edition reduced restrictions in manufacturing and healthcare. But the negative list is a floor, not a ceiling. Informal barriers, regulatory ambiguity, and the kind of local-level interference documented in the Chuming case operate well above the floor—in the vast gray zone where written law and practiced reality diverge.
Xi Jinping’s government has, to its credit, invested rhetorically in what it calls “foreign-related rule of law” reforms—a framework designed to give foreign businesses more confidence in Chinese courts and arbitration bodies. The creation of specialized international commercial courts in Shanghai and Shenzhen reflects genuine institutional ambition. But investors who have sat across from those courts know that ambition and outcome remain unevenly matched, particularly outside tier-one cities and particularly when domestic political interests are engaged.
Meanwhile, China’s broader economic slowdown—with GDP growth moderating toward the 4–4.5% range amid a protracted property sector crisis, deflationary pressure, and export overcapacity in industries from electric vehicles to solar panels—is compressing the fundamental returns that once made Chinese investments worth the risk premium. When the growth story weakens, the risk calculus shifts, and cases like Chuming’s stop looking like outliers.
Fraudulent Restructuring in China: When Courts Become Instruments
The mechanism alleged in the Chuming case—fraudulent restructuring deployed against foreign shareholders—deserves particular scrutiny because it exploits a gap that many foreign investors fail to anticipate during deal structuring.
In a legitimate bankruptcy restructuring, all creditors and shareholders are notified, given standing, and afforded the opportunity to contest proposed reorganization plans. In the scenario Chuming’s investors describe, that process was allegedly circumvented: notifications were irregular, valuations were opaque, and the reorganization plan that emerged effectively transferred control and assets to domestically connected parties at prices that bore no relationship to the company’s actual worth.
This is not legally permissible under Chinese law as written. But enforcement requires a court willing to investigate, appoint independent administrators, and rule against locally powerful interests—a combination that Chinese judicial practice delivers inconsistently at best, particularly in municipal courts where the sitting judges are appointed through party structures with direct links to local government.
The BVI structuring that Chuming’s investors used—standard practice at the time—provided little protection. Chinese courts have become increasingly willing to pierce offshore structures when it serves domestic interests, even as they resist doing so when it would benefit foreign claimants. It is a legal asymmetry that amounts to a structural subsidy for asset extraction.
Lessons for Global Investors: Navigating China Investment Pitfalls
The Chuming Group case is a tragedy, but it is a useful one. From its wreckage, sophisticated investors can extract a practical framework for navigating China investment pitfalls with greater resilience.
1. Structural safeguards before capital deployment Offshore holding structures alone are insufficient. Investors should negotiate drag-along rights, anti-dilution protections, and specific bankruptcy notification obligations into both the offshore and onshore documentation—and stress-test enforcement with local counsel who have adversarial experience, not just transactional.
2. Independent governance from day one Minority foreign shareholders need seats on audit committees with the power to appoint independent auditors. Without that, financial reporting is a black box that can be manipulated in the years before a restructuring event.
3. Jurisdiction selection in dispute resolution Hong Kong arbitration through HKIAC, or Singapore arbitration through SIAC, offers meaningfully more reliable enforcement than domestic Chinese courts for cross-border commercial disputes. The key is ensuring that arbitral awards can be attached to assets accessible outside China—which requires deliberate structuring, not assumption.
4. Political risk insurance Products from multilateral institutions like MIGA (Multilateral Investment Guarantee Agency) or private underwriters like AXA XL can provide coverage against expropriation and breach of contract—including by government interference. Uptake among mid-market investors has historically been low; it should not be.
5. Diversification of China exposure The era of treating China as a single homogenous investment destination is over. Regional risk profiles vary dramatically: coastal special economic zones offer more institutional predictability than inland cities. Sector matters too—consumer technology and healthcare typically face different enforcement environments than food processing or strategic manufacturing.
6. Continuous monitoring and exit planning Unlike public market investments, direct investments in Chinese operating companies require active governance. Investors who disengage after deal close—relying on annual reports and periodic calls with management—create exactly the information vacuum that enables the kind of slow-motion expropriation alleged in the Chuming case. Build monitoring protocols with real teeth, including rights to appoint observers and conduct surprise audits.
Looking Forward: Reform Promise vs. Structural Reality
China is not a lost investment frontier. It remains the world’s second-largest economy, a manufacturing superpower, and for the right investor with the right structure in the right sector, a generator of genuine returns. Beijing’s Encouraged Industries Catalogue—which offers preferential tax treatment and streamlined approvals for foreign investment in advanced manufacturing, green energy, and high-value services—reflects a real strategic interest in selective FDI attraction.
But the Chuming Group case is a reminder that the distance between Beijing’s policy intentions and ground-level execution can be vast, and that foreign investors who fail to account for that distance pay for the lesson in years of litigation and millions in lost capital.
The $15.4 million that Hunter Wise, Redwood Capital, and their co-investors wired into Dalian in 2007 was not reckless money. It was thoughtfully deployed, legally structured, and commercially sound by the standards of its time. What it lacked was a sufficient understanding of how foreign investment risks in China operate not at the policy level, but at the institutional level—in the courtrooms, municipal offices, and party committee meetings where the real terms of foreign capital’s welcome are quietly negotiated.
Until that gap closes—and despite reform rhetoric, it has not closed sufficiently—global investors would do well to treat the Chuming saga not as an anomaly, but as a syllabus.
Discover more from The Economy
Subscribe to get the latest posts sent to your email.


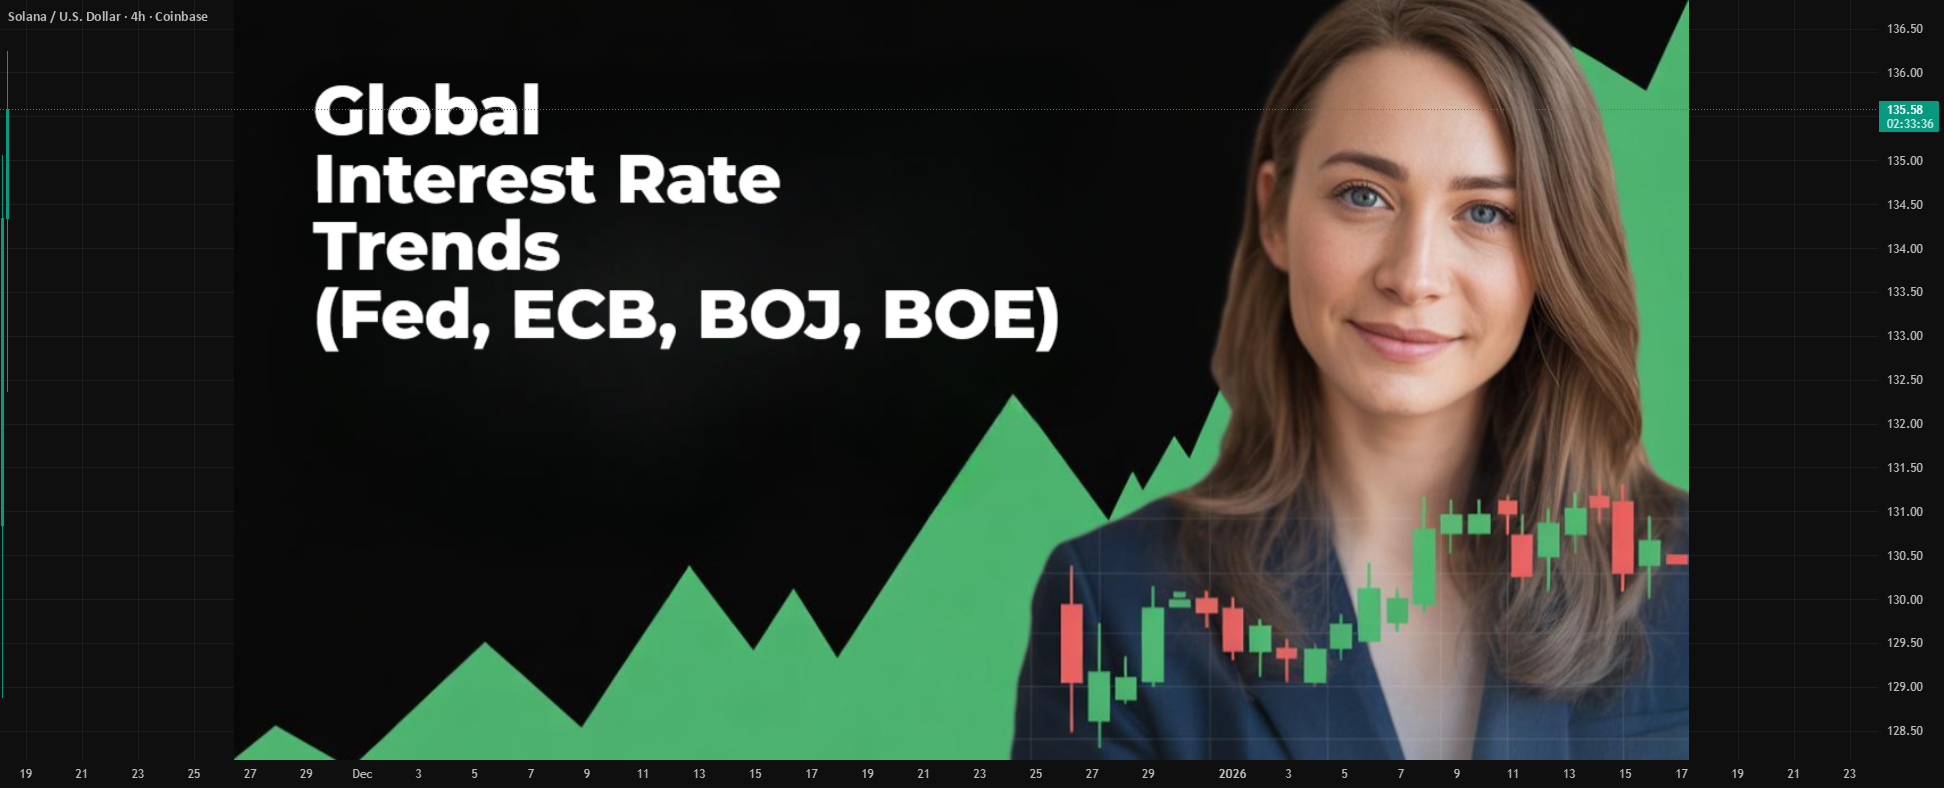
Analysis of how the Federal Reserve, Bank of England and Bank of Japan could reshape global markets, inflation, currencies and economic growth in 2026.
Executive Summary
The world’s most influential central banks are entering one of the most consequential policy weeks of 2026. Investors are watching closely as the U.S. Federal Reserve, the Bank of England, and the Bank of Japan weigh the competing pressures of easing inflation, geopolitical uncertainty, elevated energy prices, and slowing global growth. Financial markets are also preparing for major corporate earnings and fresh GDP data from several advanced economies. �
Financial Times +1
Unlike the synchronized tightening cycle that dominated recent years, policymakers are increasingly responding to country-specific economic conditions. This divergence is expected to influence capital flows, exchange rates, bond yields, and investment decisions across both developed and emerging markets. �
McKinsey & Company +1
A New Monetary Landscape
Global inflation has moderated from its post-pandemic peaks, yet central banks remain cautious. Recent movements in energy markets and ongoing geopolitical tensions continue to threaten price stability, even as labor markets show signs of cooling. �
McKinsey & Company +1
For investors, the question is no longer whether interest rates have peaked, but how long they will remain elevated.
United States: The Federal Reserve Faces a Delicate Balance
Attention is centered on the Federal Reserve, where policymakers are expected to keep rates steady while evaluating the effects of inflation, consumer demand, and accelerating investment in artificial intelligence infrastructure. Markets are also monitoring whether AI-driven capital spending could contribute to future inflationary pressures. �
Investopedia +1
Bond investors remain sensitive to any shift in the Fed’s language, as Treasury yields continue to reflect expectations about future policy and inflation risks. �
MarketWatch
United Kingdom: Stability Before Growth
The Bank of England is expected to maintain a cautious stance amid moderating wage growth and relatively stable unemployment. However, policymakers continue to weigh external risks, including energy market volatility and global geopolitical developments. �
Financial Times
Businesses remain particularly attentive to borrowing costs, which continue to influence investment decisions across the UK economy.
Japan Ends an Era of Ultra-Loose Money
Japan is undergoing one of its most significant monetary transitions in decades. Rising wages and gradually strengthening inflation have encouraged the Bank of Japan to continue moving away from the ultra-accommodative policies that defined much of the past generation. �
Financial Times
This normalization has implications far beyond Japan, affecting global capital markets and currency dynamics.
Why Emerging Markets Are Watching Closely
Emerging economies including Pakistan, Indonesia, Malaysia, and others remain particularly exposed to decisions made by advanced economy central banks.
Higher U.S. interest rates typically strengthen the dollar, increase external financing costs, and place pressure on countries with significant foreign currency debt.
Conversely, a more stable interest rate environment could improve capital flows into emerging markets while easing exchange rate volatility.
AI Is Becoming a Monetary Policy Variable
One of the most important structural developments in 2026 is the rapid expansion of artificial intelligence infrastructure.
Major technology companies continue investing heavily in data centers, semiconductors, cloud computing, and digital infrastructure. These investments are supporting economic growth but are also creating new questions about inflation, productivity, and long-term financing needs. �
Investopedia +1
Investment Implications
Several themes are emerging:
Higher-for-longer interest rates remain possible.
Government bond markets are likely to remain volatile.
The U.S. dollar could remain relatively strong.
AI-related investment continues attracting capital.
Emerging markets may benefit if inflation continues to moderate.
Competitor Keyword Gap Analysis
Leading publications such as the Financial Times, Reuters, Bloomberg, and CNBC primarily emphasize immediate policy decisions. An opportunity exists to capture additional search traffic by targeting broader intent-based queries.
Key Takeaways
Central bank decisions this week are expected to shape global financial markets.
AI investment is becoming an increasingly important economic driver.
Bond markets remain sensitive to inflation expectations.
Emerging economies face both risks and opportunities from policy divergence.
Investors should monitor GDP releases, corporate earnings, and inflation indicators alongside interest rate announcements.
Frequently Asked Questions
Why are central bank meetings so important?
They influence borrowing costs, inflation expectations, currency values, and investment decisions worldwide.
How do interest rates affect stock markets?
Higher rates generally increase financing costs and can reduce company valuations, while lower rates often support economic activity and equity markets.
Why is AI influencing monetary policy discussions?
Large-scale investment in AI infrastructure is reshaping productivity, corporate spending, and long-term inflation expectations.
Discover more from The Economy
Subscribe to get the latest posts sent to your email.
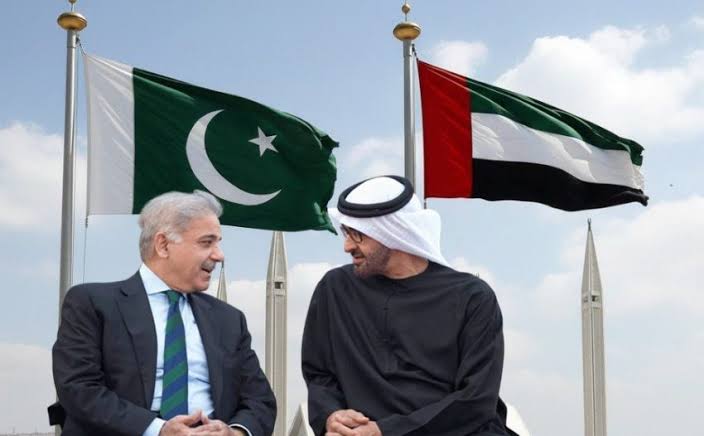
What happened: In early 2026, the United Arab Emirates declined to roll over a $3 billion loan to Pakistan — the first such refusal in seven years. The repayment equalled roughly 18% of Pakistan’s foreign currency reserves, arriving as Islamabad also faced a $1.3 billion bond payment and was waiting on the next IMF tranche.
Why it matters: It’s the clearest sign yet that Gulf sovereign patience with Pakistan’s balance-of-payments cycle is thinning, even as Gulf states simultaneously court China, Saudi Arabia, and each other for capital in a tightening regional liquidity environment.
The Story Nobody’s Connecting
Most coverage of Pakistan’s 2026 external account stress treats the UAE’s loan decision as an isolated liquidity event — a “routine financial transaction,” in the words of Pakistan’s own Ministry of Foreign Affairs. That framing misses the bigger pattern. The same weeks that Abu Dhabi called in its $3 billion, unusual delays began appearing in bank transfers from Saudi Arabia to the UAE itself — friction between the Gulf’s two largest economies, at a moment when both are also managing their own post-war oil price adjustment. (Pakistan & Gulf Economist)
Put those two data points together and a different story emerges: this isn’t just about Pakistan’s creditworthiness. It’s about Gulf capital becoming more selective, more transactional, and less willing to extend informal grace periods across the board — with Pakistan simply the most exposed borrower in the queue.
The Numbers Behind the Pressure
Pakistan’s State Bank held $16.4 billion in reserves as of late March 2026 — enough to cover roughly three months of imports, a threshold economists generally treat as a comfort floor, not a cushion. (Mettis Global News) The UAE’s declined rollover landed at the same time as a looming $1.3 billion international bond payment and dependence on the next $1.2 billion IMF disbursement — a convergence of obligations that left the State Bank with limited room to maneuver beyond import restrictions, rate hikes, or fresh commercial borrowing.
The backdrop matters too. The rupee had been trading in a comparatively narrow 278–282 band before the escalation of the Iran conflict pushed global oil prices higher, squeezing Pakistan’s import bill precisely when its Gulf safety net began to wobble. The KSE-100 benchmark, meanwhile, had already shed around 15% amid the broader pressure. (Mettis Global News)
This is not Pakistan’s first Gulf-dependency cycle. The IMF’s own record shows a now-familiar pattern: staff-level agreements reached in Dubai, UAE pledges of multibillion-dollar investment arriving alongside IMF tranches, and Gulf bridge financing used to stave off sovereign default in periods when reserves cover shrinks toward zero. (Business Standard) What’s different in 2026 is that the bridge itself is showing cracks.
Islamabad’s Official Line vs. the Structural Reality
Pakistan’s government has leaned into a “stability to sustainable growth” narrative around its FY2026–27 federal budget, with the finance minister framing the transition as export-driven rather than reserve-dependent. Business groups have broadly welcomed the budget, and the current account posted a $459 million surplus in May 2026, an improvement attributed to strong remittance inflows. (Business Recorder) The Monetary Policy Committee has held rates steady rather than reaching for emergency tightening, which is itself a signal that the central bank does not yet see the UAE episode as a systemic trigger.
But a current account surplus built substantially on remittances is different from one built on export competitiveness or durable FDI. Pakistan’s trade structure still leans heavily on a narrow set of partners: China supplies over a quarter of its imports and a meaningful share of its exports, the UAE is both a top export destination and its second-largest import source, and Gulf states collectively remain the primary channel for both remittances and emergency liquidity. (Wikipedia — Economy of Pakistan) That concentration is precisely what makes a single Gulf lender’s changed appetite so consequential.
Why the Oil Backdrop Compounds the Risk
None of this is happening in a vacuum. The IMF’s own July 2026 commentary noted that global oil markets “absorbed the war shock” from the Iran conflict, but cautioned that buffers — spare production capacity, strategic reserves, shipping insurance capacity — are running low. (IMF Blog) For an oil-importing, reserve-constrained economy like Pakistan, a second energy price shock without deeper buffers would land directly on the same reserves the UAE loan was meant to protect.
What to Watch Next
- Whether Saudi Arabia steps in as an alternative bridge lender, or whether the Riyadh–Abu Dhabi transfer friction signals a broader Gulf liquidity tightening that limits everyone’s appetite to backstop Pakistan.
- The pace and size of the next IMF tranche, and whether Fund conditionality shifts to demand deeper reserve buffers given the UAE precedent.
- Whether China increases its role as lender of last resort, deepening Pakistan’s dependency in exactly the direction Gulf financing was historically meant to offset.
Discover more from The Economy
Subscribe to get the latest posts sent to your email.
Introduction
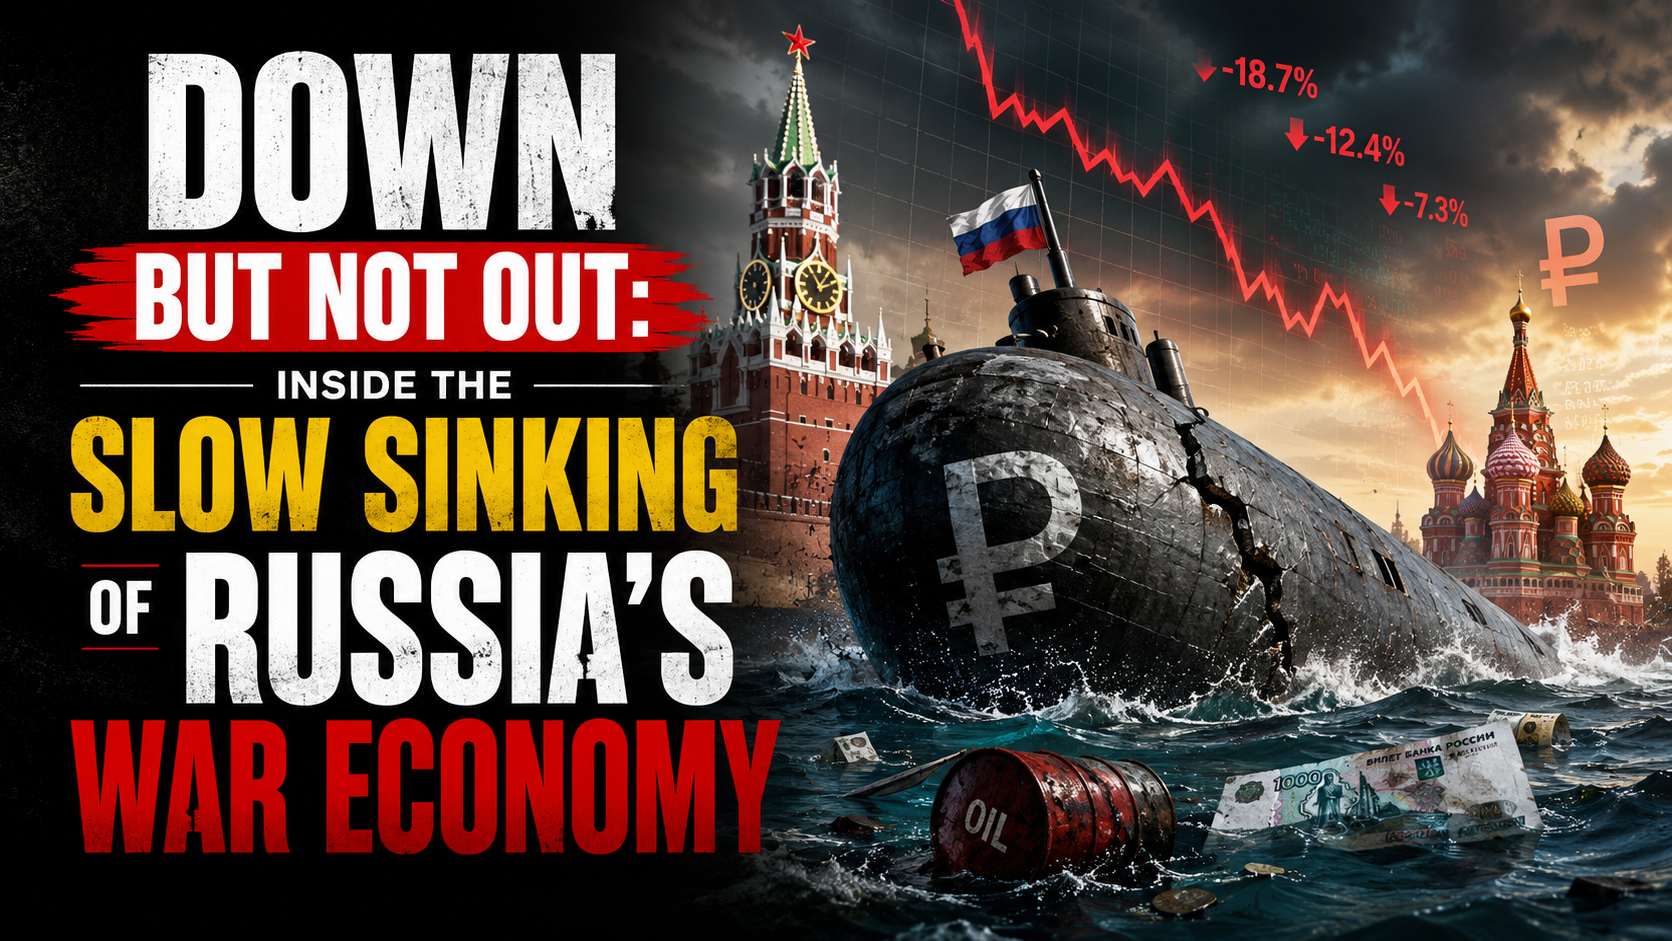
The European Council formally extended its economic sanctions against Russia for another full year on 25 June 2026, keeping restrictive measures in place until 31 July 2027 (Council of the EU). More than four years into the war, the headline story of Russia’s economy has shifted from whether sanctions would work to a more nuanced question: how much longer can the Kremlin keep financing the war before the accumulated strain becomes impossible to hide behind favorable official statistics.
The Sanctions Architecture, Renewed Again
The EU’s economic measures against Russia, first introduced in 2014 and dramatically expanded after the February 2022 full-scale invasion, now span trade, finance, energy and dual-use technology restrictions, alongside asset freezes and travel bans on a broad range of individuals and entities (Council of the EU). Since February 2022, the EU has adopted 20 separate sanctions packages, and the European Council has explicitly stated it remains determined to keep weakening Russia’s war economy by further reducing its energy revenues, curbing shadow-fleet oil shipping operations and constraining its banking system (Council of the EU). Separately, on 3 July 2026 the EU sanctioned six individuals connected to the poisoning and death of opposition figure Alexei Navalny, underscoring that the sanctions regime continues to expand on human-rights grounds as well as economic ones (Council of the EU Sanctions Timeline).
The Headline Numbers Beijing-Style Optimism Can No Longer Explain Away
Russia’s GDP is now put at roughly $2.51 trillion, the world’s eleventh-largest economy — comparable in size to South Korea despite Russia’s vastly larger landmass and resource base — with 2026 growth projected at just 1.0% and inflation running at 5.2% (Statistics of the World). More pessimistic estimates put full-year 2026 growth even lower, at around 0.4%, which would be worse than 2025’s already-weak 1% expansion and would mark a sharp deceleration from the 4.1% growth Russia posted in 2023 as it forged new trading relationships to route around initial sanctions (Forbes).
Oil and gas revenues — historically around half of Russia’s state income — have fallen to roughly a quarter, a deliberate outcome of Western sanctions strategy that targets how much Russia earns from exports rather than blocking those exports outright (Stockholm School of Economics/SITE). Russia’s oil and gas budget revenues reportedly halved in January 2026 alone, with crude prices falling below $73 a barrel before the Middle East conflict briefly reversed the trend, sending Brent surging more than 55% to near $120 a barrel at its peak (Forbes).
The Middle East War: A Temporary Lifeline With Long-Term Costs
The spike in oil prices tied to the Iran conflict, combined with a period of eased US sanctions enforcement on Russian oil under President Trump, offered Moscow unexpected fiscal breathing room in mid-2026 (Forbes). But that same conflict has undermined Russia’s longer-term energy diversification ambitions in the region: two Russian-backed power plant projects in Iran have been put on hold, along with oil and gas exploration work and plans to build new transit routes linking Russia to India via Iran (Forbes).
The Gap Between Official Statistics and Underlying Reality
Perhaps the most important analytical point from recent research is not about any single data point but about the reliability of Russian statistics themselves. Torbjörn Becker of the Stockholm Institute of Transition Economics has argued the real test of sanctions is not whether they end the war overnight, but how much they erode the Kremlin’s capacity to finance it — and by that measure, the evidence points to deeper strain than headline GDP figures suggest (Stockholm School of Economics/SITE). Becker notes that Russia’s economy grew only modestly in 2022 despite oil prices rising sharply that year — a gap between expected and actual performance that implies a considerably larger hidden economic hit than the official contraction figures showed (Stockholm School of Economics/SITE). Compounding the problem, Russian authorities have stopped publishing several key statistics since 2022, making independent assessment of inflation, consumption and real economic conditions increasingly difficult — leading Becker to conclude that “statistics have become part of the narrative” rather than a neutral measure of economic reality (Stockholm School of Economics/SITE).
The Military-Civilian Economic Split
A recurring theme across recent analysis is the growing bifurcation between Russia’s overheating military-industrial sector and a stagnating civilian economy. This imbalance has pushed interest rates higher and forced the liquidation of a striking 71% of Russia’s gold reserves to help fund continued war spending (Forbes). Russia’s total fossil fuel export revenue is estimated at roughly €734 million per day, underscoring just how central hydrocarbon income remains to the entire war financing model even as that revenue stream shrinks (Forbes).
The Counter-Narrative: Wages Still Rising
It would be inaccurate to describe Russia’s economy as in freefall. CSIS research notes that Russian salaries rose 17.8% in nominal terms and 8.7% in real terms in 2024 compared to 2023, with disposable incomes up 6.1% in 2023 and 7.3% in 2024 — growth rates not seen in Russia in almost two decades (CSIS). Government budget projections still expect real salaries to rise, albeit at a decelerating pace: 7% in 2025, 5.7% in 2026 and 4.1% in 2027 — a marked slowdown from the 2024 peak but still roughly double the pre-invasion decade average (CSIS). This wage growth, driven substantially by wartime labor shortages and military-adjacent spending, is precisely the kind of headline-stabilizing data point that has allowed Putin to argue publicly that sanctions have failed to cripple his economy (Fortune) — even as think tanks describe the broader trajectory as pushing Russia toward what one report calls an “economic, political, and military abyss” (Fortune).
What Comes Next
Renewed legislative pressure in Washington — including the Sanctioning Russia Act introduced with strong bipartisan support — signals appetite in the US for tightening the screws further, even as the loss of a key congressional champion for that effort has complicated the political path forward (TIME). Whether the EU’s renewed sanctions regime, continued oil price pressure, and constrained reserves ultimately force a shift in Kremlin calculus toward negotiation remains the central open question for 2027.
Key Takeaways
- The EU has extended Russia sanctions for a further year, through 31 July 2027, continuing a regime built from 20 separate packages since 2022.
- Russia’s 2026 GDP growth is forecast between 0.4% and 1.0%, a sharp deceleration from 2023’s 4.1% post-shock rebound.
- Oil and gas revenue’s share of Russian state income has fallen from roughly half to about a quarter as Western sanctions target export earnings specifically.
- Russia has liquidated a large share of its gold reserves to sustain war financing amid a widening split between an overheating military sector and a stagnating civilian economy.
- Official Russian statistics likely understate the true economic strain, according to independent economists who cite a widening gap between reported and expected performance.
Sources: Council of the EU, Council of the EU Sanctions Timeline, Stockholm School of Economics/SITE, Forbes, Statistics of the World, CSIS, Fortune, TIME
Discover more from The Economy
Subscribe to get the latest posts sent to your email.

Global Central Banks 2026: Fed, BoE and BoJ Decisions Could Reshape Markets

Gulf Capital Retreat From Pakistan 2026: UAE Loan Freeze & What It Means

Pakistan’s Most Reliable Export Is Its People: Remittances Hit $41.6 Billion, Overtaking Total Exports

Indonesia’s Confidence Problem: Record Investment, a Sinking Rupiah, and a Widening Credibility Gap

Down But Not Out: Inside the Slow Sinking of Russia’s War Economy

China’s Growth Slips to a Four-Year Low: Why Beijing Still Won’t Pull the Stimulus Trigger

The Johor-Singapore Corridor: How Malaysia Became Southeast Asia’s AI Infrastructure Powerhouse

Canada’s Economy ‘On Pause’: Inside the CUSMA Deadline That Passed Without a Deal

Dubai’s Millionaire Magnet: How the UAE Turned Middle East Turmoil Into a Capital Safe-Haven Boom

Britain’s Sixth Prime Minister in a Decade: What Starmer’s Exit Means for Gilts, Sterling and Your Portfolio

Anthropic Offers Up to $600,000 Salary for Critical IPO Role as AI Giant Prepares for Wall Street Debut

EU Readies Crisis Team for Potential China Rare Earths Stand-Off as Supply Chain Risks Mount

Singapore Weighs Hedge Fund Tax Cuts to Counter Hong Kong’s Growing Financial Challenge

Facebook and Instagram Experience Global Outage

Carry Trade Unwind 2026: How the Yen’s Snapback Triggered a Global Margin Call

AI Bubble Warning 2026: Why BIS, IMF and Bank of England Fear a Market Crash

BRICS De‑Dollarization Strategy Takes Shape with $15 Billion Local‑Currency Push

Male Labor Force Participation Rate 2026: Why Men Are Leaving & Economic Impact

The AI Super Bubble Is Ready to Burst

Russia Bans Diesel Exports 2026: Global Fuel Market Impact Explained

Strait of Hormuz Blockade 2026: Oil Prices Surge 9% as US-Iran Conflict Reignites

Private Credit Warning: Most BDCs Turn Unprofitable in 2026, Reuters Finds

IMF Cuts Pakistan Growth Forecast, Raises Inflation to 8.4%

Bitcoin $150k Milestone Achieved as US Sovereign Crypto Pivot Looms
Gulf Capital Retreat From Pakistan 2026: UAE Loan Freeze & What It Means

India Economic Rise 2026: How the Subcontinent Toppled Japan

Strait of Hormuz 2026: Why Markets Still Don’t Trust It’s Open

China Housing Market Turnaround: White‑List Model Stabilises Prices
-

 Markets & Finance7 months ago
Top 15 Stocks for Investment in 2026 in PSX: Your Complete Guide to Pakistan’s Best Investment Opportunities
-

 Analysis5 months ago
Johor’s Investment Boom: The Hidden Costs Behind Malaysia’s Most Ambitious Economic Surge
-

 Analysis5 months ago
Top 10 Stocks for Investment in PSX for Quick Returns in 2026
-

 Analysis6 months ago
Brazil’s Rare Earth Race: US, EU, and China Compete for Critical Minerals as Tensions Rise
-

 Banks6 months ago
Best Investments in Pakistan 2026: Top 10 Low-Price Shares and Long-Term Picks for the PSX
-

 Investment7 months ago
Top 10 Mutual Fund Managers in Pakistan for Investment in 2026: A Comprehensive Guide for Optimal Returns
-

 Global Economy7 months ago
15 Most Lucrative Sectors for Investment in Pakistan: A 2025 Data-Driven Analysis
-

 Global Economy7 months ago
Pakistan’s Export Goldmine: 10 Game-Changing Markets Where Pakistani Businesses Are Winning Big in 2025