
Markets & Finance
Strait of Hormuz Deal 2026: Iran-Oman Talks, Oil Price Impact & What Happens Next

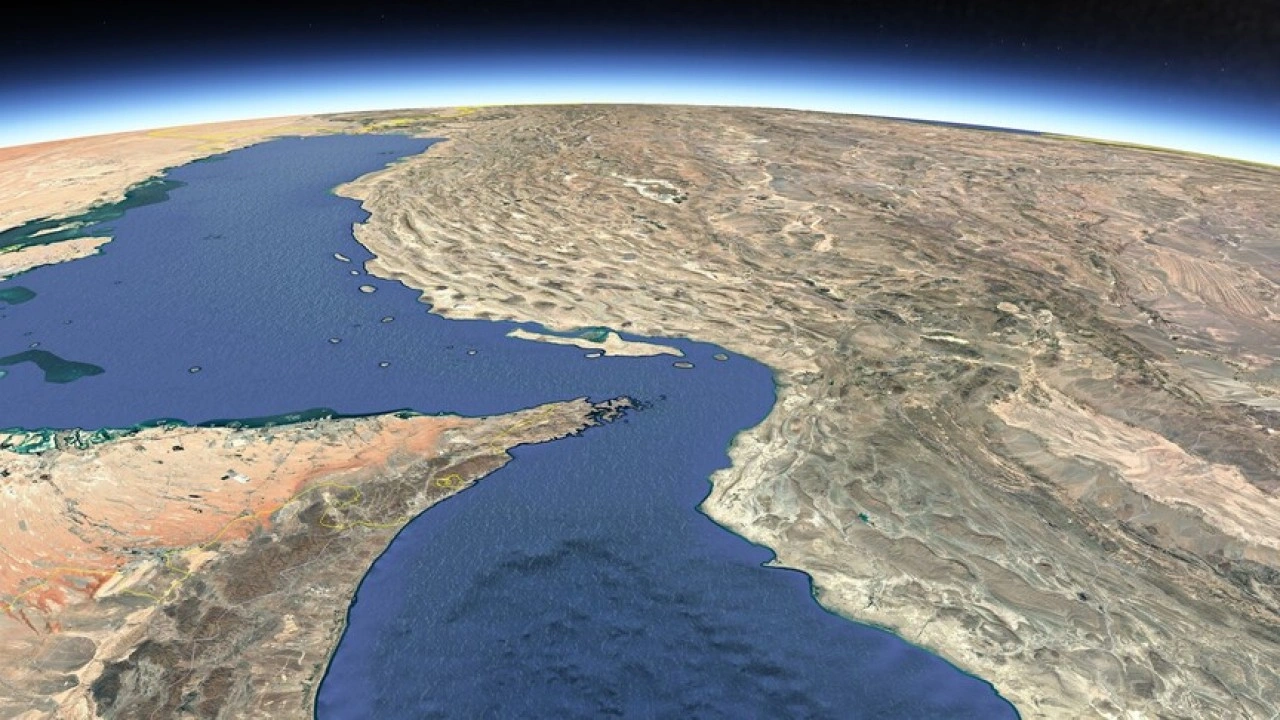
Iran said Wednesday it is in the “final stage” of drafting an agreement with Oman over the Strait of Hormuz, and US President Trump said an announcement could come within days, according to the Associated Press via NBC News. If finalised, the deal would mark the most credible step yet toward restoring normal traffic through a waterway that carries roughly a fifth of the world’s oil and gas supply — and whose disruption has been a defining driver of energy prices and inflation risk through much of 2026.
What the emerging deal actually proposes
According to regional officials briefed on the talks and cited by the Associated Press, the draft arrangement would create separate inbound and outbound shipping lanes: vessels would enter the Persian Gulf through an Iran-controlled route and exit through a route controlled by Oman. Iranian and Omani negotiators have reportedly finalised the draft and are now awaiting sign-off from Iran’s Supreme Leader.
US officials have confirmed active involvement in the process. Secretary of State Marco Rubio said Tuesday that progress had been made though no final agreement was yet in place, while Treasury Secretary Scott Bessent suggested a deal could land within a day or two, based on reporting from Al Jazeera. Iran’s foreign ministry separately described the talks with Oman as “positive.”
The sticking point that could still unravel it
The single biggest obstacle is reciprocity. Regional officials say the emerging agreement is contingent on the United States lifting its blockade of Iranian ports — a condition the Trump administration has previously resisted, having ruled out any arrangement seen as cementing Iranian control over the strait, according to NBC News. Trump himself has kept pressure on Tehran, warning Tuesday night that Iran would “get hit really hard” if it backs out of a deal again, per The Washington Times.
This would not be the first time talks have collapsed close to the finish line. The current negotiation track is explicitly tied to a broader US-Iran agreement reached in June that aimed to end hostilities and reopen the strait but ultimately fell apart, officials told the AP.
Why markets are already moving on the news
Even short of a signed deal, the mere prospect of resolution has been enough to move markets. Oil prices fell below $80 a barrel on optimism around the talks, and US equities posted a historic session Tuesday — the Dow Jones Industrial Average surged more than 900 points to close above 54,000 for the first time, with the S&P 500 also setting a fresh record, according to The Washington Times.
The scale of the disruption being priced out is significant. Before the conflict, an average of 20 million barrels a day moved through Hormuz, accounting for roughly a fifth of global oil supply, according to CNN. Commercial transit has continued at a fraction of that — an estimated 3 to 5 million barrels a day via the limited Omani traffic lane, per shipping analytics firm Marisks, cited in the same CNN report. Saudi Aramco chief executive Amin Nasser estimated global markets are currently losing more than 100 million barrels a week in constrained throughput, and warned that even an immediate reopening would take up to 18 months to fully replenish depleted inventories.
What comes next
A finalised deal would still function as an interim fix rather than a permanent settlement — regional officials briefed on the negotiations described it as a temporary solution designed to de-escalate the immediate standoff and open the door to renewed US-Iran talks on Tehran’s nuclear programme, per NBC News. For markets, that means the reopening — if it happens — is likely to reduce risk premiums without immediately restoring pre-conflict supply volumes, given the months-long replenishment timeline Aramco’s Nasser flagged.
Key takeaways
- Iran and Oman describe a draft deal on Strait of Hormuz shipping lanes as in its “final stage,” pending approval from Iran’s Supreme Leader.
- The proposed structure: ships enter the Gulf via an Iran-controlled lane, exit via an Oman-controlled lane.
- The deal is reportedly contingent on the US lifting its blockade of Iranian ports — the main remaining sticking point.
- Oil fell below $80/barrel and US stocks hit record highs Tuesday on deal optimism.
- Even with a deal, full supply restoration could take up to 18 months, according to Saudi Aramco’s CEO.
FAQs
Has the Strait of Hormuz deal been finalised? As of August 5, 2026, the deal was described as being in its “final stage,” awaiting sign-off from Iran’s Supreme Leader — not yet formally announced.
What would the deal change for shipping? It would establish separate inbound (Iran-controlled) and outbound (Oman-controlled) lanes to allow commercial vessels safe passage through the strait.
Why does the Strait of Hormuz matter for oil prices? Roughly one-fifth of global oil and gas supply historically transited the strait; its disruption has constrained an estimated 100+ million barrels a week from reaching markets, per Saudi Aramco.
Discover more from The Economy
Subscribe to get the latest posts sent to your email.


Thursday, August 6, 2026, is not an ordinary session for SpaceX shareholders. It is the day the company’s first post-IPO lockup period expires, freeing up to roughly 911.5 million insider-held shares — worth close to $123 billion at recent prices — for potential sale on the open market, according to The Motley Fool. To put that in perspective: SpaceX’s entire public float has stood below 280 million shares since its record-breaking June 12 IPO, meaning the unlock could roughly triple the number of tradable shares in a single day.
This is the story competitor outlets are covering as a single-day news event. Few are explaining why the structure of SpaceX’s lockup makes this particular date so unusual — or what it signals about how the company priced risk into its unprecedented listing.
Why this lockup is different from a typical IPO unlock
Most companies use a single 180-day lockup. SpaceX instead built a staggered, performance-linked release schedule tied to its earnings calendar. Insiders became eligible to sell an initial 20% tranche on the second full trading day after the company’s first quarterly earnings report as a public company — which landed on August 4, pushing the unlock date to August 6, per The Motley Fool’s original lockup breakdown.
A bonus 10% tranche would have unlocked early had SPCX traded at least 30% above its $135 IPO price for five of the ten sessions before earnings. That threshold — above $175 — was never reached; the stock has instead spent recent weeks trading near or below its offer price, having fallen more than 40% from the post-IPO high of $225.64 it touched four days after listing, according to StartupHub.ai.
Further pressure is scheduled, not speculative. Additional 7% employee tranches are due around August 21 and September 10, and analysts at 22V Research estimate insiders could collectively be free to sell as much as 44% of total shares by early September — an roughly ninefold increase in the tradable float from where it stood at listing, per Yahoo Finance.
The fundamentals behind the slide
The unlock is landing on a stock that was already under pressure for reasons beyond supply mechanics. SpaceX reported a $4.9 billion net loss for 2025 and lost a further $4.28 billion in the first quarter of 2026, a burn rate that has cooled post-IPO enthusiasm even among investors who back the long-term Starship and Starlink thesis, according to analysis from DayTradingToolkit. Despite posting stronger-than-expected earnings this week, SPCX shares tumbled roughly 14% as the market looked past the results and priced in the incoming supply, based on Bloomberg’s markets desk.
What history suggests happens next
Lockup expirations do not automatically trigger crashes — the actual price impact depends on how much of the newly eligible stock insiders choose to sell, and at what price they’re willing to part with it. Some analysts argue the reaction could be a useful signal in itself: if SPCX absorbs this wave of supply without breaking to fresh lows, that would suggest the market has already priced in the dilution risk, a view echoed by commentary from The Motley Fool’s investing desk. Others counsel patience, arguing the stock’s valuation looks stretched even before accounting for the added float.
For investors weighing an entry point, the practical takeaway is that August 6 is the first of several tests, not the last. The rolling 7% employee releases in late August and September mean supply pressure is likely to recur through the fourth quarter, with the float expected to expand roughly sixfold by late September and to around a third of total shares by Halloween, according to earlier lockup modelling reported by Investing.com.
Key takeaways
- SpaceX’s first lockup expiration frees up to 911.5 million shares (~$123 billion) for potential sale starting August 6, 2026.
- The bonus early-unlock trigger — a 30% share-price premium to the $135 IPO price — was not met, so this is the baseline release, not an accelerated one.
- SPCX has fallen over 40% from its post-IPO peak and briefly traded below its offer price.
- Further 7% tranches are scheduled for late August and mid-September, meaning supply-driven volatility is likely to continue into Q4 2026.
- The stock’s slide reflects both the lockup mechanics and underlying losses of roughly $4.28 billion in Q1 2026 alone.
FAQ
When does SpaceX’s stock lockup expire? The first tranche expired August 6, 2026, two trading days after SpaceX’s first quarterly earnings report as a public company. Additional tranches are scheduled through December 8, 2026.
How many SpaceX shares could be sold? Up to approximately 911.5 million shares — about 20% of eligible insider holdings — became sellable on August 6, against a public float that had been below 280 million shares.
Why did SpaceX stock fall despite strong earnings? Investors appear to be pricing in the incoming supply from the lockup expiration rather than reacting purely to quarterly results, alongside continued losses tied to Starship development costs.
Discover more from The Economy
Subscribe to get the latest posts sent to your email.
Markets & Finance
Russia Oil Revenue 2026: How Sanctions on Rosneft and Lukoil Are Draining the War Chest
Russia’s oil and gas revenue fell 22% in the first eleven months of 2025, and the pressure has only intensified since the United States imposed primary sanctions on Rosneft and Lukoil in October 2025, according to the Atlantic Council’s Russia Sanctions Database. Moscow is now rerouting exports through smaller companies to work around the sanctions, even as its military-industrial base continues expanding — Russia claims to have localized nearly 90% of drone manufacturing.
The discount on Russian crude is widening
The mechanism behind the revenue drop is the widening discount Russian oil must offer to find buyers. Urals crude traded at roughly a 10% discount to global benchmarks through much of 2024 as sanctions normalized, but that discount exceeded 15% in November 2025 after the Rosneft and Lukoil sanctions were announced, and jumped further to around 30% by year-end, according to analysis from the New Eurasian Strategies Centre. Sanctions have not meaningfully reduced the volume of oil Russia exports — production in 2025 was only 2.5% below 2021 levels — but they have reshaped how, and at what price, that oil moves.
How Moscow is compensating
Faced with declining oil revenue, the Kremlin has raised taxes across the board: increasing the income tax burden, lifting VAT from 20% to 22%, raising the profit tax from 20% to 25%, and pushing the profit tax on oil transport to 40%, according to the Atlantic Council database. Russia has also issued $2.8 billion in yuan-denominated bonds to raise financing, while corporate debt has surged 71% since 2022 as businesses absorb the fiscal strain.
Despite the tax increases, Russia’s total federal budget revenue rose only 1.6% year-on-year in ruble terms during 2025, reaching 37.3 trillion rubles ($446 billion), according to the Oxford Institute for Energy Studies. A stronger ruble through the year meant the dollar-value increase was more pronounced than the ruble figures suggest, but that currency strength itself became a fiscal headwind — the same Oxford analysis estimates rouble appreciation alone cost Russia’s oil revenue 0.6% of GDP.
What’s changed since the Rosneft-Lukoil sanctions
The picture has deteriorated further into 2026. Russia’s oil and gas cash flows dwindled to their lowest levels in years by February 2026, pushing Putin to borrow more heavily from domestic banks and raise taxes further just to keep state finances stable, according to Euronews. Analysis from RE-Russia projects that if sanctions pressure holds and oil prices continue falling, Russia’s 2026 oil and gas revenues could see a decline comparable to or exceeding the current downturn, with Urals prices potentially settling in the $40-45 per barrel range, per RE-Russia’s assessment.
The enforcement gap that keeps the war funded
Even so, sanctions remain incomplete. Since the 2022 invasion, EU countries have paid an estimated €220 billion for Russian coal, oil, and gas — roughly 20% of Russia’s total energy earnings during that period — even as the bloc has simultaneously imposed restrictions, according to the International Centre for Defence and Security. That analysis argues Western sanctions enforcement, not sanctions design, remains the binding constraint on their effectiveness.
Discover more from The Economy
Subscribe to get the latest posts sent to your email.
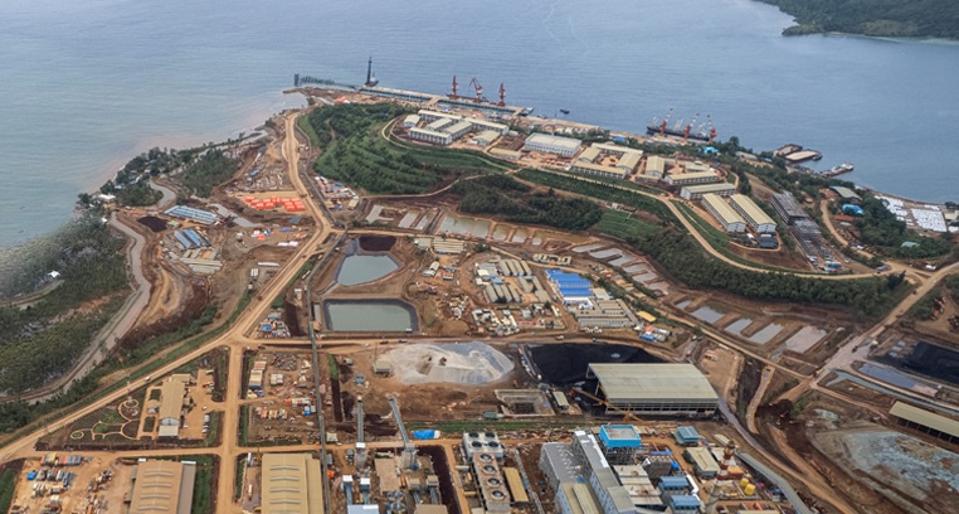
Indonesia is pitching an estimated $121 billion in investment opportunities to build an integrated national EV battery ecosystem, with officials arguing the country is uniquely positioned because four of the six main materials needed for EV batteries are found in abundance domestically, according to ANTARA News coverage of the June 2026 Korea-Indonesia Economic Partnership Forum. The ministry’s long-term downstream strategy could eventually drive total investment to $618 billion, with export value reaching $857 billion and more than 3 million new jobs.
The Policy That Built the Boom
The foundation is a 2020 ban on raw nickel ore exports, designed to force foreign capital into domestic processing rather than allowing Indonesia to remain a raw-material exporter, according to a policy analysis published by CETEX. The strategy has worked at the smelting stage: by 2025, Indonesia had 49 Rotary Kiln Electric Furnace nickel smelters operating domestically, turning raw saprolite ore into nickel pig iron, ferronickel and refined nickel, according to The Jakarta Post. Major automakers have followed the processing capacity: BYD is building a $1.3 billion EV plant targeting 150,000 vehicles annually, Vietnam’s VinFast has committed roughly $1.2 billion for similar capacity, and Chinese firm Huayou has invested $8.8 billion in industrial parks spanning Weda Bay, Morowali and Pomalaa, per Caixin Global reporting cited in the CETEX analysis.
The Chemistry Problem
The risk sits one layer deeper than smelting. According to Asia Times’ contrarian analysis, Indonesia’s downstreaming plan is built almost entirely around nickel-based battery chemistries (NMC and NCA), which offer higher energy density — but the global EV market, especially the mass-market segment, increasingly rewards price over performance. Lithium iron phosphate (LFP) batteries use no nickel or cobalt at all, and the IEA found LFP batteries were roughly 40% cheaper than NMC batteries in 2025. If LFP continues gaining global market share, Indonesia’s core resource advantage becomes structurally less relevant to where the EV industry is actually heading.
Asia Times’ analysis goes further, warning that if Indonesia keeps domestic nickel artificially cheap to support its own battery producers, the country loses part of its resource rent — reserves deplete faster, fiscal revenue falls, environmental costs rise, and the largest economic benefits may ultimately flow to downstream investors and foreign EV producers rather than Indonesia itself.
A Peak Already Passed?
There are signs Indonesia’s own policymakers see the upstream phase maturing. A senior member of Indonesia’s National Economic Council told the DBS Metals & Mining Indonesia Forum that the pace of capital injection into upstream nickel extraction is already settling down, with focus shifting to capitalizing on processing capacity already built, according to Caixin Global. Notably, nickel mining accounted for roughly 9% of downstreaming-sector investment in 2024-2025 while the entire EV ecosystem accounted for just 0.1% of that same investment in 2024, according to the CETEX policy paper — illustrating how early-stage the actual battery and vehicle build-out remains relative to the raw-material processing that preceded it.
The Structural Read
The Lowy Institute frames the overall record as mixed: downstreaming has produced fast, highly concentrated growth in nickel processing and made Indonesia a genuinely significant FDI destination in critical minerals — but the EV industry itself remains immature, with lacklustre domestic adoption and questionable import-substitution assumptions still unresolved as the country pushes toward its next investment wave.
Discover more from The Economy
Subscribe to get the latest posts sent to your email.

Pakistan Economy 2026: Why GDP Growth Isn’t Reaching Ordinary Households

Strait of Hormuz Deal 2026: Iran-Oman Talks, Oil Price Impact & What Happens Next

SpaceX Stock Lockup Expiration Explained: Why $123B in Shares Could Hit the Market

The Taxman Cometh from Beijing

Pakistan IMF Program 2026: Inside the Push Toward an Interest-Free Economy

Russia Oil Revenue 2026: How Sanctions on Rosneft and Lukoil Are Draining the War Chest

Canada US Trade War 2026: Inside Carney’s Push to Cut Ties With Trump’s Tariffs

Rachel Reeves’s £25 Billion Problem: What the Autumn Budget Gap Means for Britain

Inside the Fed’s Most Divided Vote in Years: Why Warsh Held the Line on Rates

Pakistan Passed Its Third IMF Review

The Fed Is Fractured — And a New Chair Just Made It Louder, Not Quieter

The UK Economy in 2026 Is Neither Recession Nor Recovery :Stagflaton

Indonesia’s $121 Billion Nickel Bet Is Facing a Battery Chemistry

Why Ultra-Wealthy Families Are Splitting Between Singapore and Dubai inmarkets 2026

Russia Bans Diesel Exports 2026: Global Fuel Market Impact Explained

Gold Price Forecast 2026: Fed’s July 29 Decision and Record Central Bank Buying Explained

Strait of Hormuz Blockade 2026: Oil Prices Surge 9% as US-Iran Conflict Reignites

Strait of Hormuz 2026: Why Markets Still Don’t Trust It’s Open

Pakistan Economy 2026: GDP Grows 3.7% as IMF Completes EFF Review Amid Middle East Risk

China Politburo July 2026: Stimulus Signals Explained

Down But Not Out: Inside the Slow Sinking of Russia’s War Economy

Gulf Capital Retreat From Pakistan 2026: UAE Loan Freeze & What It Means

Apple vs OpenAI Lawsuit: The Economic Story Behind the Headline

Indonesia Russian Oil Imports 2026: Why Jakarta Is Diversifying Crude Supply

Global Stock Market Selloff 2026: Stagflation Fears Return as Iran Conflict Reignites

The Yuan Now Settles 67% of Russian Oil Payments — Quiet De-Dollarization in Action

AI Capex Bubble 2026: The Hidden $662B Debt Nobody Reports

Pakistan’s Economic Survey FY26: Inflation Spike Insights
-

 Markets & Finance7 months ago
Top 15 Stocks for Investment in 2026 in PSX: Your Complete Guide to Pakistan’s Best Investment Opportunities
-

 Analysis5 months ago
Johor’s Investment Boom: The Hidden Costs Behind Malaysia’s Most Ambitious Economic Surge
-

 Analysis6 months ago
Top 10 Stocks for Investment in PSX for Quick Returns in 2026
-

 Analysis6 months ago
Brazil’s Rare Earth Race: US, EU, and China Compete for Critical Minerals as Tensions Rise
-

 Banks7 months ago
Best Investments in Pakistan 2026: Top 10 Low-Price Shares and Long-Term Picks for the PSX
-

 Investment7 months ago
Top 10 Mutual Fund Managers in Pakistan for Investment in 2026: A Comprehensive Guide for Optimal Returns
-

 Global Economy7 months ago
15 Most Lucrative Sectors for Investment in Pakistan: A 2025 Data-Driven Analysis
-

 Global Economy7 months ago
Pakistan’s Export Goldmine: 10 Game-Changing Markets Where Pakistani Businesses Are Winning Big in 2025