
Markets & Finance
SpaceX’s Record-Breaking IPO Makes Elon Musk the World’s First Trillionaire


SpaceX’s blockbuster stock market debut earlier this month has continued to reverberate through global markets, cementing Elon Musk’s status as the world’s first trillionaire and reshaping the landscape of the world’s most valuable public companies.
A Historic Debut
SpaceX shares, trading under the ticker “SPCX” on the Nasdaq, opened at $150 — above their $135 IPO price — and surged as high as $176.52 before closing the first day up roughly 19% at $160.95, according to CNN Business. The offering raised approximately $75 billion, making it the largest IPO in history, NPR reported, and valued the rocket and satellite company at more than $2 trillion in early trading.
CNBC reported that shares continued climbing in after-hours trading, pushing the company’s market capitalization to roughly $2.2 trillion and briefly making SpaceX the sixth-largest publicly traded company in the United States, ahead of Musk’s other company, Tesla.
Musk’s Stake and Control
Musk’s roughly 40% ownership stake in SpaceX has been valued at around $800 billion in the wake of the listing, NPR reported, a figure that — combined with his Tesla holdings and other assets — pushed his total net worth past the trillion-dollar threshold for the first time for any individual. Notably, Musk retains more than 80% of SpaceX’s voting power, according to NPR, meaning public shareholders will have limited influence over how the company is run despite the broad-based retail demand for shares.
Why Investors Bought In
According to CNBC, Musk said on a livestream ahead of the offering that SpaceX has been cash-flow positive since around 2015 and that the IPO was intended to fund a major growth phase, including plans to deploy over 100,000 satellites and build AI data centers in space. The company’s only currently profitable division is its Starlink satellite internet business, which CNBC noted generated the majority of SpaceX’s $18.67 billion in revenue last year.
Despite the bullish reception, NPR reported that SpaceX’s financial filings show the company lost roughly $5 billion last year and another $4 billion in the first quarter of 2026, with much of that loss tied to the AI division absorbed from Musk’s former company, xAI, which SpaceX acquired in early 2026.
A Hidden Winner: Alphabet
Among the lesser-discussed beneficiaries of the listing is Alphabet, which CNBC reported owns roughly 4.9% of SpaceX — a stake now worth an estimated $105 billion, making it one of Google’s most lucrative private investments ever.
What Comes Next
CNN Business noted that SpaceX’s amended IPO filing flagged the possibility of issuing “significant equity” to fund future transactions, fueling market speculation about a potential future tie-up with Tesla, in which SpaceX already holds a stake stemming from Tesla’s earlier $2 billion investment in xAI.
Discover more from The Economy
Subscribe to get the latest posts sent to your email.


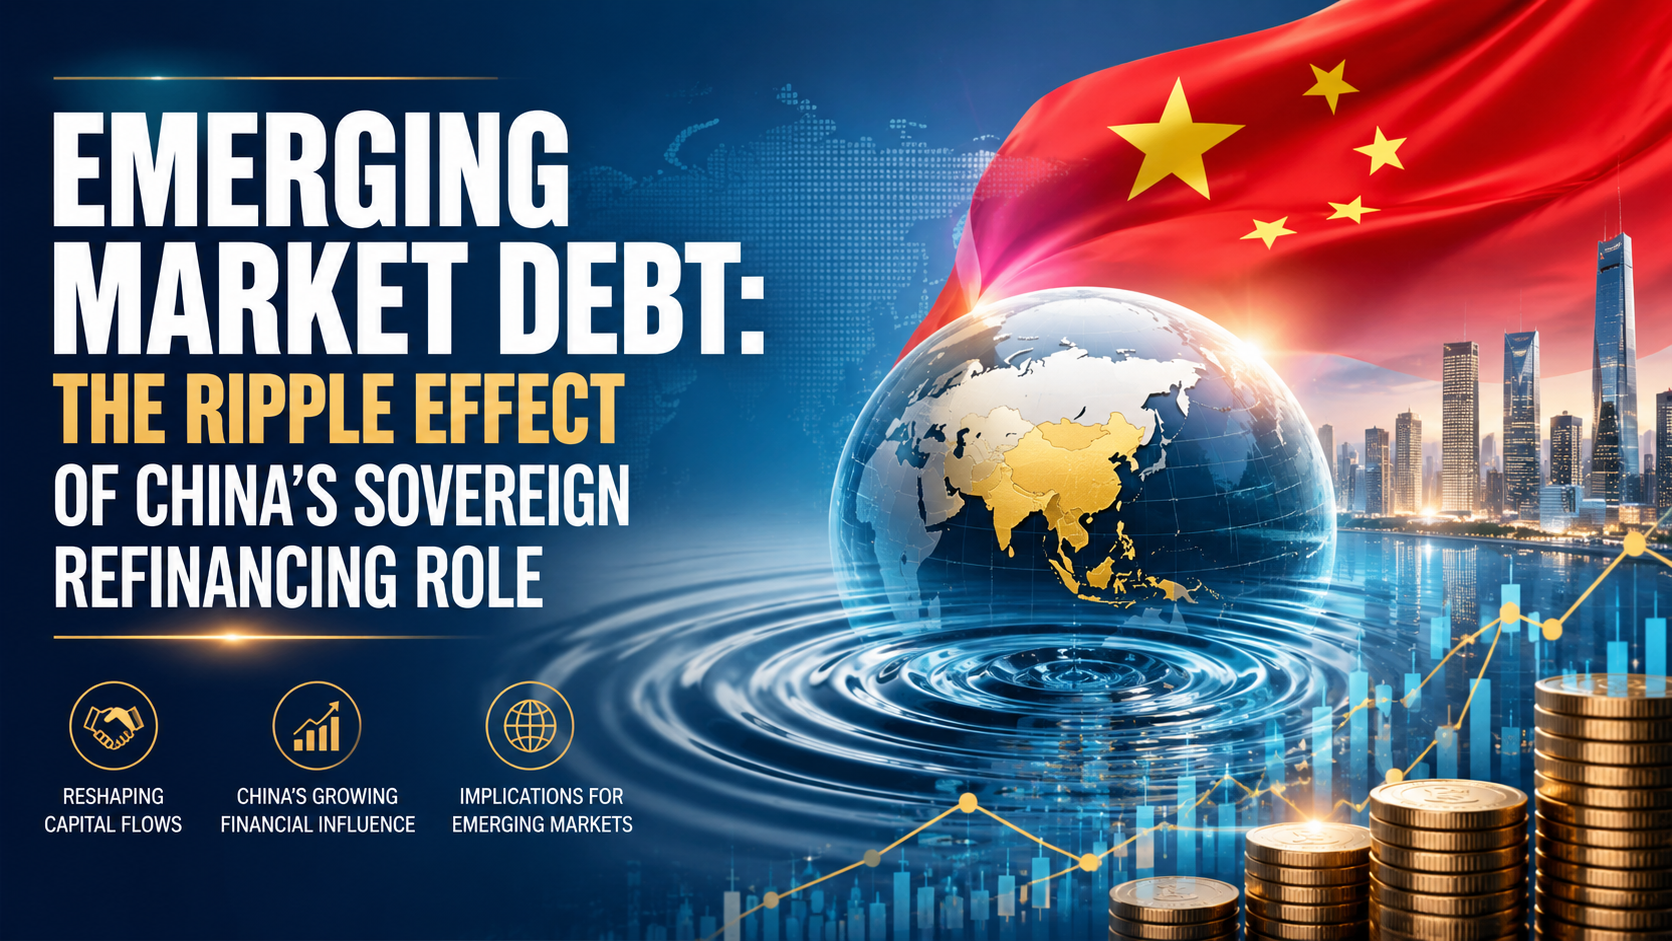
Emerging and developing economies face refinancing needs of more than $9 trillion in 2026, according to the Institute of International Finance’s Global Debt Monitor — the largest wall of maturing sovereign and corporate debt these markets have ever faced simultaneously. At the center of that system sits China, now the single largest issuer of emerging-market sovereign debt and, increasingly, the largest bilateral lender of last resort when smaller economies can’t refinance on their own. For institutional investors and foreign-policy-adjacent business strategists, understanding China’s dual role — dominant issuer and dominant creditor — is now a prerequisite for pricing emerging-market risk correctly.
Editorial note on sourcing: a specific figure describing a discrete “$1.3 billion” China sovereign refinancing transaction could not be independently verified against primary reporting at the time of writing. This article instead builds its analysis on verified, dated figures from the OECD, IIF, Moody’s, and peer-reviewed research, and any deal-level claim should be confirmed against primary sources (finance ministry statements, rating-agency releases) before publication or citation.
China’s Dual Role: Issuer and Creditor of Last Resort
China accounted for 45% of total EMDE sovereign bond issuance in 2024, up sharply from just 17% in the 2007–2014 period, according to the OECD’s Global Debt Report 2025. By 2025, China remained the top borrower among a concentrated group — China, India, Brazil, Egypt, and Argentina together represented 78% of EMDE central-government borrowing, per the OECD’s Global Debt Report 2026.
Domestically, Beijing has simultaneously executed one of the largest local-government debt refinancing programs in history: a 6 trillion yuan (roughly $839 billion) swap of “hidden” local-government debt into standardized bonds, approved in late 2024 and implemented through 2026, according to VOA News. By mid-2026, Chinese provinces had used nearly 94% of that swap allowance, according to Bloomberg.
Internationally, China has also re-entered dollar sovereign bond markets at scale — its 2026 international offering was reported as its largest ever, oversubscribed well beyond target, according to Business Standard/Reuters reporting on the prior comparable issuance. This dual positioning — massive domestic refinancing plus expanding international issuance — gives China outsized influence over EM bond-market liquidity and pricing benchmarks that smaller sovereigns then reference for their own issuance.
The $9 Trillion Wall: Why 2026 Is Different
The scale of what’s coming due matters more than any single deal. Key figures from the IIF’s Global Debt Monitor and OECD’s 2026 report:
- Gross EMDE central-government borrowing crossed $4 trillion in 2025, up from roughly $3 trillion in 2024.
- Around 36% of outstanding EMDE bond stock matures within three years.
- Low-income countries face the sharpest cliff: 52% of their outstanding bonds mature by 2028, with 29% due by the end of 2026 alone.
- Secondary-market yields on maturing debt now exceed 10% for non-investment-grade sovereigns, meaning refinancing at current rates locks in materially higher debt-service costs than the original issuance.
Refinancing Cost Comparison: Then vs. Now
| Issuer Tier | Original Issuance Yield (illustrative range) | 2026 Refinancing Yield | Refinancing Risk |
|---|---|---|---|
| Investment-grade EMDEs (e.g., select Gulf, Southeast Asia sovereigns) | 3–5% | 5–7% | Moderate — absorbable within fiscal space |
| Non-investment-grade EMDEs | 6–8% | 10%+ | High — debt-service costs rising faster than revenue growth |
| Low-income issuers (heavy China bilateral exposure) | Concessional/below-market | Market-rate or restructured terms | Severe — 29% of debt stock matures by end of 2026 |
Source: OECD Global Debt Report 2025/2026 (see citations above); ranges are illustrative of documented tier-level trends, not specific bond issues.
The Restructuring Precedent: What Happens When Refinancing Fails
China’s response to sovereign distress has evolved into a distinct pattern that investors increasingly price into risk premiums. Research published via the National Bureau of Economic Research documents a rising trend of “re-structurings” — repeated restructurings of the same debt with the same creditor — echoing the drawn-out resolution patterns of prior global debt crises. Angola, Ecuador, Seychelles, Sri Lanka, and Venezuela have each undergone two or more restructurings with Chinese state creditors.
Sri Lanka’s case is illustrative of the mechanics: China Development Bank extended a $500 million financing facility in 2020, and a subsequent equity-linked arrangement brought in $1.12 billion in cash that Colombo used to repay non-Chinese creditors, according to Oxford Academic’s International Affairs journal. These bilateral bridge arrangements illustrate how China’s rescue lending functions as a parallel track to traditional Paris Club-style restructuring — often faster to arrange, but less transparent to third-party bondholders pricing the same sovereign’s risk.
Regional Ripple Effects: Where Investors Should Watch Closely
Direct Exposure Zones
- Sub-Saharan Africa: Heaviest concentration of low-income issuers facing near-term maturity walls and prior China restructuring history (Angola, Zambia).
- South Asia: Sri Lanka’s precedent shapes how markets price Pakistan and Bangladesh refinancing risk.
- Latin America: Ecuador and Venezuela carry documented repeat-restructuring histories; Argentina remains among the top-five EMDE borrowers by volume.
Indirect / Second-Order Exposure
- Gulf and Southeast Asian investment-grade sovereigns face rising benchmark yields even without direct restructuring risk, simply because China’s issuance volume moves the EM bond-pricing benchmark broadly.
- Enterprise B2B lenders and trade-finance providers operating in these corridors should treat sovereign-refinancing stress as a leading indicator of counterparty and currency risk, not a lagging one.
An Investor Risk-Monitoring Framework
- Track maturity-wall concentration, not headline debt-to-GDP. A country with moderate debt-to-GDP but a heavy 2026–2028 maturity cliff carries more near-term risk than a higher-leverage country with a smoothed maturity profile.
- Distinguish China’s domestic refinancing (yuan-denominated, largely contained) from its role as an external EM creditor (dollar/foreign-currency exposure, higher spillover risk).
- Watch for repeat-restructuring signals. Countries with a prior China restructuring are statistically more likely to require another, per the NBER research above — treat this as a standing risk flag, not a one-time resolved event.
- Monitor secondary-market yield spreads on maturing debt versus issuance-year yields as the clearest real-time signal of refinancing stress building in a specific sovereign.
The Bottom Line
China’s simultaneous role as the largest domestic debt-refinancer in EM history and the most influential external creditor to distressed sovereigns makes it the single most important variable in the 2026 emerging-market debt outlook. The $9 trillion refinancing wall isn’t a uniform risk — it’s concentrated in low-income issuers with the heaviest prior China bilateral exposure, and that concentration is exactly where enterprise investors, trade-finance providers, and sovereign-risk analysts should be focusing due diligence through the remainder of 2026.
Discover more from The Economy
Subscribe to get the latest posts sent to your email.

Gold traded above $4,500 an ounce in mid-to-late August 2026, marking a third consecutive weekly gain, while oil continued to soften on oversupply signals — a divergence that, on the surface, looks contradictory, according to Trading Economics. It isn’t. The two moves are mechanically linked, and understanding that link is the difference between reactive trading and a genuine safe-haven strategy for Q3 and Q4 2026.
The Transmission Mechanism: Why Oil and Gold Are Moving in Opposite Directions
The connection runs through three steps, as explained by GoldSilver’s August 2026 market analysis:
- Cheaper oil reduces energy-driven inflation. When crude prices fall, headline inflation pressure eases.
- Lower inflation reduces the urgency for Federal Reserve rate hikes. Markets reprice the probability of tightening downward.
- Falling rate-hike expectations ease real yields, and gold — which pays no yield — becomes comparatively more attractive against Treasuries.
This is precisely what played out after a de-escalation in US-Iran tensions in early August 2026: Brent crude fell more than 5% to roughly $83 a barrel and West Texas Intermediate dropped over 6% to around $79, while gold moved higher in response, per GoldSilver’s reporting. OPEC+’s approval of a September production increase of 188,000 barrels per day added further downward pressure on crude.
Gold’s Round-Trip Year: The Chart Most Coverage Misses
Most single-day commodity coverage misses the full-year arc. Gold’s 2026 story is a round-trip, not a straight line, according to drawpie.com’s August 2026 price analysis:
| Date | Event | Approx. Gold Price |
|---|---|---|
| Jan 29, 2026 | Record close | $5,318/oz |
| Jan 28, 2026 (intraday) | All-time intraday record | ~$5,589/oz |
| Late Jan 2026 | Single-session correction | -11.4% (largest single-day drop of the year) |
| Jul 16, 2026 | Cycle low after 5-month grind | $3,986/oz |
| Aug 5, 2026 | Sharp single-day rally | +3.7% |
| Mid-Aug 2026 | Third consecutive weekly gain | Above $4,500/oz |
Despite the record-high headlines in January and the correction headlines that followed, gold spent most of 2026 essentially flat to slightly below where it started the year before this August rally, per drawpie.com — a fact that gets lost in both the bullish and bearish framing competitors reach for.
Who’s Actually Buying: The Central Bank Signal
Retail and ETF flows have been volatile — US-listed gold ETFs saw roughly $5.3 billion in monthly redemptions during the summer correction, according to Yahoo Finance’s gold prediction coverage — but the more telling signal for institutional allocators is central bank demand. Central banks purchased a record 289 tonnes of gold in Q2 2026 alone, a 74% year-on-year jump, according to the World Gold Council’s Gold Demand Trends report cited by GoldSilver. A World Gold Council survey found 45% of central banks plan to add further to reserves, per Yahoo Finance — a structural demand floor that retail sentiment swings don’t erase.
Key Drivers to Watch Through Q4 2026
- Federal Reserve rate decisions: Markets have oscillated between pricing a hold and a hike at recent FOMC meetings; each print reprices real yields and gold in tandem.
- US-Iran and broader Middle East developments: Any escalation reverses the oil-down/gold-up dynamic described above.
- OPEC+ supply decisions: Additional production increases extend the oversupply narrative pressuring crude.
- US Treasury debt-management moves: A Treasury announcement to expand long-term debt buybacks reportedly drove a same-day gold jump of more than 4%, per Trading Economics, by pulling yields and the dollar lower.
A Safe-Haven Allocation Framework for Q3–Q4 2026
Wealth managers structuring client portfolios around this divergence should think in tiers rather than a single “buy gold” call:
- Core hedge (all risk profiles): A strategic 5–10% allocation to physical gold or gold-backed ETFs as a permanent inflation and currency hedge, independent of short-term price swings.
- Tactical overlay (active/balanced portfolios): Incremental additions timed around Fed meeting cycles and geopolitical flashpoints, using the transmission mechanism above as the entry signal rather than headline price alone.
- Energy underweight (Q3 2026 specific): Given the OPEC+ supply increase and de-escalation dynamics, tactical underweight positioning in pure upstream energy exposure, offset by overweight in refiners or energy-adjacent infrastructure less sensitive to crude-price direction.
- Silver as a levered gold proxy: Silver has moved even more sharply than gold in both directions in 2026 and remains in a structural, multi-year supply deficit, per GoldSilver — appropriate for investors with higher volatility tolerance seeking amplified safe-haven exposure.
The Bottom Line
The oil-gold divergence of Q3 2026 is not two unrelated commodity stories — it is one macro trade expressed through two assets connected by inflation expectations and Fed policy. Investors who treat gold and oil as separate headlines will consistently misread the signal; those who track the three-step transmission mechanism will be positioned ahead of the next Fed-driven repricing.
Discover more from The Economy
Subscribe to get the latest posts sent to your email.

Since ChatGPT’s late-2022 launch, AI-linked equities have driven roughly three-quarters of total S&P 500 returns, according to JPMorgan Asset Management research cited by Yahoo Finance. By August 2026, that concentration has only intensified — and it has split the investment community into two camps: those who see a durable capital-expenditure supercycle, and those who see the early innings of a correction. For portfolio managers and high-net-worth individuals, the question is no longer whether to hold AI exposure, but how much, where, and for how long.
This piece cuts through the noise with a structured allocation framework, a historical benchmark against the dot-com era, and a clear-eyed look at the warning signs serious investors are watching heading into Q4 2026.
The State of Play: Where the Money Is Flowing
The AI infrastructure buildout remains the dominant story of 2026. Nvidia has reportedly built a confirmed order pipeline extending through 2027, while AMD’s earnings trajectory has accelerated sharply on the back of data-center demand, per Intellectia AI’s August 2026 market analysis. Hyperscalers — Microsoft, Amazon, Alphabet, and Meta — continue to pour hundreds of billions of dollars into chips and data-center capacity, a spending pattern that has become self-reinforcing: higher capex commitments support chipmaker revenue, which in turn justifies further capex.
Sector performance reflects this. AI-linked names have outpaced broader indices by more than 45 percentage points year-to-date, according to Intellectia AI’s market impact report, with data-center hardware spending growing at an annualized rate above 80%.
Where High-CPC Capital Is Concentrating
- Compute infrastructure: GPU and custom-silicon manufacturers capturing hyperscaler capex
- Cloud/AI software integration: Enterprise B2B platforms embedding generative AI into existing SaaS stacks
- Power and grid capacity: Utilities and energy infrastructure serving data-center demand
- AI-native applications: Vertical software companies building proprietary models on top of foundation models
The Bear Case: Why Serious Investors Are Hedging
Skepticism is no longer a fringe position. In January 2026, Bridgewater founder Ray Dalio warned that the AI boom had entered “the early stages of a bubble,” a comment made in a year-end retrospective covered by Fortune. That warning gained teeth after an MIT study found that 95% of enterprise generative-AI pilot projects failed to produce a measurable return on investment, a finding Yahoo Finance flagged as a genuine warning sign for equity valuations built on future monetization rather than current cash flow.
The distinction that matters for allocators, per Intellectia AI’s bubble analysis, is between companies with confirmed order backlogs and expanding margins (structurally sound) and companies whose valuations rest on unrealized future monetization (bubble-exposed). Sorting portfolio holdings into these two buckets is the single highest-leverage exercise an investor can do this quarter.
2026 AI Cycle vs. the Dot-Com Era: A Structural Comparison
| Metric | Dot-Com Era (1999–2000) | 2026 AI Cycle |
|---|---|---|
| Primary capex driver | Speculative internet buildout, thin revenue | Hyperscaler capex backed by existing cloud/enterprise revenue |
| Revenue-to-valuation link | Often absent (pre-revenue IPOs) | Present for leaders (Nvidia order backlog through 2027); absent for some infrastructure plays |
| Concentration of gains | Broad-based internet basket | Narrow — chips, hyperscalers, select software |
| Documented failure rate | High (dot-com bust wiped out most listings) | 95% of enterprise GenAI pilots fail to show ROI, per MIT/Yahoo Finance |
| Institutional warning signals | Present late-cycle | Present now (Dalio, Altman self-caution) |
Sources: Yahoo Finance, Fortune, Intellectia AI — see citations above.
A Risk-Based Allocation Framework
Rather than a single “buy AI stocks” recommendation, high-CPM advisory content should give investors a framework calibrated to their risk tolerance:
- Conservative allocators (capital preservation priority): Cap direct AI-thematic exposure at 5–8% of equity allocation, concentrated in cash-flow-positive infrastructure leaders rather than pre-revenue application-layer names.
- Balanced/growth allocators: 10–15% thematic exposure, split between compute infrastructure and diversified AI-focused ETFs to reduce single-stock concentration risk.
- Aggressive/tactical allocators: Up to 20–25%, with explicit position-sizing rules and a pre-committed exit discipline tied to order-backlog deterioration or margin compression — not price alone.
Due-Diligence Checklist Before Adding Exposure
- Does the company have a contracted, not merely projected, revenue backlog?
- Is capex growth matched by margin expansion, or is it diluting returns on invested capital?
- What percentage of reported “AI revenue” is genuinely incremental versus reclassified existing cloud spend?
- How concentrated is the position relative to total portfolio beta?
Geographic and Currency Considerations
International diversification adds a layer of complexity high-net-worth investors can’t ignore. Currency exposure can offset local-market AI gains, and emerging-market AI plays carry additional governance and accounting-standard risk that requires separate due diligence, as Intellectia AI’s analysis notes. Investors targeting UAE, Singapore, or broader Asia-Pacific AI exposure should treat regulatory environment and corporate governance standards as a distinct risk factor, not an afterthought bolted onto a US-centric thesis.
The Bottom Line for Q4 2026
The AI stock frenzy is not a binary bubble-or-boom proposition — it is a bifurcated market where infrastructure leaders with contracted revenue are behaving structurally soundly, while a meaningful subset of application-layer and pre-revenue names carry genuine bubble characteristics. The disciplined approach for 2026 is position sizing by conviction tier, not blanket thematic exposure. Investors who treat “AI stocks” as a single monolithic trade — rather than a spectrum from contracted-backlog infrastructure to speculative application software — are the ones most exposed if sentiment turns.
Discover more from The Economy
Subscribe to get the latest posts sent to your email.

Luxury Wellness: The Monetization and Expansion of Boutique Low-Impact Training

Leveraging Viral AI & Climate Hashtags for Brand Growth on X

The Medicaid Churn: Front-End Revenue Cycle Risks for Enterprise Hospitals

The 2026 Crypto Regulatory Shift: What It Means for Institutional Investors

AI-Powered Training: The Next Multi-Billion Dollar Ecosystem in Fitness

BRICS Summit 2026: Economic Implications of the India-China Diplomatic Thaw

Emerging Market Debt: The Ripple Effect of China’s Sovereign Refinancing Role

Dropping Oil & Surging Gold: Navigating Safe-Haven Investments in Q3

2026 AI Stock Frenzy: How to Position Your Portfolio

The AI Disruption in Financial Risk Management: Moving Beyond Record Banking Profits

The Rise of Green Aviation: Balancing High Fuel Prices with Sustainable Infrastructure

US-China Relations in Q3 2026: Trade Tariffs and Supply Chain Risks

Emerging Markets Rebound: Top Stock Strategies for the Gulf and South Asia

Tackling the 2026 Global Food Crisis: Policy Shifts and Market Speculation

China Politburo July 2026: Stimulus Signals Explained

State Farm’s $5B Dividend 2026: Who Qualifies & Payout Dates

Russia Fuel Shortages 2026: Inside a Cracking War Economy

Top 15 Financial Stocks for Investment in PSX

Pakistan Passed Its Third IMF Review

SpaceX Stock Lockup Expiration Explained: Why $123B in Shares Could Hit the Market

Pakistan IMF Program 2026: Inside the Push Toward an Interest-Free Economy

Russia Oil Revenue 2026: How Sanctions on Rosneft and Lukoil Are Draining the War Chest

Andy Burnham, UK Gilts and Mortgages: July 2026 Explainer

Gold Price 2026: Why Bullion Has Fallen 25% From Its January Record High

Pakistan’s 2026 Monsoon Floods Threaten Fragile Economic Recovery as Inflation Nears 9%

Russia Oil Revenue 2026: The Iran War Windfall and What a Hormuz Deal Means for Moscow

Canada US Trade War 2026: Inside Carney’s Push to Cut Ties With Trump’s Tariffs

Russia’s Budget Deficit Blew Past Its Full-Year Target in Three Months
-

 Markets & Finance8 months ago
Top 15 Stocks for Investment in 2026 in PSX: Your Complete Guide to Pakistan’s Best Investment Opportunities
-

 Analysis6 months ago
Johor’s Investment Boom: The Hidden Costs Behind Malaysia’s Most Ambitious Economic Surge
-

 Analysis6 months ago
Top 10 Stocks for Investment in PSX for Quick Returns in 2026
-

 Analysis7 months ago
Brazil’s Rare Earth Race: US, EU, and China Compete for Critical Minerals as Tensions Rise
-

 Banks7 months ago
Best Investments in Pakistan 2026: Top 10 Low-Price Shares and Long-Term Picks for the PSX
-

 Investment8 months ago
Top 10 Mutual Fund Managers in Pakistan for Investment in 2026: A Comprehensive Guide for Optimal Returns
-

 Global Economy8 months ago
15 Most Lucrative Sectors for Investment in Pakistan: A 2025 Data-Driven Analysis
-

 Global Economy8 months ago
Pakistan’s Export Goldmine: 10 Game-Changing Markets Where Pakistani Businesses Are Winning Big in 2025