
Global Economy
Southeast Asia’s Export Boom Hides an Uncomfortable Truth About Economic Growth
In September 2025, ASEAN’s goods exports to the United States surged 23% compared to the same period in 2024, representing an extraordinary $70 billion in additional annualized exports. Factory floors across Vietnam, Malaysia, and Thailand hum with unprecedented activity. Shipping containers stack higher at ports from Jakarta to Bangkok. By virtually every traditional metric, Southeast Asia appears to be the undisputed winner of the US-China trade war.
Yet walk through the residential neighborhoods surrounding these booming industrial parks, and a different story emerges. Vietnamese garment workers still rely on 80 overtime hours monthly just to earn $400—barely more than they made five years ago. Malaysian semiconductor assemblers package cutting-edge chips but have no pathway to becoming chip designers. Thai automotive workers watch Chinese electric vehicle factories rise around them while wondering if they’ll still have jobs in a decade.
This is ASEAN’s trade war paradox: massive export growth delivering surprisingly little genuine development. The region’s 680 million people find themselves caught in an economic illusion where rising trade numbers mask stagnating wages, limited technology transfer, and deepening dependence on foreign-controlled supply chains. What looks like industrial transformation is actually revealing itself as something far more troubling—a potential dead-end that could trap Southeast Asia in permanent middle-income status.
When Winning Feels Like Losing: ASEAN’s Deceptive Export Surge
The headline numbers tell a seductive story. Vietnam’s exports to the United States stood at $142.48 billion in 2024, making it ASEAN’s largest exporter to America, while collectively, ASEAN’s 10-member countries exported $358.56 billion worth of goods to the United States, representing 10.67% of total US imports. These figures represent extraordinary growth from just eight years ago when the trade war began.
Look closer at what’s actually being exported, and the picture becomes more complicated. Electrical machinery and equipment tops the category of goods exported by ASEAN to the United States, followed by industrial machinery and mechanical appliances. These sound impressive—high-tech products suggesting sophisticated manufacturing capabilities. The reality is more sobering.
Consider Vietnam’s electronics exports, which saw computers and electronics increase by roughly 78% to over $34 billion in just the first ten months of 2025. Yet official Vietnamese government data reveals that foreign-owned enterprises account for an astounding 75.9% of the country’s total exports. This isn’t Vietnamese companies building global competitiveness—it’s foreign corporations using Vietnamese labor to assemble products designed, engineered, and mostly sourced elsewhere.
The distinction between “made in” and “made by” Southeast Asia has never mattered more. An iPhone assembled in Vietnam generates impressive export statistics, but when Apple captures the lion’s share of value, Samsung provides the display, TSMC makes the processor, and Chinese suppliers furnish most components, what exactly does Vietnam gain besides wages for assembly workers?
Here’s where ASEAN trade war benefits diverge sharply from genuine industrial development. Malaysia faces US tariff rates officially listed at 19%, yet its effective US tariff rate stands at only 11%, compared to 0.6% in 2024. This relatively modest increase explains why exports keep growing. But the products Malaysia assembles—semiconductor packages, electronic components, machinery parts—require imported intermediate goods worth far more than the value Malaysia adds through local processing.
The same pattern replicates across Southeast Asia. Thailand’s manufacturing boom centers on automotive and electronics assembly. Indonesia leverages natural resources while struggling to move into genuine manufacturing. Cambodia and Vietnam specialize in garments and low-end assembly. All generate impressive export volumes. None are building the deep technological capabilities that historically separated countries that became rich from those that stayed middle-income.
Trade diversion effects on ASEAN economies amplify this disconnect between growth and development. When a Chinese manufacturer relocates final assembly to avoid US tariffs, ASEAN countries gain jobs and export statistics. They don’t gain the research labs, design studios, advanced component production, or systems integration expertise that China has spent three decades building. The value-added—the portion of production that actually enriches the domestic economy—remains stubbornly low.
The China Shadow: How Beijing Still Controls Southeast Asia’s Export Machine
Here’s the statistic that ASEAN governments would prefer to ignore: imports of Chinese goods to ASEAN were around 30% higher in September 2025 than the same period the previous year—a surge equivalent to almost $150 billion when annualized. This flood of Chinese imports isn’t coincidence. It’s the invisible reality behind ASEAN’s visible export success.
The mechanics of China trade diversion reveal an uncomfortable truth about Southeast Asia supply chains. Chinese companies facing punitive US tariffs have executed a masterful geographic arbitrage. Components manufactured in China—often 60-80% of a finished product’s value—flow into ASEAN countries. Workers perform final assembly, attach a “Made in Vietnam” or “Made in Malaysia” label, and ship the product to America. The export statistics credit Southeast Asia. The value capture remains firmly in China.
Over the last decade, China accounted for 21% of all new project investment in Southeast Asia, up from just 13% in the decade before 2015. This Chinese foreign direct investment ASEAN received isn’t altruistic development assistance. It’s strategic repositioning to bypass US tariffs while maintaining Chinese control over technology, supply chains, and profits.
The Vietnam manufacturing boom illustrates this dynamic. Samsung employs hundreds of thousands of Vietnamese workers in massive electronics facilities. Yet Samsung Vietnam functions primarily as an assembly platform. The sophisticated components—displays, processors, memory chips, camera modules—arrive from Korea, Japan, Taiwan, and increasingly China. Vietnamese suppliers provide packaging materials, basic plastics, and logistics support. The technology remains imported; the knowledge stays elsewhere.
Chinese companies have proven even more reluctant to transfer genuine capabilities. A Chinese solar panel manufacturer relocating to Thailand will build the factory, install Chinese equipment, employ Thai workers for basic tasks, but keep product design, process engineering, and quality control firmly under Chinese management. The promised spillover benefits—where local firms learn from foreign investors and eventually compete—largely fail to materialize.
US customs officials increasingly recognize this pattern. Vietnam faced calculated duty revenue of $11.81 billion over the 12 months through September 2025, with average applied duty rates of 6.55%—rates creeping upward as Washington scrutinizes trade circumvention. ASEAN countries find themselves walking a tightrope: attract enough Chinese investment to maintain export growth, but not so much that America starts treating them as China’s proxies.
The geopolitical dimension adds another layer of complexity. In May 2025, China and ASEAN wrapped up negotiations to upgrade their free trade agreement, expanding it to cover the digital economy, green industries, and other emerging sectors. This ASEAN-China trade relations deepening occurs as Washington demands Southeast Asian countries choose sides in what increasingly looks like a new Cold War.
The hidden costs of ASEAN export growth become clear: every dollar of exports to America requires two dollars of imports from China. The trade surplus with the United States masks a far larger trade deficit with China. ASEAN countries have become, in effect, processing platforms for Chinese manufacturing—earning assembly wages while China captures design, component production, and systems integration profits.
The Wage Trap: When Export Booms Don’t Translate to Worker Prosperity
Behind every export statistic is a human story, and in Southeast Asia, those stories reveal how little prosperity the trade war windfall has actually delivered. Vietnamese garment workers provide a stark example. Survey data shows workers must work overtime every day with about 80 overtime hours per month just to reach average income over $385, while basic salaries remain only slightly above regional minimum wage, and industry wage growth reaches only 3.3% annually—insufficient to offset inflation.
This isn’t what economic development is supposed to look like. When countries industrialize successfully, wages rise substantially as workers move from low-productivity agriculture into higher-productivity manufacturing. Japan, South Korea, and Taiwan all saw dramatic wage increases during their industrial transformation. ASEAN’s experience differs dramatically.
Official statistics paint a misleadingly optimistic picture. Vietnam’s national average monthly income reached about VND 8.3 million (US$317) by mid-2025, suggesting reasonable wage growth. Dig into the details, and problems emerge. Real wage growth of nearly 3% during the first three quarters of 2024 barely exceeds inflation, meaning purchasing power improvement remains minimal. More troublingly, wage growth concentrates in urban centers and foreign-owned enterprises, leaving vast swaths of the workforce behind.
The geographic wage gap tells part of the story. Urban workers in Vietnam earned an average VND 10.4 million (US$397) per month in 2025, compared to just VND 8.4 million (US$321) in rural areas, resulting in a wage gap of roughly 24%. But the foreign-versus-domestic gap matters more for understanding ASEAN’s development challenge. Foreign-invested enterprises typically pay 10-15% more than local companies, creating a dual economy where working for a foreign factory offers significantly better prospects than working for a domestic firm.
Why aren’t wages rising faster given booming exports and ostensibly tight labor markets? The answer reveals why ASEAN exports to the US are increasing without delivering proportionate development benefits. First, the work being performed remains relatively low-skill assembly that can be easily relocated if wages rise too much. Second, automation increasingly threatens even these jobs, putting downward pressure on wage demands. Third, workers lack bargaining power—union organization remains weak across most of ASEAN, leaving workers competing individually rather than collectively negotiating better terms.
Consider the broader economic complexity perspective. Malaysia, Thailand, Indonesia and the Philippines are defined by the World Bank as countries that failed to overcome the “middle income trap,” entering middle-income status in the late 1970s and early 1980s. Four decades later, these countries haven’t escaped despite hosting substantial manufacturing sectors. The explanation lies in what kind of manufacturing they’re doing.
Assembly platforms don’t build innovation capacity. Workers bolt together components manufactured elsewhere. They follow processes designed elsewhere. They produce to specifications created elsewhere. Yes, they gain employment and income above subsistence agriculture. But they don’t acquire the technical knowledge, problem-solving skills, or innovative capabilities that drive sustained wage growth and economic upgrading.
The comparison with electronics workers versus garment workers illustrates the stratification within ASEAN manufacturing. Vietnamese electronics workers might earn $482 monthly while garment workers earn $400, but both remain trapped in a wage band that barely supports middle-class existence. Living wages for Vietnamese garment workers should reach approximately $500 per month—$60 higher than current average income, according to calculations by the Asia Floor Wage Alliance. The gap between survival wages and living wages—incomes that support education, healthcare, and genuine upward mobility—persists despite export booms.
Here’s the deeper structural problem: ASEAN countries need wage growth to build domestic consumer markets, which in turn drive service sector development and create incentives for domestic companies to innovate. But keeping wages low remains the primary competitive advantage attracting foreign investment in the first place. This catch-22 is precisely what the middle-income trap describes—countries get stuck because the strategies that worked to escape poverty don’t work to achieve prosperity.
Between Empires: The Geopolitical Bind Choking ASEAN’s Options
Economic logic suggests ASEAN should deepen integration with China—their largest trading partner, largest investor, and geographic neighbor. Security concerns and political pressure demand closer alignment with the United States. This contradiction has become ASEAN’s defining strategic dilemma, and it’s squeezing their economic options with increasing force.
The numbers illustrate the bind. China-ASEAN trade patterns show deep interdependence built over decades. In early 2025, ASEAN surpassed all other regions to become China’s largest trading partner, with bilateral trade reaching around $420 billion in just five months. This isn’t just trade volume—it represents integration into supply chains, investment relationships, and technology dependencies that can’t be quickly unwound.
Meanwhile, the United States remains ASEAN’s second-largest export market and most important security partner for maritime Southeast Asian nations increasingly concerned about Chinese territorial assertions. The US Indo-Pacific Economic Framework promised an alternative to Chinese economic dominance, but has delivered disappointingly little for ASEAN countries seeking tangible benefits like market access improvements.
Individual ASEAN members face distinct versions of this dilemma. The Philippines under President Marcos Jr. has pivoted toward closer US security cooperation, sharpening Manila’s stance on South China Sea disputes. This shift carries economic risks—potential Chinese investment curtailment, restricted access to Chinese markets, and Beijing’s documented willingness to deploy economic pressure for political ends. Yet accepting Chinese territorial claims proves equally unpalatable for a nation watching foreign vessels operate in waters it considers sovereign territory.
Cambodia represents the opposite extreme, maintaining exceptionally close Chinese ties that bring infrastructure investment and economic support. The trade-off? Cambodia faces US tariff rates up to 49%, reflecting in part America’s concern about Cambodian economic dependence on China, which provides over 40% of Cambodia’s FDI. When Beijing and Washington issue contradictory demands, Phnom Penh faces impossible choices.
Vietnam navigates perhaps the most complex balancing act. Historical tensions with China combine with current territorial disputes, yet economic integration runs deep. Hanoi simultaneously courts US investment and security cooperation while trying to avoid antagonizing its powerful northern neighbor. This hedging strategy—attempting to benefit from both relationships while committing fully to neither—grows increasingly difficult as both powers demand clearer alignment.
The tariff environment exemplifies ASEAN’s shrinking room to maneuver. By October 2025, the effective US tariff rate on China had jumped to 31%, reflecting maintenance of the 10% baseline reciprocal tariff plus 10% “fentanyl” tariffs on all Chinese imports, as well as global sectoral tariffs of 25-50% on steel, aluminum, copper, timber, and automotives. ASEAN countries benefit from lower rates, but only conditionally—Washington watches closely for Chinese circumvention and won’t hesitate to impose punitive measures if it perceives Southeast Asia becoming China’s back door to American markets.
This creates a perverse dynamic where ASEAN countries can’t pursue economically optimal strategies because political constraints limit their options. They can’t fully integrate with China despite clear economic logic, nor can they pivot entirely to Western-led frameworks offering less tangible value. The US-China decoupling impact on Southeast Asia manifests not just in trade flows, but in paralyzed policymaking where countries can’t commit to long-term strategies because geopolitical winds might shift unpredictably.
The broader institutional implications matter enormously. ASEAN unity—always more aspirational than actual—fractures further under superpower pressure. The bloc’s joint statement in April rejected retaliation to US tariffs, opting instead for dialogue and reaffirming multilateralism. But unity in rhetoric disguises divergence in practice. Vietnam pursues frameworks with Washington while deepening production ties with China. Thailand courts Chinese EV investment while maintaining US security cooperation. Indonesia asserts resource nationalism complicating both relationships.
What gets lost in this geopolitical squeeze? The economic policy space to pursue genuine development strategies. Countries that successfully escaped middle-income status—South Korea, Taiwan, Singapore—had clear strategic focus and could implement coherent industrial policies over decades. ASEAN members today lack that luxury, constantly adjusting to external pressures rather than executing domestic development visions.
The Development Illusion: Why Growth Doesn’t Equal Progress
Economic growth and economic development aren’t synonyms, though they’re often treated as such. ASEAN’s trade war experience starkly illustrates the difference. GDP rises. Export volumes surge. Factory employment expands. Yet the fundamental transformation that characterizes genuine development—building productive capabilities, advancing up value chains, creating innovation ecosystems—remains frustratingly elusive.
According to the World Bank, it would be a ‘miracle’ if today’s middle-income economies like Indonesia and Vietnam could accomplish in 50 years what South Korea achieved in just 25. This isn’t mere pessimism—it reflects how different contemporary conditions are from the environment where East Asian Tigers industrialized. Those countries benefited from stable geopolitics, patient capital, technology transfer from friendly Western powers, and crucially, the ability to protect infant industries while building capabilities.
ASEAN countries today face a far harsher environment. Global supply chains demand immediate competitiveness. Intellectual property protections prevent the technology copying that helped earlier developers. Geopolitical tensions create uncertainty that deters long-term investment. And the work itself increasingly involves narrower tasks optimized for global value chains rather than building complete industrial ecosystems.
The economic complexity measurements capture this stagnation quantitatively. The major ASEAN economies are generally well diversified, though with varying degrees of economic complexity, led by Singapore, with countries on the lower end typically having relatively lower levels for education and labor productivity. What matters isn’t just diversity but sophistication—can countries produce complex products requiring diverse, specialized knowledge?
Vietnam exemplifies the challenge. Exports surge impressively, but remain dominated by foreign-owned enterprises performing relatively simple assembly. Domestic Vietnamese companies struggle to move beyond basic supplier roles. The knowledge required for product design, process engineering, quality systems, and supply chain orchestration stays in foreign hands. Vietnam gains GDP growth and employment. It doesn’t gain the capabilities that would allow it to eventually compete with Samsung rather than just assembling Samsung’s products.
The “premature deindustrialization” phenomenon adds another worry. Historically, countries industrialized—shifting workers from agriculture to manufacturing—before transitioning to services once they reached high income. Many ASEAN countries show signs of shifting to services while still middle-income, potentially missing the manufacturing-driven development phase that built prosperity elsewhere.
Thailand provides a cautionary example. The country successfully industrialized through the 1980s and 1990s, building genuine automotive sector capabilities. Yet growth stalled after the 1997 Asian Financial Crisis. Despite hosting substantial manufacturing, Thailand hasn’t broken through to high-income status. Real wage growth remains modest. Thailand’s exports to the United States surged about 30% compared to 2024, yet Bloomberg Economics projects potential contraction in 2026 if trade barriers persist.
Malaysia faces similar challenges. The semiconductor industry showcases the problem perfectly. Malaysia dominates global semiconductor packaging—a critical but relatively low-margin activity. Yet design capabilities, R&D centers, and advanced manufacturing remain elsewhere. Workers assemble components designed by American and Taiwanese engineers. The profits flow accordingly.
Educational systems compound the problem. In Vietnam, only about 28% of workers have received formal training, far below what’s needed for technological upgrading. ASEAN governments haven’t adequately scaled technical education, reformed curriculum to match manufacturing needs, or invested in the engineering capacity that industrial transformation requires.
Is ASEAN stuck in middle-income trap? The evidence increasingly suggests yes, at least for several major economies. Export booms create the illusion of dynamism, but the underlying reality—limited technology absorption, weak domestic firms, inadequate innovation systems, insufficient human capital development—points toward stagnation rather than transformation.
Here’s what genuine development looks like: domestic companies progressively taking on more sophisticated roles, wages rising substantially in line with productivity improvements, economic complexity increasing as countries master more advanced products, and critically, the emergence of indigenous innovation rather than perpetual technology importation. ASEAN has achieved export-led growth. It hasn’t achieved development.
Policy Failures That Turned Windfall Into Mirage
The US-China trade war created a historic opportunity for Southeast Asia. Manufacturing investment seeking alternatives to China, supply chain diversification imperatives, and geopolitical conditions favoring ASEAN should have accelerated development. Instead, short-sighted policies and institutional failures have squandered much of this opportunity, leaving countries with impressive trade statistics but little genuine advancement.
The fundamental failure involves mistaking investment quantity for investment quality. ASEAN countries adopted a “take what we can get” approach to foreign direct investment, measuring success by dollar values rather than developmental impact. Any investment that created jobs and boosted exports counted as victory, regardless of whether it transferred technology, built local capabilities, or integrated domestic firms into supply chains.
Vietnam illustrates both the success and failure. The country brilliantly attracted investment, becoming Southeast Asia’s FDI magnet. Yet that success came at a cost—accepting investments on terms favoring foreign companies over developmental objectives. No meaningful technology transfer requirements. Minimal local content mandates. Little insistence on supplier development programs that would help Vietnamese companies join supply chains. The result? Foreign enterprises dominate exports while domestic firms remain marginal.
IMF research shows that packaging together broad, economy-wide reforms spanning regulation, governance, and education could help major ASEAN emerging market economies increase long-term real economic output by 20% or more over two decades. But comprehensive reform requires political will ASEAN countries have largely lacked. Instead, governments pursued fragmented initiatives without coherent industrial strategy or sustained implementation.
Education failures loom particularly large. Despite knowing for years that manufacturing investment was coming, governments didn’t adequately scale technical training or engineering programs. The skills gap between what factories need and what workers can provide remains stubbornly wide, forcing firms to import expertise or settle for lower-value activities matching available skills. When only 28% of workers have formal training and targets aim for just 30% by 2025 and 45% by 2030, the timelines simply don’t match industrialization’s urgency.
Infrastructure bottlenecks further constrain the export boom’s potential. While the six main ASEAN economies are generally more open than the average emerging market, these countries still have more barriers to trade and are relatively harder to trade with than the median OECD country. Port congestion, unreliable electricity, and inadequate logistics networks raise costs and deter higher-value investment seeking efficient operations.
Corruption and regulatory unpredictability create additional obstacles. Indonesia’s constantly shifting regulations scare long-term investors needing policy stability. Thailand’s political instability undermines confidence. Even relatively well-governed Vietnam and Malaysia struggle with regulatory opacity and arbitrary enforcement favoring connected firms over market competition.
The comparative failure becomes stark when contrasted with East Asian development models. South Korea and Taiwan during industrialization demanded technology transfer as a condition for market access. They implemented local content requirements with graduated timelines. They ran supplier development programs systematically linking foreign and domestic firms. They invested strategically in infrastructure prioritizing manufacturing zones. They reformed education focusing on engineering and technical skills.
ASEAN did almost none of this. Instead, members raced to the bottom, competing to offer investors the best tax breaks, most lenient environmental standards, and weakest labor protections. This zero-sum competition benefited investors while limiting regional benefits. Had ASEAN countries coordinated—jointly demanding better terms, agreeing not to undercut each other, pooling resources for technology development—outcomes might have differed dramatically.
The window for correction narrows rapidly. Automation threatens to eliminate low-wage advantages before ASEAN countries can upgrade capabilities. Chinese manufacturing overcapacity intensifies competition. And the trade war itself could reverse if US-China relations stabilize, suddenly making Southeast Asian platforms less necessary. The opportunity that seemed boundless in 2018 now looks increasingly finite.
Three Futures: How This Story Could End
ASEAN’s trade war experience will ultimately yield one of three broad outcomes. Understanding these scenarios helps clarify what’s at stake and what choices might still alter trajectories.
Scenario One: The Reform Breakthrough
In this optimistic version, current pressures finally catalyze comprehensive reforms. External shocks—perhaps a sudden investment pullback or dramatic tariff changes—create political space for reformist coalitions. Governments implement aggressive industrial upgrading strategies, demanding genuine technology transfer from foreign investors while significantly supporting domestic firms.
Regional cooperation deepens beyond rhetoric. ASEAN functions as an integrated market of 680 million consumers rather than ten competing economies, creating scale advantages that attract higher-quality investment. A more integrated ASEAN could function as a massive ‘domestic’ market of 680 million people and $3.9 trillion in GDP, creating stable demand less vulnerable to external shocks.
Education reforms accelerate, producing the engineers and technicians that advanced manufacturing requires. Infrastructure investments target genuine bottlenecks. Governance improves as middle-class constituencies demand accountability. The trade war’s temporary benefits get transformed into lasting capabilities. Vietnam’s domestic companies move from low-tier suppliers to genuine competitors. Malaysia advances beyond assembly into design and R&D. Thailand successfully navigates the EV transition.
This scenario requires political will, institutional capacity, and frankly, some luck with external conditions. But it’s technically feasible—the resources exist if mobilized effectively. Southeast Asia wouldn’t be the first region leveraging external shocks for transformative change. The question is whether ASEAN countries can execute what South Korea and Taiwan accomplished decades earlier, despite facing a far more challenging global environment.
Scenario Two: Drift and Stagnation
The more probable middle scenario sees current patterns continuing. Exports remain elevated but value capture stays low. Foreign investment continues but on terms perpetuating assembly platform status. Domestic firms struggle to compete. Political elites capture what benefits do accrue while inequality widens.
GDP growth continues at modest 2-4% annually—enough to avoid crisis but insufficient for transformation. The gap between ASEAN and high-income economies persists or widens. The middle-income trap deepens as the strategies that enabled initial growth prove inadequate for reaching prosperity.
Social tensions increase as populations recognize export booms aren’t delivering broad prosperity. Youth unemployment rises despite headline growth, as education systems fail producing skills advanced economies demand. The development promise fades into frustration, potentially destabilizing political systems already under strain.
China’s role intensifies this scenario. As Chinese manufacturing becomes even more efficient through automation and scale, ASEAN’s comparative advantages erode further. The region becomes a perpetual processing platform—earning assembly wages while China, America, Taiwan, and Korea capture design, component production, and systems integration profits. Not collapse, but indefinite stagnation—countries trapped between poverty and prosperity, watching opportunities slip away while lacking will or capacity to seize them.
Scenario Three: Crisis and Reversal
The darkest scenario involves sudden disruption exposing ASEAN’s vulnerabilities. US-China trade normalization—whether through diplomatic breakthrough or political change—eliminates tariff differentials currently favoring Southeast Asian exports. Production that relocated from China suddenly becomes uncompetitive. “China-plus-one” strategies reverse to “China-only” as companies discover Southeast Asian platforms can’t match Chinese efficiency, infrastructure, and supply chain depth.
Capital outflows accelerate as firms relocate back to China or to other newly competitive locations. Factories that sprouted across ASEAN during 2018-2025 become stranded assets. Trade surpluses flip to deficits as Chinese imports continue while exports collapse. Currencies depreciate, importing inflation that erodes what wage gains workers had achieved.
Economic disruption triggers political instability, particularly in countries where growth has legitimized governance systems. Thailand’s recurring political crises intensify. Vietnam faces renewed pressures as the social contract—accept limited freedoms for rising prosperity—breaks down when prosperity stops rising. Indonesia confronts populist nationalism that complicates economic management.
This crisis scenario might paradoxically create conditions for genuine reform, as emergency measures force painful but necessary restructuring. But it could also produce a lost decade or more, setting back development by years and discrediting export-oriented strategies entirely. The risk isn’t hypothetical—Southeast Asian countries remember the 1997 financial crisis and how quickly apparent prosperity can evaporate.
What Hangs in the Balance
This isn’t just about economics. Behind every trade statistic, every FDI figure, every export surge are 680 million people whose life prospects depend on whether their countries can translate temporary advantages into lasting prosperity.
The Vietnamese factory worker assembling smartphones hopes her children will design them. The Malaysian logistics coordinator wants his son managing supply chains, not just working warehouses. The Indonesian farmer who sent his daughter to the city for factory work expects her wages to lift the family from subsistence. These individual aspirations, multiplied across Southeast Asia, define what’s at stake.
Current trends suggest many will be disappointed. The export boom has created jobs but not careers, income but not wealth, growth but not development. Without fundamental changes, ASEAN risks permanent middle-income status—prosperous enough to avoid poverty, unable to achieve affluence.
The comparison with Northeast Asian development remains stark. South Korea transformed from war-torn poverty to global industrial powerhouse in a generation. Singapore went from colonial outpost to First World city-state. Taiwan built a technology ecosystem underpinning global semiconductor supply chains. Southeast Asia possesses comparable human capital, geographic advantages, and market access. What it lacks is strategic vision, institutional capacity, and political will to leverage these advantages effectively.
Global implications extend beyond Southeast Asia. ASEAN’s experience offers lessons about 21st century development more broadly. If countries receiving massive FDI, export opportunities, and favorable geopolitical positioning still can’t escape middle-income status, what hope exists for less fortunately positioned nations? Development models that worked in the past may not function in an era of global value chains, rapid automation, and intensifying geopolitical competition.
For global supply chain resilience, ASEAN’s struggles matter enormously. If Southeast Asian manufacturing proves unsustainable—too dependent on Chinese inputs, too vulnerable to geopolitical shifts, too focused on assembly rather than genuine capabilities—then corporate “China-plus-one” strategies rest on shaky foundations. Real supply chain diversification requires developing robust alternative manufacturing ecosystems, not just relocating final assembly operations.
The next few years will be decisive. Trade war dynamics remain unstable with policies shifting unpredictably. ASEAN countries face a narrow window to implement reforms before external conditions change or opportunities close. The International Monetary Fund projects the US economy to grow by 2.1% in 2026, slightly faster than 2025, suggesting American import demand may remain relatively stable. But geopolitical risks could escalate suddenly, or automation could accelerate faster than expected, fundamentally altering ASEAN’s competitive position.
Watch Vietnam’s domestic firm development as a key indicator. Monitor whether Malaysia can move beyond assembly into design and R&D. Observe if Thailand successfully pivots to higher-value manufacturing or gets stuck hosting Chinese firms pursuing tariff avoidance. Track whether Indonesia’s resource nationalism evolves into genuine industrial policy or devolves into counterproductive protectionism.
The factories are here. The exports are real. The GDP numbers look impressive. But the critical question remains unanswered: Will the prosperity being generated actually stay in Southeast Asia, enriching its people and building lasting capabilities? Or will it continue flowing to shareholders in Beijing, Seoul, Tokyo, and San Francisco, leaving ASEAN permanently trapped between poverty and prosperity?
Southeast Asia’s 680 million people—and anyone watching to see if traditional development paths still exist in our fragmented, competitive global economy—are still waiting for that answer. The export boom is real. Whether it becomes a development breakthrough or just another false dawn depends entirely on choices ASEAN countries make in the brief window that remains open.
Discover more from The Economy
Subscribe to get the latest posts sent to your email.


How once-unimaginable catastrophes become baseline assumptions
There is a particular kind of hubris that infects markets in the long stretches between catastrophes. Volatility compresses. Risk premia decay. The insurance gets quietly cancelled because it hasn’t paid out in years and the premiums feel like wasted money. Then the disaster arrives — not as a distant rumble but as a wall of water — and the entire analytical framework investors have spent years constructing turns out to have been a map of the wrong country.
We are living through one of the most instruction-rich moments in modern financial history. Since February 28, 2026, when the United States launched military operations against Iran and Tehran responded by closing the Strait of Hormuz, markets have been running a live masterclass in catastrophe pricing. West Texas Intermediate crude surged from $67 to $111 per barrel in under a fortnight — the fastest oil spike in four decades. War-risk insurance premiums on shipping through the Gulf soared more than 1,000 percent. The S&P 500 lost 5 percent in a single week, and the ECB and Bank of England are now staring down a renewed tightening scenario they spent the first quarter of 2026 insisting was off the table.
And yet — and this is the part that should make every portfolio manager uncomfortable — the analytical mistakes driving losses right now are not new. They are the same six structural errors investors have made in every previous crisis. Understanding them, really understanding them, is not an academic exercise. It is the difference between surviving the next disaster and being liquidated by it.
Key Takeaways at a Glance
- Markets price first-order disaster impacts; second- and third-order cascades are systematically underpriced
- Volatility is information; price-discovery failure is the true systemic risk — monitor private-to-public valuation spreads
- Tight CAT bond spreads signal capital crowding, not benign risk — use compression as a contrarian indicator
- Emerging market currencies and credit spreads lead developed-market pricing of global disasters
- Geopolitical risk premia decay faster than structural damage — separate the transitory from the permanent
- The best time to buy tail protection is when every indicator says you do not need it
Lesson One: Markets price the disaster they know, not the one that is compounding behind it
The economics of disaster pricing contain a fundamental asymmetry. Markets are reasonably good at incorporating a known risk — geopolitical tension, elevated VIX, stretched valuations — into current prices. What they catastrophically underprice is the second-order cascade that no single model captures.
Consider what the Hormuz closure actually detonated. Yes, oil went to $111 per barrel. Obvious. What was less obvious: the inflation feedback loop that forced investors to reprice central bank paths they had already discounted as settled. The Federal Reserve was expected to hold rates in 2026; futures now assign a 74 percent probability it does not cut at all this year. Europe’s energy import dependency made the ECB’s position worse. That transmission — from oil shock to rate-repricing to credit stress to equity multiple compression — is a chain, not a point event. Most risk models price the first link.
The academic framework for this is well established but rarely operationalised. The NBER disaster-risk literature, particularly Wachter (2013) and Barro (2006), argues that rare disasters produce risk premia that appear irrational in calm periods but are in fact the rational price of tail exposure across long time horizons. What these models miss, however, is that real-world disasters rarely arrive as clean, isolated point events. They arrive as cascades. The COVID-19 pandemic was not just a health shock — it was simultaneously a supply-chain shock, a demand shock, a sovereign-debt shock, and a labour-market restructuring shock. The Hormuz closure is not just an oil shock. It is an inflation shock, a monetary policy shock, a EM balance-of-payments shock, and an AI-investment sentiment shock, all at once.
Key takeaway: Map not just the primary disaster scenario but every second- and third-order transmission mechanism it activates. The primary impact is already partially in the price. The cascades are not.
Lesson Two: The real crisis is not volatility — it is the collapse of price discovery
Scott Bessent, the US Treasury Secretary, said something in March 2026 that deserves to be read not as politics but as a precise financial concept. Asked what genuinely frightened him after 35 years in markets, Bessent answered: “Markets go up and down. What’s important is that they are continuous and functioning. When people panic is when you’re not able to have price discovery — when markets close, when there is the threat of gating.”
Volatility is information. A price moving sharply up or down is a market doing exactly what it should: integrating new signals, adjusting expectations, clearing. The true systemic catastrophe is not a 10 percent drawdown. It is the moment when buyers and sellers can no longer find each other at any price — when the mechanism that produces prices breaks entirely.
This is not theoretical. Private credit markets are currently exhibiting exactly this dynamic. US BDCs — business development companies that provide credit to mid-market companies — have seen share prices fall 10 percent and trade 20 percent or more below their latest stated NAVs. Alternative asset managers that collect fees from these vehicles are down more than 30 percent. The public market is rendering a verdict on private valuations that the private market itself cannot yet deliver, because the private marks have not moved. There is no continuous clearing mechanism. There is no daily price discovery. There is only the last funding round — which is a negotiated fiction, not a price.
Investors who understand this distinction can do something useful with it: treat the spread between public-market pricing and private-market marks as a real-time fear gauge. When that gap widens sharply, the market is not panicking irrationally. It is pricing the absence of price discovery itself.
Key takeaway: Distinguish between volatility (information-rich, manageable) and price-discovery failure (structurally dangerous, contagion-prone). Monitor private-to-public valuation spreads as a leading indicator of the latter.
Lesson Three: Catastrophe bond complacency is always a warning, never a reassurance
In February 2026, Bloomberg reported that catastrophe-bond risk premia had fallen to levels not seen since before Hurricane Ian struck Florida in 2022. The cause was a surge of fresh capital chasing ILS yields. Managers called it a healthy market. A more honest reading is that it was a market pricing the wrong risk for the wrong reasons.
Here is the structural problem with catastrophe bonds, and indeed with most insurance-linked securities: the risk premium is set by the supply of capital chasing the trade, not by the true probability distribution of the underlying disaster. When capital floods in — as it has, driven by institutional allocators seeking uncorrelated returns — spreads compress regardless of whether the actual hurricane, flood, or geopolitical catastrophe risk has changed. The academic literature on CAT bond pricing, including recent work in the Journal of the Operational Research Society, confirms that cyclical capital flows consistently distort the risk-neutral pricing of catastrophe events.
The counter-intuitive lesson: when CAT bond spreads are tightest, protection is cheapest to buy and most expensive to have sold. The compression that looks like market efficiency is often capital crowding masquerading as a risk assessment. A catastrophe-bond market trading at pre-Ian yields six months before an Iran-driven energy crisis was not a serene market. It was a complacent one.
Key takeaway: Use catastrophe-bond spread compression not as a signal of benign risk conditions but as a contrarian indicator of under-priced tail exposure. Buy protection when it is cheap; do not sell it because it is cheap.
Lesson Four: Emerging markets absorb the shock first — and price it most honestly
There is a geographic hierarchy to disaster pricing that sophisticated global investors routinely ignore. When a major geopolitical or macro catastrophe detonates, the signal appears first in emerging market currencies, credit spreads, and energy import bills — not in the S&P 500 or the Dax. This is not because EM markets are more efficient. It is because they have less capacity to absorb shocks and therefore less incentive to pretend the shock is temporary.
The Hormuz closure is a case study. Developed-market investors spent the first week debating whether oil at $111 per barrel was “priced in.” Meanwhile, Gulf states were issuing precautionary production-cut announcements and Middle Eastern shipping had effectively ceased. Economies in South and Southeast Asia — which import 80 percent or more of their petroleum needs — faced simultaneous currency pressure (oil is dollar-denominated), fiscal pressure (fuel subsidies explode), and inflation pressure (food and transport costs surge). Countries like Pakistan, Sri Lanka, and Bangladesh were pricing a recession before most DM economists had updated their Q1 2026 forecasts.
The BIS research on disaster-risk transmission across 42 countries documents precisely this dynamic: world and country-specific disaster probabilities co-move in complex, non-linear ways. When global disaster probability rises, EM asset prices move first and fastest. For a DM investor, this is an early-warning system hiding in plain sight.
Key takeaway: Monitor EM currency indices, sovereign credit spreads, and fuel import data as leading indicators of how the global market is actually pricing a disaster — before the consensus in New York or London has caught up.
Lesson Five: Geopolitical risk premia have a half-life problem — and it is shorter than you think
Markets are extraordinarily good at normalising the catastrophic. This is not a character flaw; it is a survival mechanism. But for investors, the normalisation of extreme risk is one of the most financially treacherous dynamics in markets.
Consider the structural pattern Tyler Muir documented in his landmark paper Financial Crises and Risk Premia: equity risk premia collapse by roughly 20 percent at the onset of a financial crisis, then recover by around 20 percent over the following three years — even when the underlying structural damage persists. Wars display an even more dramatic version of this pattern. The initial shock is priced aggressively. But as weeks become months, the equity market begins to discount the conflict as background noise, even if oil remains $20 per barrel above pre-war levels and inflation continues to compound.
This half-life problem cuts in two directions. On the way in: investors are often too slow to price a new geopolitical risk, underestimating how durable its effects will be. On the way out: investors often reprice risk premia too quickly back to baseline, treating a structural change in the global system as if it were a weather event that has now passed. The Strait of Hormuz may reopen. But global shipping has permanently re-priced war-risk. Sovereign wealth funds in the Gulf are permanently reconsidering their US dollar reserve holdings. Indian and Japanese energy policymakers are permanently accelerating domestic diversification. These structural changes do not vanish when the headline risk premium fades.
Key takeaway: When pricing geopolitical disasters, separate the acute risk premium (which will fade) from the structural repricing (which will not). The former is a trading signal. The latter is an asset allocation decision that most portfolios have not yet made.
Lesson Six: The moment you feel safest is precisely when you are most exposed
The final lesson is the most counter-intuitive, and arguably the most important. There is a specific period in any market cycle — often 18 to 36 months after the previous crisis — when the cost of tail protection is at its cheapest, investor confidence is high, and catastrophe risk feels entirely theoretical. This is exactly when the next disaster is being loaded.
We can locate this period with precision in the current cycle. In early 2026, the CAPE ratio on US equities reached 39.8, its second-highest reading in 150 years. The Buffett Indicator (total market cap to GDP) hovered between 217 and 228 percent — historically associated with the period immediately before major corrections. CAT bond spreads were at post-Ian lows. VIX had compressed back to mid-teens. Private-credit redemption queues were elevated but not yet alarming. And the macroeconomic consensus — including, notably, within the US Treasury — was that tariff-driven inflation would prove transitory and that central banks would be cutting before mid-year.
Every one of those conditions has now reversed. The reversal took six weeks.
The academic literature on learning and disaster risk, particularly the Kozlowski, Veldkamp, and Venkateswaran (2020) framework on “scarring” from rare events, finds that markets systematically underestimate disaster probability in long stretches without disasters, then over-correct sharply when one arrives. This is not irrationality in the pejorative sense — it is Bayesian updating in the presence of genuinely ambiguous information. But the practical implication is stark: the time to buy disaster insurance is not after the disaster has arrived and the VIX has spiked to 45. It is in the quiet months when every indicator says you don’t need it.
Key takeaway: Maintain systematic, rule-based disaster hedges that do not depend on a real-time catastrophe forecast. The moment it feels unnecessary to hold tail protection is the moment the portfolio is most exposed to needing it.
The Synthesis: From Lessons to Portfolio Architecture
These six lessons converge on a single architectural principle: disaster pricing is not a moment-in-time forecast exercise. It is a permanent structural feature of portfolio construction.
The real mistake — the one that has cost investors dearly in 2020, in 2022, and again in 2026 — is not failing to predict the next disaster. It is believing that markets have already priced it in. The history of catastrophe pricing teaches us, with brutal consistency, that they have not. The cascade is underpriced. The price-discovery failure is unmodelled. The CAT bond spread is supply-driven, not risk-driven. The EM signal is ignored. The geopolitical risk premium is given a shorter half-life than the structural damage it caused. And the tail hedge is cancelled precisely when it is most needed.
The investors who will outperform across the full cycle are not those who predicted the Hormuz closure or the tariff escalation or the next crisis that has not yet been named. They are those who understood that unpriceable disasters are not unpriceable because they are impossible to imagine. They are unpriceable because the incentive structures of the investment industry consistently penalise the premiums required to hedge them.
That gap between what disasters cost and what markets charge for protection is not a market inefficiency. It is the most durable alpha in finance. Learning to harvest it is, in the deepest sense, the only lesson that matters.
Discover more from The Economy
Subscribe to get the latest posts sent to your email.

There was a moment, somewhere in the fog of mid-2025, when the prevailing consensus on Wall Street and in the marble corridors of multilateral institutions was something close to dread. U.S. tariffs had mushroomed into the most aggressive trade barriers since Smoot-Hawley. Shipping lanes were fractured. Geopolitical fault lines — in the Middle East, in the Taiwan Strait, across the ruins of eastern Ukraine — had not so much deepened as multiplied. The prophets of doom were well-provisioned with data. And yet, here we are. The global economy, battered and limping, is still standing — and in certain respects, walking rather faster than feared.
This is not a triumphalist story. The global economy more resilient than feared narrative deserves neither uncritical celebration nor smug vindication. What it demands is honest, clear-eyed examination. Why did the worst not happen? What forces absorbed the blows? And — most critically — does the resilience we are witnessing reflect structural strength, or is it a borrowed grace, a temporary reprieve before deeper reckonings arrive?
The numbers, for now, tell a story of surprising steadiness. The IMF’s January 2026 World Economic Outlook projects global growth at 3.3 percent for 2026 and 3.2 percent for 2027 — a small but meaningful upward revision from October 2025 estimates. IMF Managing Director Kristalina Georgieva, speaking at Davos in January 2026, called this outcome “the biggest surprise” — a remarkable concession from the head of the institution whose job it is, partly, to anticipate exactly this. Meanwhile, the UN Department of Economic and Social Affairs estimated 2025 global growth at 2.8 percent, better than expected given the tariff storm that rolled through international trade. The OECD, for its part, subtitled its December 2025 Economic Outlook “Resilient Growth but with Increasing Fragilities” — a formulation that is, in its cautious way, almost poetic.
The Four Pillars of an Unlikely Resilience
So what happened? Why didn’t it break?
1. The Private Sector Adapted Faster Than Governments Could Fragment
Perhaps the single most underappreciated force in the global economy’s durability is the sheer agility of the private sector. Georgieva at Davos was blunt about it: globally, governments have stepped back from running companies, and the private sector — “more adaptable, more agile” — has filled the void. When tariffs on certain trade corridors spiked, supply chains did not collapse so much as reroute. Manufacturers diversified sourcing from China to Vietnam, Mexico, and India. Companies front-loaded exports ahead of anticipated barriers, producing a short-term trade surge that buffered 2025 GDP figures across multiple economies. The OECD noted that global growth continued at a resilient pace, driven in part by the front-loading of trade in anticipation of higher tariffs earlier in the year, alongside strong AI investment and supportive macroeconomic policies.
This is, of course, a partial answer. Front-loading is not structural growth — it borrows demand from the future. But it bought time, and time, in economics, is often everything.
2. Technology Investment as the New Growth Engine
The second pillar is one that carries both the greatest promise and the most dangerous ambiguity: the relentless surge in artificial intelligence and broader information technology investment. The IMF’s analysis identified continued investment in the technology sector — especially AI — as a key driver of resilience, acting as “a very powerful driver of growth and potentially prosperity”. The OECD’s data underscores the geography of this boom: AI-related trade now accounts for roughly 15.5 percent of total world merchandise trade, with two-thirds of that originating in Asia. Tech exports from Korea and Chinese Taipei continued rising into late 2025. In the United States, the numbers are almost surreal: strip out AI-related investments, and U.S. GDP contracted slightly in the first half of 2025.
This tells you something important. The global economy’s resilience in 2025–26 is, in significant measure, a tech-sector story. It is a story concentrated in a handful of companies, a handful of geographies, and a single technological paradigm. That concentration is both the source of its power and the root of its fragility — a point we will return to.
3. Monetary and Fiscal Policy Did Not Drop the Ball
History will be reasonably kind to the monetary policymakers of this era — not because they were brilliant, but because they did not, on balance, panic. Central banks that had raised rates aggressively through 2022–23 began easing with measured care as inflation declined. Global headline inflation fell from 4.0 percent in 2024 to an estimated 3.4 percent in 2025, with further moderation projected toward 3.1 percent in 2026. This easing in price pressures gave central banks room to cut, which in turn supported financial conditions, credit availability, and investment flows. The IMF noted that “accommodative financial conditions” were among the key offsetting tailwinds to trade disruptions.
Fiscal policy, too, surprised — though not without cost. Governments spent. Defence budgets expanded. Industrial policy packages — from the remnants of U.S. clean energy subsidies to the EU’s Recovery and Resilience Facility — continued channelling public money into capital formation. The bill, of course, is accumulating. But in 2025 and into 2026, fiscal firepower helped absorb shocks that might otherwise have cascaded.
4. Emerging Market Resilience Held the Global Average
The fourth pillar is often underweighted in Western commentary: the developing world, especially in Asia, continued to grow. South Asia is forecast to expand 5.6 percent in 2026, led by India’s 6.6 percent expansion, driven by resilient consumption and substantial public investment. Africa is projected at 4.0 percent. These are not trivial numbers. When commentators in New York or London describe the global economy as “resilient,” they are describing an aggregate that is substantially upheld by hundreds of millions of consumers and workers in economies whose stories rarely make the front page of financial newspapers. The heterogeneity is stark: the OECD bloc muddles along; the emerging world, in many places, runs.
The Data Beneath the Headlines: A Comparative Snapshot
| Institution | 2025 Global Growth | 2026 Forecast | Key Drivers Cited |
|---|---|---|---|
| IMF (Jan 2026) | 3.3% | 3.3% | AI investment, fiscal/monetary support, private sector agility |
| OECD (Dec 2025) | 3.2% | 2.9% | Front-loading, AI trade, macroeconomic policy |
| UN DESA (Jan 2026) | 2.8% | 2.7% | Consumer spending, disinflation, EM domestic demand |
The discrepancies in headline figures reflect genuine methodological differences — purchasing power parity weighting, country coverage, base year choices. But the directional consensus is unmistakable: the world grew more in 2025 than it was expected to when tariff escalation peaked. That is a fact worth sitting with.
Why the Resilience Is Under-Appreciated (and Why That Matters)
Here is an inconvenient truth about economic discourse: bad news travels faster, and fear is more monetisable than optimism. The financial media ecosystem is structurally incentivised to amplify downside scenarios. The think tanks that warned loudest about a tariff-induced recession in 2025 are not, by and large, issuing prominent corrections.
This matters because misread resilience breeds misguided policy. If policymakers believe the economy is weaker than it actually is, they over-stimulate — running up debt, inflating asset prices, postponing necessary reforms. If investors believe fragility is the baseline, they underallocate capital to productive long-term investments in favour of short-term hedging. Getting the diagnosis right is not academic; it shapes behaviour, and behaviour shapes outcomes.
The IMF noted that the trade shock “has not derailed global growth” and that global economic growth “continues to show considerable resilience despite significant trade disruptions caused by the US and heightened uncertainty”. Georgieva’s “biggest surprise” framing is telling: even the IMF, with all its modelling resources, did not anticipate the degree of offset. That should prompt a certain epistemic humility about our collective ability to forecast economic shocks — and perhaps a corresponding caution about declaring the worst inevitable next time.
The Fragilities That Resilience Is Masking
And yet. Here is where intellectual honesty demands a sharp turn.
The IMF warned explicitly that the current resilience “masks underlying fragilities tied to the concentration of investment in the tech sector,” and that “the negative growth effects of trade disruptions are likely to build up over time.” The OECD’s subtitle — “Resilient Growth but with Increasing Fragilities” — deserves to be read in full, not just the first half. There are at least five structural vulnerabilities that the headline growth numbers obscure.
The AI Bubble Risk Is Real and Underpriced
The same technology boom that is holding up the global economy today could become its undoing if expectations are not met. The IMF cautioned explicitly about the risk of a correction in AI-related valuations, warning that if tech firms fail to “deliver earnings commensurate with their lofty valuations,” a correction could trigger lower-than-expected growth and productivity losses. The OECD echoes this: weaker-than-expected returns from net AI investment could trigger widespread risk repricing in financial markets, given stretched asset valuations and optimism about corporate earnings.
Strip out AI investment from U.S. GDP and the economy contracted in early 2025. That is a remarkable statement of concentration risk, and it deserves to be said plainly: a significant portion of what we are calling “global resilience” is a bet on AI productivity gains materialising at scale, on schedule. That bet may be correct. It may also be the largest speculative bubble since the dot-com era, dressed in more sophisticated clothes.
Public Debt Is a Ticking Clock
Governments spent their way through the pandemic, then through the inflation crisis, then through the tariff shock. The fiscal bills are accumulating. The OECD flagged that high public spending pressures from rising defence requirements and population ageing are increasing fiscal risks, while NATO countries plan to raise core military spending to at least 3.5% of GDP by 2035. The IMF maintains that governments still have “important work to do to reduce public debt to safeguard financial stability.” None of this is new, but the accumulation of deferred reckoning is reaching levels where the next shock — a pandemic, a financial crisis, a major military conflict — will find fiscal buffers meaningfully depleted.
Geopolitical Fragmentation Has Not Stabilised
The Strait of Hormuz, through which roughly a fifth of global oil supply normally flows, saw shipping traffic fall 90 percent during a fresh Middle East escalation. The IMF’s Georgieva warned that if the new conflict proves prolonged, it has “clear and obvious potential to affect market sentiment, growth, and inflation”. For Japan alone, close to 60 percent of oil imports transit through the strait. For Asia broadly, the exposure is existential in energy security terms. The tariff wars between the U.S. and China have eased somewhat from their 2025 peaks, but the WTO’s Director-General has warned that a full U.S.-China economic decoupling could reduce global output by 7 percent in the long run — a figure that dwarfs any AI productivity upside currently modelled.
Inequality Is Widening, Not Narrowing
The resilience of the global aggregate conceals a distributional disaster. The UN Secretary-General António Guterres noted that “many developing economies continue to struggle and, as a result, progress towards the Sustainable Development Goals remains distant for much of the world”. High prices continue to erode real incomes for low- and middle-income households across the globe, even as headline inflation falls. AI productivity gains, where they materialise, are accruing disproportionately to capital owners and highly skilled workers in a handful of advanced economies. The Davos consensus on AI-as-equaliser remains aspirational, not empirical.
Supply Chain Concentration Has Not Been Solved
The pandemic briefly sensitised policymakers to the fragility of hyper-concentrated global supply chains. Yet China still accounts for more than 50 percent of all rare earth mining and lithium globally, and more than 90 percent of all magnet manufacturing and graphite. These are not peripheral materials — they are the physical substrate of the AI economy, the clean energy transition, and modern defence systems. A single supply disruption event here would cascade through semiconductors, electric vehicles, wind turbines, and data centres simultaneously. The diversification rhetoric remains largely rhetoric.
What Genuine Resilience Would Actually Look Like
Reading the data carefully, one is struck by the difference between resilience as a condition and resilience as a strategy. What the global economy has demonstrated since 2022 is resilience of the first kind: absorption capacity, improvisational agility, the ability to muddle through. What it has not yet demonstrated is resilience of the second kind: the deliberate construction of buffers, the investment in systemic redundancy, the political willingness to accept short-term costs for long-term stability.
Georgieva’s injunction at Davos — “learn to think of the unthinkable, and then stay calm, adapt” — is good personal advice. As a framework for global economic governance, it is insufficient. Here, then, is what bold, prescription-level thinking demands:
1. A Multilateral AI Investment Framework. The AI boom cannot continue to be managed as a purely national or corporate phenomenon. A framework housed at the WEF or the OECD should establish shared standards for AI investment disclosure, productivity accounting, and systemic risk assessment. If AI is indeed driving 15 percent of world merchandise trade, it deserves the kind of multilateral oversight that financial instruments won — slowly, imperfectly — after 2008.
2. Coordinated Fiscal Consolidation Timelines. The IMF’s calls for debt reduction need to be backed by credible multilateral timelines, not just bilateral conditionality. A G20-level framework that sequences fiscal consolidation against growth indicators — rather than imposing austerity into downturns — would give markets clearer signals while protecting public investment in strategic sectors.
3. Strategic Supply Chain Diversification, Funded Publicly. The World Bank and regional development banks should establish dedicated financing windows for critical minerals diversification and processing capacity outside current concentration zones. This is not protectionism — it is systemic risk management, and it is overdue.
4. A Green and Digital Investment Compact for the Global South. The differential between 6.6 percent growth in India and negative growth in parts of sub-Saharan Africa is not inevitable — it reflects infrastructure deficits and financing gaps that multilateral institutions have the tools, if not always the will, to address. The UN DESA report is explicit: without stronger policy coordination, today’s pressures risk locking the world into a lower-growth path, with developing nations shouldering a disproportionate share of the pain.
5. Central Bank Independence as a Non-Negotiable. The IMF has stressed that central bank independence remains critical for both price stability and credibility. In an era when political leaders are increasingly tempted to subordinate monetary institutions to short-term electoral calculations — particularly around the inflation-tariff nexus — this point deserves repetition, loudly, without apology.
The Verdict: Resilient, But Not Invulnerable
Let us be precise about what the evidence shows. The global economy has absorbed, without breaking, a series of shocks that would have qualified as catastrophic by pre-pandemic standards. It has done so through a combination of technological investment, fiscal and monetary firepower, private sector adaptability, and the sheer demographic and economic weight of emerging economies continuing to grow. This is genuinely impressive. It should not be dismissed.
But resilience in a storm is not the same as being sea-worthy. The hull is holding — for now. The debt levels are high and rising. The geopolitical weather is worsening. The AI boom is either the most transformative force since the industrial revolution or the most dangerous speculative bubble since tulips, and the honest answer is that we do not yet know which. As the IMF’s own blog put it in January 2026, the challenge for policymakers and investors alike is “to balance optimism with prudence, ensuring that today’s tech surge translates into sustainable, inclusive growth rather than another boom-bust cycle.”
Georgieva’s injunction rings true: “We need to not only understand why it is resilient, but nurture this resilience for the future.” That is the work that has not yet been done. The economy has surprised us. The question is whether we are surprised enough to actually change course — or whether, as so often in history, relief becomes complacency, and complacency becomes the seed of the next crisis.
The global economy is more resilient than we feared. It is less resilient than we need it to be. That gap — between the relief of today and the demands of tomorrow — is the most important space in contemporary economic policy. Filling it requires not optimism alone, nor pessimism, but something rarer and more valuable: clarity.
📊 Key Growth Forecasts at a Glance (2025–2027)
| Economy | 2025 (Est.) | 2026 (Forecast) | 2027 (Forecast) |
|---|---|---|---|
| World (IMF) | 3.3% | 3.3% | 3.2% |
| World (UN DESA) | 2.8% | 2.7% | 2.9% |
| World (OECD) | 3.2% | 2.9% | 3.1% |
| United States | ~1.9–2.0% | 2.0–2.4% | 1.9–2.0% |
| China | 5.0% | 4.4–4.5% | 4.3% |
| Euro Area | 1.3% | 1.2–1.3% | 1.4% |
| India | ~6.3% | 6.3–6.6% | 6.5% |
| Japan | 1.1–1.3% | 0.7–0.9% | 0.6–0.9% |
Sources: IMF WEO January 2026; OECD Economic Outlook December 2025; UN DESA WESP 2026
Discover more from The Economy
Subscribe to get the latest posts sent to your email.
Analysis
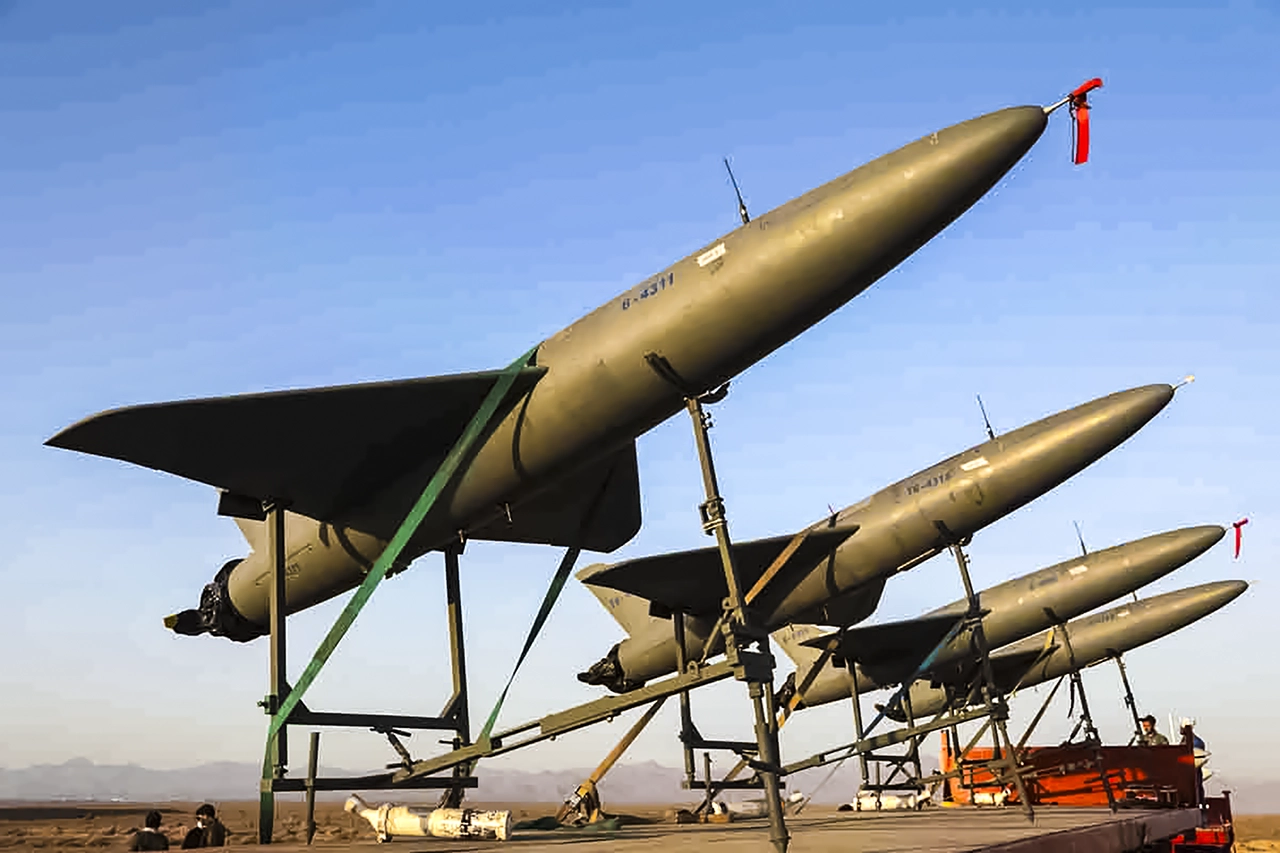
Iran’s Real Weapon Is the World Economy: How Missiles, Drones, Mines and Selective Maritime Disruption Are Reshaping Global Risk
When the White House quietly confirmed that US President Donald Trump would travel to Beijing on May 14 to 15, rescheduling a summit previously derailed by the sudden outbreak of the Iran war on February 28, it was more than a mere scheduling adjustment. It was a stark geopolitical admission. The delay revealed that this conflict in the Middle East is now structurally vast enough to disrupt the calendars of great powers, distort global markets, and force governments thousands of miles from the Persian Gulf to urgently rethink energy security, inflation, and supply-chain resilience.
For decades, military analysts have war-gamed a clash between Washington and Tehran through the sterile lens of conventional military metrics: ship counts, sortie rates, and air defense batteries. But as the events of the past month have demonstrated with chilling clarity, the central question of this conflict is no longer whether Iran can defeat the United States or Israel conventionally. They cannot, and they know it.
The real question is whether Tehran can make the economic price of continuing the war too high, too global, and too prolonged for the West to ignore. We are witnessing a masterclass in asymmetric warfare where Iran’s real weapon is the world economy. By deploying low-cost, high-impact tools, Tehran is proving that missiles, drones, mining threats and selective maritime disruption can be enough to make insurers, traders, shipowners and governments reprice risk across the entire globalized system.
Iran’s strategy is a meticulously calibrated economic coercion. Tehran is exploiting a rare combination of geography, target concentration and asymmetric tools to hold the global economic recovery hostage. And so far, the financial markets are proving them right.
The New Paradigm: Iran Asymmetric Economic Warfare
To understand the genius—and the terror—of Iran’s current playbook, one must discard the 20th-century notion that wars are won by destroying the enemy’s military formations. In a hyper-connected, hyper-optimized global economy, a nation does not need to sink a fleet to achieve strategic parity; it merely needs to make the cost of transit commercially unviable.
This is the essence of Iran asymmetric economic warfare. By utilizing swarms of cheap loitering munitions, unmanned surface vessels, and the persistent, invisible threat of naval mines, Tehran has fundamentally altered the cost-benefit analysis of navigating the world’s most critical maritime chokepoints. A $20,000 drone does not need to sink a $150 million Very Large Crude Carrier (VLCC) carrying $100 million worth of oil. It only needs to scorch its deck to trigger a systemic panic in the underwriting rooms of London and New York.
Tehran understands the fragility of the maritime arteries that sustain modern capitalism. This is why the recent entrance of Yemen’s Houthis into the broader conflict is so destabilizing. We are no longer looking at an isolated crisis in the Strait of Hormuz; we are facing a dual-chokepoint strangulation encompassing both Hormuz and the Bab el-Mandeb Strait. By targeting commercial vessels selectively—and reportedly floating a mafia-style “$2 million-per-ship fee” for guaranteed safe passage—Iran and its proxies are effectively levying a private tax on global trade.
This is not a traditional blockade. It is a protection racket scaled to the size of the global economy. Through Iran missiles drones mining global supply chains, Tehran is executing a strategy designed not to win a military victory, but to inflict a political and economic pain threshold that forces a diplomatic capitulation.
Repricing the Gulf: Iran Maritime Disruption Insurance
The immediate frontline of this new war is not the flight deck of a US aircraft carrier; it is the actuarial spreadsheets of global maritime insurers. The Strait of Hormuz disruption 2026 is triggering a seismic shift in how risk is priced, bought, and sold.
Prior to February 28, an estimated 20% of global oil consumption—roughly 21 million barrels per day—transited the Strait of Hormuz. Today, that volume has contracted sharply as shipping companies route around the cape or pause voyages entirely. For those that dare the passage, the financial toll is staggering. War-risk insurance premiums have skyrocketed, surging from a fraction of a percent of a vessel’s value to unsustainable single-digit percentages practically overnight.
As the Financial Times notes in its analysis of maritime risk, when Gulf shipping risk insurers repricing occurs at this velocity, the costs are immediately passed down the supply chain. Iran maritime disruption insurance is no longer a niche concern for shipping magnates; it is a direct inflationary tax applied to every commodity, manufactured good, and barrel of oil moving between East and West.
Data Visualization Context: [Chart: Oil Price Trajectory vs. Shipping Volumes Through Hormuz & Bab el-Mandeb Since Feb 28] – A diverging line graph illustrating the inverse relationship between plunging daily vessel transits in the Gulf and the sharp, unbroken ascent of Brent Crude prices crossing the $100 threshold.
This dynamic forces a profound recalibration of what constitutes “risk.” A shipowner looking at a 500% increase in war-risk premiums must decide if the cargo is worth the financial gamble. When the answer is no, vessels sit idle, supply chains freeze, and the global economy chokes. This is precisely what the architects in Tehran intended.
The Macro Shock: Inflation, Oil Trajectories, and Fed Paralysis
The ripple effects of this strategy are already crashing onto the shores of Western central banks. The Iran war oil prices impact has been immediate and violent. With US crude settling above the $100 mark and Brent eyeing a record monthly rise, the specter of the 1970s oil shocks has returned to haunt policymakers. The International Energy Agency (IEA) has already sounded the alarm, warning that we are teetering on the edge of the “largest supply disruption in history” if the conflict broadens to regional oil infrastructure.
This energy shock arrives at the worst possible macroeconomic moment. Just as the US Federal Reserve and the European Central Bank believed they had tamed the post-pandemic inflation dragon, the Gulf crisis has reignited price pressures. Federal Reserve Chair Jerome Powell recently signaled a “wait and see” approach regarding the war’s economic fallout, a subtle admission that the central bank is trapped. Raising interest rates to combat oil-driven inflation risks plunging the global economy into a deep recession; holding them steady risks allowing inflation to become entrenched.
The Economist recently highlighted the resurgence of stagflation fears, pointing out that a prolonged conflict exceeding three months will inevitably lead to deep macroeconomic scarring. By weaponizing the oil markets, Iran has effectively bypassed the Pentagon and launched a direct strike on the Federal Reserve. This is the zenith of Iran calibrated economic coercion 2026: forcing Western leaders into impossible domestic political dilemmas.
Target Concentration: The Outsized Impact on Asian Economies
While the geopolitical theater is fixated on the Washington-Tehran dynamic, the true economic victims of this asymmetric warfare reside in the East. The Strait of Hormuz closure economic impact on Asia cannot be overstated. The economies of China, Japan, India, and South Korea are fundamentally reliant on Middle Eastern crude and liquefied natural gas (LNG).
Tehran’s strategy capitalizes heavily on this “target concentration.” The overwhelming majority of the oil flowing through Hormuz is destined for Asian markets. Consequently, the disruption serves as a blunt instrument of leverage against the very nations that historically maintain neutral or even amicable relations with Iran.
The real-time fallout across the Indo-Pacific is stark. In Singapore, households are already facing immediate electricity tariff hikes for the April-June quarter, with the Energy Market Authority warning of sharper increases to come. Major logistics hubs are feeling the squeeze, with companies like Yeo Hiap Seng cutting headcount and moving operations to navigate the margin crush. Supply chains are fraying; luxury cars destined for Asian markets are stranded in Sri Lankan ports as Japanese shipping companies face paralyzing congestion.
To mitigate the crisis, Asian powers are scrambling for alternatives. Japan is hastily coordinating with Indonesia to secure thermal coal as a fallback for power generation, risking its climate commitments in the name of raw survival. Meanwhile, in a fascinating display of diplomatic fracture, Malaysia recently announced that its tankers would be exempt from Iran’s reported Hormuz toll—a testament to Kuala Lumpur’s pragmatic, long-standing relationship with Tehran.
This selective enforcement is the most insidious aspect of Iran economic coercion. By granting safe passage to some nations while punishing others, Tehran is attempting to divide the international community, making a unified coalition impossible. It forces Beijing and New Delhi to pressure Washington for a rapid de-escalation, effectively turning America’s vital trading partners into unwitting lobbyists for Iranian interests.
The Limits of Conventional Deterrence
The stark reality of 2026 is that traditional naval hegemony is insufficient to guarantee the free flow of global commerce. The US Navy, for all its unparalleled lethality, is designed to destroy state-level navies and project power ashore. It is not inherently designed to play an endless, unwinnable game of Whac-A-Mole against swarms of explosive drones launched from the backs of pickup trucks, or to sweep vast swathes of the Gulf for untethered acoustic mines.
As detailed by Foreign Affairs in their recent evaluation of Gulf security, attempting to solve an asymmetric economic problem with a symmetric military solution is a fool’s errand. Every Tomahawk missile fired at a fifty-dollar drone launch pad is a victory for Tehran’s arithmetic. The sheer cost imbalance heavily favors the instigator.
Furthermore, the secondary knock-on effects are paralyzing corporate strategy. Multinational giants are scaling back; consumer goods titans like Unilever have reportedly imposed global hiring freezes explicitly citing the Middle East war’s macroeconomic drag. Credit ratings agencies are recalibrating the sovereign debt of Gulf nations, with Fitch signaling downgrade risks for regional players due to post-war security environment uncertainties.
When global capital begins to view the entire Middle East as functionally un-investable and physically un-navigable, Iran’s objective is met. They do not need to plant a flag in Washington. They simply need to make the Dow Jones bleed until Washington offers terms.
Conclusion: Navigating a Repriced World
When Presidents Trump and Xi sit down in Beijing this May, the agenda will not merely be about tariffs, semiconductor export controls, or artificial intelligence dominance. The specter at the banquet will be the vulnerability of their shared globalized economy to asymmetric disruption. The Iran war of 2026 has irrevocably proved that the ultimate weapon of mass disruption is not nuclear; it is logistical.
We have entered an era where Iran’s real weapon is the world economy. The success of calibrated economic coercion means that future conflicts will increasingly mirror this blueprint. Rogue states and non-state actors alike have learned that by applying pressure to the delicate, over-optimized nodes of global supply chains, they can punch vastly above their geopolitical weight class.
The West cannot bomb its way out of an insurance crisis. Countering this new reality requires more than just deploying additional carrier strike groups. It demands a total reimagining of global supply-chain resilience, a rapid acceleration toward localized and diversified energy grids, and the painful acceptance that the era of friction-free, perfectly timed global shipping is over.
Until the world economy can insulate itself from the asymmetric leverage of chokepoint disruption, the true balance of power will not be measured in ballistic missiles or stealth fighters. It will be measured in the terrifyingly fragile mathematics of freight rates, risk premiums, and the price of a barrel of crude. The world has been repriced. We are all just paying the toll.
Discover more from The Economy
Subscribe to get the latest posts sent to your email.
-

 Markets & Finance3 months ago
Top 15 Stocks for Investment in 2026 in PSX: Your Complete Guide to Pakistan’s Best Investment Opportunities
-

 Analysis2 months ago
Brazil’s Rare Earth Race: US, EU, and China Compete for Critical Minerals as Tensions Rise
-

 Banks3 months ago
Best Investments in Pakistan 2026: Top 10 Low-Price Shares and Long-Term Picks for the PSX
-

 Investment3 months ago
Top 10 Mutual Fund Managers in Pakistan for Investment in 2026: A Comprehensive Guide for Optimal Returns
-

 Analysis2 months ago
Top 10 Stocks for Investment in PSX for Quick Returns in 2026
-

 Asia3 months ago
China’s 50% Domestic Equipment Rule: The Semiconductor Mandate Reshaping Global Tech
-

 Global Economy3 months ago
Pakistan’s Export Goldmine: 10 Game-Changing Markets Where Pakistani Businesses Are Winning Big in 2025
-

 Global Economy3 months ago
15 Most Lucrative Sectors for Investment in Pakistan: A 2025 Data-Driven Analysis