
Analysis
Pakistan’s Remittance Mirage : When Foreign Inflows Mask Structural Fragility

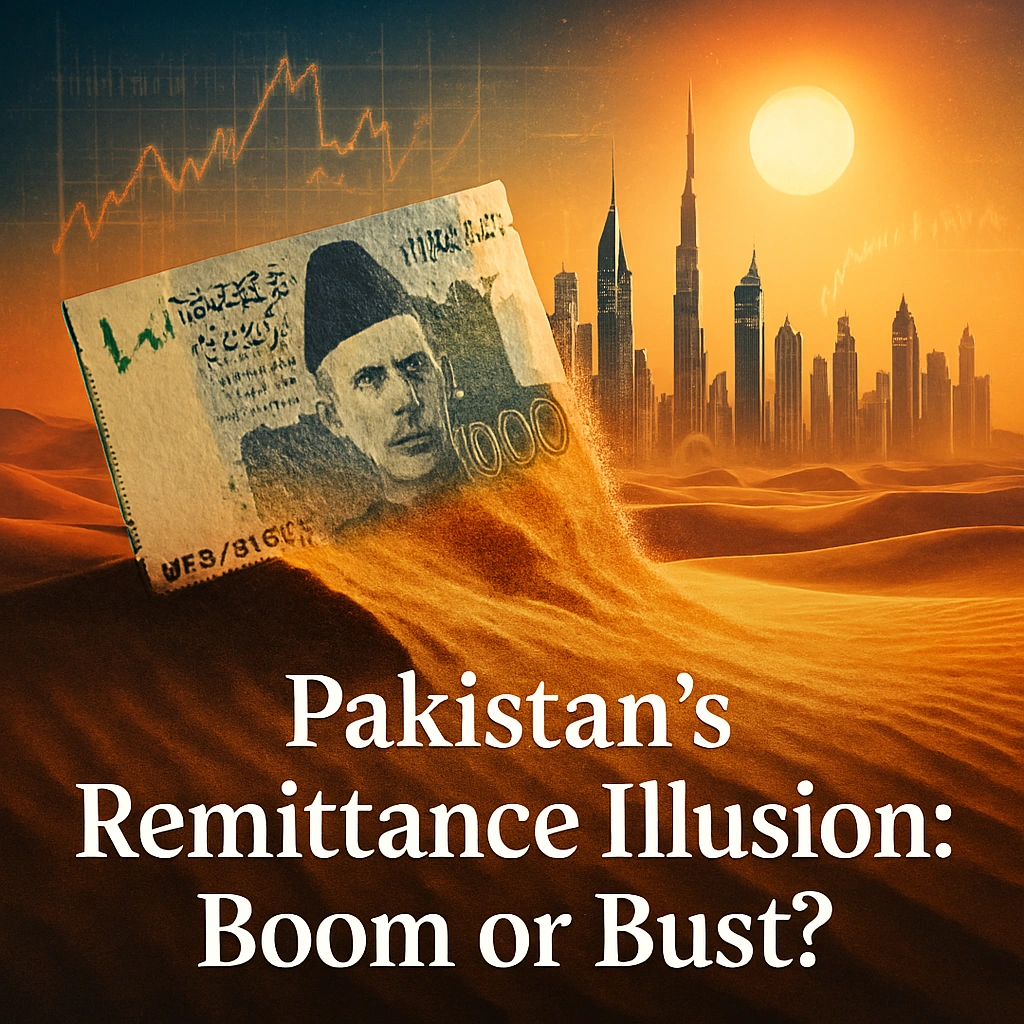
On a balmy December afternoon in Karachi’s money exchange district, the electronic tickers flash a reassuring message: remittances hit $3.2 billion in November 2025, up 9.4% year-on-year Daily Pakistan. Finance officials tout record inflows. Headlines celebrate projections of $41 billion for fiscal year 2026 The Nation. Yet beneath this gleaming surface lies an inconvenient truth—Pakistan’s apparent macroeconomic stability rests on a foundation as fragile as morning mist over the Arabian Sea.
Imagine constructing a house on sand. From a distance, it appears solid, even impressive. But when the tide turns—when geopolitical winds shift or oil prices tumble—the entire structure threatens to collapse. This is Pakistan’s economic reality in early 2026: a transfer-led recovery masquerading as sustainable growth, propped up by remittances that now constitute a dangerously elevated share of national income while exports languish in stagnation.
The Remittance Surge: Impressive Numbers, Precarious Foundations
The data tells a compelling story—at first glance. Pakistan received $19.7 billion in remittances during the first half of fiscal year 2026, marking an 11% year-on-year increase The Nation. For fiscal 2025, the total reached $38.3 billion, representing a 27% surge Arab News over the previous year. These inflows have become Pakistan’s economic lifeline, now representing approximately 7-8% of GDP according to recent government statements, with some estimates placing the figure closer to 9-10% when accounting for the latest GDP revisions.
Compare this to regional peers and the disparity becomes stark. India’s remittances constitute just 3.5% of GDP, while Bangladesh stands at 6.1% World Bank according to World Bank data. Pakistan’s reliance has grown steadily over the past two decades—from roughly 4% in the early 2000s to today’s elevated levels—turning what should be a supplementary income source into the primary shock absorber for external accounts.
The State Bank of Pakistan’s latest monthly data provides granular insight into this dependency. In November 2025, Saudi Arabia led with $753 million, followed by the UAE at $675 million, the UK at $481 million, and the US at $277 million Arab News. These four corridors alone account for nearly 70% of total inflows, creating a concentration risk that policymakers have yet to adequately address.
Geographic Concentration: The Gulf Dependency Trap
Here’s where the mirage becomes most apparent. Research from the International Organization for Migration reveals that Saudi Arabia and the UAE together account for approximately 50% of remittance inflows to Pakistan Displacement Tracking Matrix, with the broader Gulf Cooperation Council region contributing roughly 65% of the total. This geographic concentration exposes Pakistan to external shocks beyond its control—oil price volatility, labor policy shifts in host countries, regional instability, or economic downturns in the GCC economies.
Consider the counterfactual: If Saudi Arabia were to implement labor nationalization policies similar to those periodically discussed in the Kingdom, or if UAE construction demand were to cool significantly, Pakistan could see remittances decline by 20-30% within a single year. Analysis from The Express Tribune notes that remittances from GCC countries excluding Saudi Arabia and UAE saw a steep 16.1% month-on-month decline The Express Tribune in certain periods, highlighting the volatility embedded in these flows.
The problem intensifies when examining workforce composition. According to Bureau of Emigration and Overseas Employment data, Saudi Arabia hosted 50% of Pakistani workers registered for overseas employment in 2023, totaling almost 427,000 individuals, while the UAE accommodated approximately 230,000 workers Displacement Tracking Matrix. This workforce is predominantly low to semi-skilled labor in construction, services, and domestic work—sectors highly sensitive to economic cycles and policy changes in host countries.
Contrast this with India’s diaspora, which includes a substantial proportion of high-skilled professionals in technology, finance, healthcare, and engineering, particularly in the United States and Europe. The UN Department of Economic and Social Affairs notes that the growing share of high-skilled Indian workers in STEM fields has translated into higher remittances per worker United Nations, creating more stable and resilient inflow patterns.
The Export Stagnation Crisis: Where Pakistan Falls Behind
While remittances soar, Pakistan’s export engine has sputtered to a near-standstill, creating an alarming divergence that underscores the economy’s structural imbalances. Merchandise exports plunged by more than 20% in December 2025, falling to about $2.32 billion, while over the first half of fiscal year 2025-26, exports declined by nearly 9% to approximately $15.18 billion Daily Times.
The World Bank’s recent Pakistan Development Update delivered a sobering assessment: Pakistan’s exports are significantly below their potential, with a gap of nearly $60 billion, and the country’s export share in GDP has steadily declined from 16% in the 1990s to just 10.4% in 2024 Profit by Pakistan Today. This deterioration places Pakistan far behind regional competitors—Vietnam’s export-to-GDP ratio approaches 95%, Thailand’s sits around 60%, and even Bangladesh manages approximately 20%.
What explains this divergence? Multiple structural factors compound the problem:
High Tariff Barriers: Despite the government’s approval of a National Tariff Plan aiming to reduce the simple average tariff from 20.2% to 9.7% by 2030, Pakistan’s protective tariff regime has historically insulated inefficient domestic industries while raising input costs for exporters.
Energy Cost Disadvantage: Manufacturers face electricity tariffs significantly higher than competing economies, eroding competitiveness in energy-intensive sectors like textiles and chemicals.
Logistics Inefficiencies: Poor infrastructure, bureaucratic red tape, and supply chain bottlenecks add 15-20% to export costs according to industry estimates.
Lack of Product Diversification: Pakistan’s export basket remains concentrated in low-value textiles and garments, with insufficient movement into higher-value manufacturing or services.
The result? Pakistan imports more than it exports, running persistent trade deficits. The first six months of FY26 saw imports grow more than 11%, swelling the half-year trade deficit by over 34% to approximately $19.2 billion Daily Times. Remittances essentially finance consumption of imported goods rather than supporting productive investment or export capacity building—a textbook definition of unsustainable growth.
Manufacturing’s False Dawn: Growth Without Investment
Economic authorities point to manufacturing sector recovery as evidence of broader revival. The numbers appear encouraging on the surface. Pakistan’s Large Scale Manufacturing Index increased by 10.4% year-over-year in November 2025, with the first five months of FY26 showing 6% growth ProPakistani. The automobile sector has been particularly strong, with 79% year-on-year growth in October 2025 Profit by Pakistan Today.
But look closer and the picture darkens. This manufacturing rebound is largely driven by import substitution rather than competitive production. As imports became more expensive due to rupee depreciation and administrative controls, consumers shifted to domestically produced goods—not because Pakistani manufacturers became more competitive, but because imports became less accessible.
Several indicators expose this as a demand-side illusion rather than supply-side strength:
Underutilized Capacity: Surveys from industrial clusters in Karachi, Lahore, and Faisalabad reveal factories operating well below optimal capacity, with many on the brink of closure due to high input costs and limited access to working capital.
Investment Drought: Gross fixed capital formation remains anemic. Private sector credit for manufacturing investment has not translated into significant capacity expansion or technology upgrades.
Productivity Stagnation: Labor productivity in manufacturing has barely improved, reflecting the absence of automation, skills upgrading, or process innovation.
Sectoral Imbalances: While automobiles, cement, and basic consumer goods show growth, higher-value sectors like pharmaceuticals, machinery, and chemicals continue declining, as evidenced by the mixed sectoral performance in LSM data.
The manufacturing “recovery” therefore represents a consumption-led bump rather than an investment-led transformation. It’s economic activity sustained by remittance-fueled domestic demand, not export competitiveness or productivity gains.
Administrative Fixes and the Illusion of Stability
Much of Pakistan’s recent macroeconomic stabilization stems from administrative measures rather than structural reforms. The government’s crackdown on currency smuggling and informal hawala networks successfully channeled remittances into formal banking channels, creating the appearance of surging inflows when much of the increase simply represents previously unrecorded flows now captured in official statistics.
Authorities implemented a crackdown on unofficial buying or selling of dollars, contributing to the 34% year-on-year remittance increase Bloomberg in certain periods. While reducing parallel market premiums is laudable, it doesn’t create new foreign exchange—it merely makes existing flows visible.
Similarly, anti-smuggling drives reduced illicit trade in consumer goods, temporarily boosting domestic manufacturing and tax revenues. But these are one-time gains from enforcement, not permanent improvements in competitiveness or productivity.
The fundamental structural issues remain unaddressed:
- Energy sector circular debt continues accumulating despite cosmetic reforms
- State-owned enterprises drain fiscal resources without privatization or efficiency gains
- Tax-to-GDP ratio remains stubbornly low, limiting infrastructure investment
- Regulatory uncertainty and policy inconsistency deter foreign direct investment
- Human capital development lags, with low education spending and skills mismatches
The Human Capital Drain: Migration as Economic Coping Mechanism
Perhaps most troubling is what the remittance surge actually represents: a mass exodus of working-age Pakistanis seeking opportunity abroad because domestic economic conditions offer insufficient prospects. Over the past 17 years, nearly 10 million Pakistanis have emigrated, draining the country of talent, ambition, and productive capacity.
More than 762,000 Pakistanis proceeded abroad for employment in 2025, mainly to Gulf countries The Nation. These departures represent lost domestic economic activity, reduced entrepreneurship, and foregone innovation. While their remittances provide short-term foreign exchange relief, the long-term cost is a hollowed-out domestic economy.
Younger generations of overseas Pakistanis, born and raised abroad, may feel diminishing connection to extended family back home, potentially reducing remittance flows over time. What happens when the second and third generation diaspora no longer maintains strong enough ties to send money regularly? Pakistan faces a demographic time bomb in its remittance model.
Comparative Context: Learning from Regional Peers
Bangladesh offers an instructive comparison. Bangladesh’s remittances stood at 5.26% of GDP in 2023 TheGlobalEconomy.com, lower than Pakistan’s despite having a comparably large diaspora. The difference? Bangladesh has successfully built export-oriented manufacturing, particularly in garments, creating 4 million direct jobs and driving genuine economic transformation. When remittances constitute a smaller share of GDP, the economy is less vulnerable to external shocks in host countries.
India demonstrates another model. Despite being the world’s largest remittance recipient in absolute terms, inflows represent just 3.5% of GDP because India has a massive domestic economy, diversified exports, and thriving services sectors including IT and business process outsourcing. India’s IT exports alone exceeded $194 billion in recent years—more than five times Pakistan’s total exports of goods and services.
Vietnam provides perhaps the starkest contrast. With exports approaching 95% of GDP, Vietnam has integrated into global value chains, attracted substantial foreign direct investment, and achieved sustained high growth rates. Vietnamese manufacturing for export markets created millions of jobs and drove rapid income growth, demonstrating the superiority of export-led development over remittance-dependent models.
The Fiscal and Monetary Policy Bind
Pakistan’s remittance dependency creates serious policy constraints. The State Bank of Pakistan must maintain exchange rate stability to encourage formal channel remittances, but this limits monetary policy flexibility. Aggressive rupee depreciation would boost export competitiveness but might discourage remittances by reducing their domestic purchasing power.
Fiscally, the government has become addicted to remittance inflows to finance current account deficits rather than addressing underlying export weaknesses. This creates moral hazard—policymakers can avoid painful structural reforms because remittances provide temporary breathing room.
The International Monetary Fund’s Extended Fund Facility program provides external discipline, but even IMF conditionalities focus primarily on fiscal consolidation, inflation control, and reserve adequacy rather than fundamental export competitiveness and productivity enhancement.
Forward-Looking Risks: When the Tide Recedes
Several scenarios could puncture Pakistan’s remittance mirage:
Oil Price Collapse: If global oil prices decline significantly, GCC economies would face fiscal pressure, potentially reducing construction activity and foreign worker demand. Pakistani remittances could fall 20-30% within 12-18 months.
Geopolitical Disruption: Regional conflict, policy changes in host countries, or diplomatic tensions could rapidly reduce workforce opportunities. Saudi Arabia’s Vision 2030 emphasizes labor force nationalization, which could gradually reduce demand for foreign workers.
US Remittance Tax: The United States announced a 1% tax on remittances effective January 2026, which preliminary research estimates could reduce remittance flows by about 1.6% United Nations. If other countries follow suit, cumulative effects could be substantial.
Generational Shift: As mentioned earlier, second and third generation diaspora members typically send less money home, creating a natural decline trajectory in remittance intensity over time.
Economic Slowdown in Host Countries: Recessions in major host economies reduce migrant worker income and remittance sending capacity. The 2008-2009 global financial crisis temporarily reduced remittances to many developing countries.
Policy Prescriptions: Building Beyond Remittances
Breaking free from remittance dependency requires comprehensive structural reforms:
Export Transformation: Implement the National Tariff Plan aggressively, reduce energy costs through subsidy reform and efficiency gains, invest in logistics infrastructure, and provide targeted export financing and market access support.
Industrial Policy Reset: Focus on value-added manufacturing and services rather than import substitution. Attract foreign direct investment through special economic zones with streamlined regulations, reliable energy, and skilled labor availability.
Skills Development: Align education and vocational training with global labor market demands. While sending workers abroad will continue, ensuring they can access higher-paying skilled positions generates more sustainable remittance streams.
Diaspora Engagement: Beyond remittances, tap diaspora expertise, investment capital, and networks. Create diaspora bonds, facilitate knowledge transfer, and encourage business partnerships.
Macroeconomic Stability: Maintain fiscal discipline, control inflation, and ensure exchange rate competitiveness without excessive volatility. Predictable policy environments attract investment and encourage export production.
Governance and Institutions: Reform state-owned enterprises, improve ease of doing business, strengthen contract enforcement, and reduce corruption. Institutional quality matters more than any single policy intervention.
Conclusion: Recognizing Reality, Charting a New Course
Pakistan’s record remittances are simultaneously a blessing and a curse—providing crucial foreign exchange but enabling continued avoidance of fundamental economic reforms. Like a house built on sand, the current structure appears impressive but lacks the foundation for sustained prosperity.
The path forward requires honest acknowledgment that remittance-led stability is not equivalent to export-led growth. Pakistan must leverage its current macroeconomic breathing room not for complacency but for aggressive structural transformation. This means politically difficult choices: reducing tariffs that protect inefficient industries, reforming energy pricing to eliminate subsidies, privatizing loss-making state enterprises, and investing in education and infrastructure even when fiscal space is tight.
The alternative is a continued boom-bust cycle—short periods of remittance-fueled stability punctuated by balance of payments crises whenever external conditions deteriorate. Pakistan deserves better than this treadmill. Its talented, hardworking population deserves an economy that creates opportunity at home rather than forcing millions to seek it abroad.
The remittance mirage will eventually dissipate. The question is whether Pakistan will use this moment to build genuine economic foundations or allow itself to be caught unprepared when the next storm arrives. The data, the trends, and the comparative evidence all point toward an urgent need for transformation. Whether political economy and vested interests permit such transformation remains the defining question for Pakistan’s economic future.
Discover more from The Economy
Subscribe to get the latest posts sent to your email.



Key Takeaways
- Rolex’s secondary market rose approximately 7.9% year-over-year as of 2026 (per WatchCharts data) — trailing Patek Philippe (+16.2%) and Tudor (+11.4%) but still outperforming Audemars Piguet (+3.4%).
- Rolex raised U.S. retail prices 4–9% in January 2026 (steel models ~5.6%, gold models ~8.7%), narrowing the historical gap between retail and pre-owned pricing.
- Not every model appreciates: steel sports references (Submariner, GMT-Master II, Daytona) have held value far better than two-tone or widely available dress references like the standard Datejust.
- The Lady-Datejust posted the sharpest 2026 gain among tracked collections — up 22.73%, from roughly $9,269 to $11,376 — driven by demand for smaller, “everyday luxury” watches.
- Gold’s rise past $2,400/oz has directly lifted the investment case for Rolex’s precious-metal references (Day-Date, Sky-Dweller, Yacht-Master).
The Model-by-Model Picture
| Category | 2026 Trend |
|---|---|
| Lady-Datejust | +22.73% (strongest performer among tracked collections) |
| Steel sports models (Submariner, GMT-Master II) | Held value well; corrected from 2022 peak but stabilized above retail |
| Daytona | Corrected from highs above $50,000 to the mid-$30,000s; still among the most sought-after references |
| Two-tone/widely available Datejust | Flat to negative — “holds value” is an overstatement for this category |
| Gold references (Day-Date, Sky-Dweller) | Lifted by gold’s rise above $2,400/oz |
Why the “Rolex Always Appreciates” Myth Is Fading
The pandemic-era boom pushed some references — the Daytona above all — to speculative highs disconnected from historical norms. Since the March 2022 peak, steel sports models have compressed meaningfully, and dealers who bought inventory near the top have in some cases faced 20–40% markdowns on liquidation. The lesson for 2026 buyers: Rolex as a category is not a monolith. Value retention depends heavily on specific reference, condition, and whether the piece comes with box and papers (“full set”).
What’s Actually Driving 2026 Strength
- Retail price increases raise the floor. When a new Submariner retails at $10,050 (up from $9,500), a pre-owned example at $11,000–$12,000 suddenly represents a smaller premium — narrowing the gap without secondary prices actually moving.
- Supply discipline remains Rolex’s core lever. The brand has never confirmed production numbers, and secondary-market premiums remain entirely a function of Rolex’s own manufacturing decisions — a risk factor as much as a support.
- Certified Pre-Owned rollout. Rolex’s now fully rolled-out CPO program has changed how buyers transact in the used market, adding a layer of brand-verified legitimacy that supports pricing.
The Case for Rolex as a Portfolio Diversifier
Financial advisors increasingly frame luxury watches not as a replacement for equities or bonds, but as a tangible, historically low-correlation diversifier — one that carries its own risks (illiquidity, condition-dependent pricing, no yield) but has demonstrated multi-decade resilience for specific references.
Is Rolex a good investment in 2026?
It depends heavily on the specific reference. Steel sports models like the Submariner and Daytona have held or grown in value; two-tone and widely available dress models generally have not. Overall, Rolex’s secondary market rose about 7.9% year-over-year in 2026, trailing Patek Philippe but ahead of Audemars Piguet.
Discover more from The Economy
Subscribe to get the latest posts sent to your email.

Navigating Mortgage and Loan Refinancing in a High-Yield Environment
Global public debt crossing critical thresholds has kept central bank policies volatile, resulting in fluctuating US Treasury yields throughout 2026. For homeowners and commercial property holders burdened by previous high-interest borrowing cycles, finding optimal refinance windows has become a high-stakes financial puzzle. Stalled disinflation and stubborn employment numbers mean rate cuts are incremental, requiring borrowers to act with precision.
Timing your mortgage or commercial loan refinance in this environment requires a deep understanding of yield curve movements and lender risk appetites.
Decoding 2026 Refinance Dynamics
The 10-Year Treasury Yield Benchmark
Mortgage rates continue to track closely with the 10-year US Treasury yield. When macroeconomic anxiety spikes debt issuance, yields rise, tightening consumer borrowing capacity. Savvy borrowers monitor weekly Treasury auctions to lock in rates during brief dip windows.
Hybrid ARMs and Alternative Structures
With fixed rates remaining elevated, 7/1 and 10/1 adjustable-rate mortgages (ARMs) have surged in popularity. These products offer lower initial monthly payments, giving borrowers breathing room until central bank easing cycles fully materialize.
| Loan Product | Current Rate Range | Best For | Key Risk Factor |
| 30-Year Fixed Mortgage | 6.2% – 6.8% | Long-term predictability | Higher initial monthly outlay |
| 7/1 Hybrid ARM | 5.5% – 5.9% | Short-term ownership / flipping | Rate reset risk after year 7 |
| Commercial Refinance | 7.0% – 8.2% | Corporate asset restructuring | Strict DSCR lender covenants |
Actionable Steps for Successful Refinancing
To maximize your chances of securing favorable refinance terms in a volatile market, follow a disciplined preparation strategy.
Boost Your Credit Score Immediately: Lenders in 2026 are applying stringent credit tiering; a 20-point increase can drop your APR by a crucial quarter-point.
Shop Regional Credit Unions: Smaller financial institutions often offer portfolio loans with more flexible underwriting than major national banks.
Calculate the Break-Even Point: Ensure your total closing costs are recouped through monthly savings within 24 months of closing.
“Market Strategist View: Refinancing in 2026 is an exercise in opportunistic timing. Borrowers must maintain immaculate financial profiles ready to strike the moment Treasury yields dip.”
Mastering the complexities of today’s debt environment ensures you can successfully lower your debt service costs and protect your long-term financial stability.
Discover more from The Economy
Subscribe to get the latest posts sent to your email.

The days of pulling generic auto insurance quotes based purely on your zip code and age are officially over. In 2026, insurance comparison engines are powered entirely by generative AI and real-time telematics. These platforms digest thousands of live data points—ranging from your driving smoothness via connected vehicle sensors to real-time traffic congestion patterns—to generate hyper-personalized premiums instantly.
For consumers, this evolution represents both a massive opportunity for savings and a hidden trap for penalty pricing. Understanding how AI algorithms evaluate risk is essential for anyone looking to lower their monthly auto insurance premiums.
How AI Comparison Engines Evaluate Your Risk Profile
Behavioral Telematics and Connected Cars
Modern cars stream performance data directly to insurance aggregators. Generative AI models analyze braking sharpness, acceleration curves, cornering G-forces, and phone distraction metrics. Drivers who maintain smooth, defensive habits are rewarded with dynamic rate cuts of up to 40% compared to traditional rating tiers.
Predictive Traffic and Weather Modeling
AI tools now cross-reference your daily commute route with predictive weather and accident probability models. If your standard parking location or driving corridor has a statistically higher incidence of uninsured motorist claims, your quotes will reflect that hyper-local risk assessment.
| Comparison Factor | Traditional Rating Model | 2026 Generative AI Model | Impact on Premium |
| Mileage & Usage | Annual estimated odometer reading | GPS tracking & live trip duration | High (up to 35% savings) |
| Driving Behavior | MVR driving record & accidents | Real-time braking, speed, & G-force | Critical (determines tier) |
| Vehicle Tech | Make, model, and safety rating | ADAS calibration & repair cost data | Moderate |
Strategies to Lower Your AI-Driven Insurance Quote
To outsmart the algorithm and secure the lowest possible premium in 2026, drivers must proactively manage their digital footprint on insurance platforms.
Opt-In for Telematics Trial Periods: Many insurers offer immediate 15% discounts just for installing their driving app; let it track safe habits for 30 days to lock in permanent savings.
Scrub Unverified Public Records: Ensure your motor vehicle report is free of clerical errors that AI risk models misinterpret as reckless behavior.
Compare AI Aggregators: Use platforms that integrate multi-carrier API feeds rather than single-brand comparison sites to find the best risk-adjusted rate.
“Industry Note: AI-driven pricing rewards transparency and precision. Drivers who actively manage their telematics data consistently out-save those relying on legacy quote calculators.”
Embracing AI comparison tools allows savvy policyholders to customize coverage limits precisely to their driving habits, eliminating wasted premium spend while ensuring robust protection.
Discover more from The Economy
Subscribe to get the latest posts sent to your email.

Solar Panel Installation Cost in 2026: Why the Math Changed Overnight

Business Insurance: What Coverage You Actually Need and What It Costs in 2026

Auto Insurance Quotes: How to Get the Lowest Rate Without Losing Coverage

Huntington Online Banking: Full Features, Fees, and How It Compares in 2026

Apply for a Bank Account Online: What You Need and How Long It Actually Takes

World’s Largest Economies: Ranking the Top Global Powers

Business Loan: A Complete 2026 Guide to Rates, Types, and Qualifying

Fast Invoice Factoring: How to Turn Unpaid Invoices Into Cash Within 24 Hours

Investment Banking Services: What They Cost and How to Choose the Right Firm in 2026

Structured Settlement Loan: What “Cash Now” Offers Actually Cost You

DUI Attorney: Why Your First Call After an Arrest Should Never Be to the Court

Personal Injury Lawyer: A Complete Guide to Filing Your Claim in 2026

Commercial Vehicle Accident Lawyer: Holding Companies Accountable Beyond the Driver

Inside the White House Feud: How Trump’s Allies Are Painting Anthropic’s Dario Amodei as the Face of ‘AI Doomerism’

Top 30 Stocks for Investment in PSX for Massive ROI in 2026

SpaceX Starship Flight 14: First Orbital Attempt & Starlink V3 Launch Explained

Oil Prices Break $100 in 2026: Middle East Conflict & Energy Markets

Fidelity Investments Review 2026: SPAXX Yields & Zero-Fee Funds

AI Chip Stocks 2026: The Best Semiconductor Investments Beyond Marvell

BRICS+ Cross-Border Payments 2026: Interoperability Explained

Tween Back-to-School Trends 2026: What’s Driving the $85B Season

10-Year Treasury Yield Hits 4.80%: What It Means for Rates & Portfolios

Shein Clothes Quality & Safety in 2026: What Lab Tests Show

China’s US$10.8 Billion Trade Shortcut: Why the Pinglu Canal Matters

MRVL Earnings 2026: Why Marvell Sank Despite Beating Estimates

IMF & World Bank 2026 Global Economic Outlook: Growth, Inflation, Debt

High-CPM Finance Niches 2026: Publisher Monetization Blueprint

Middle East War Economics 2026: Oil Prices & Energy Markets
-

 Markets & Finance9 months ago
Top 15 Stocks for Investment in 2026 in PSX: Your Complete Guide to Pakistan’s Best Investment Opportunities
-

 Analysis7 months ago
Johor’s Investment Boom: The Hidden Costs Behind Malaysia’s Most Ambitious Economic Surge
-

 Analysis7 months ago
Top 10 Stocks for Investment in PSX for Quick Returns in 2026
-

 Banks8 months ago
Best Investments in Pakistan 2026: Top 10 Low-Price Shares and Long-Term Picks for the PSX
-

 Analysis8 months ago
Brazil’s Rare Earth Race: US, EU, and China Compete for Critical Minerals as Tensions Rise
-

 Investment9 months ago
Top 10 Mutual Fund Managers in Pakistan for Investment in 2026: A Comprehensive Guide for Optimal Returns
-

 Global Economy9 months ago
15 Most Lucrative Sectors for Investment in Pakistan: A 2025 Data-Driven Analysis
-

 Global Economy9 months ago
Pakistan’s Export Goldmine: 10 Game-Changing Markets Where Pakistani Businesses Are Winning Big in 2025