
Inflation
Why Pakistan’s Inflation Is Still Near 10% Despite Economic Stabilisation

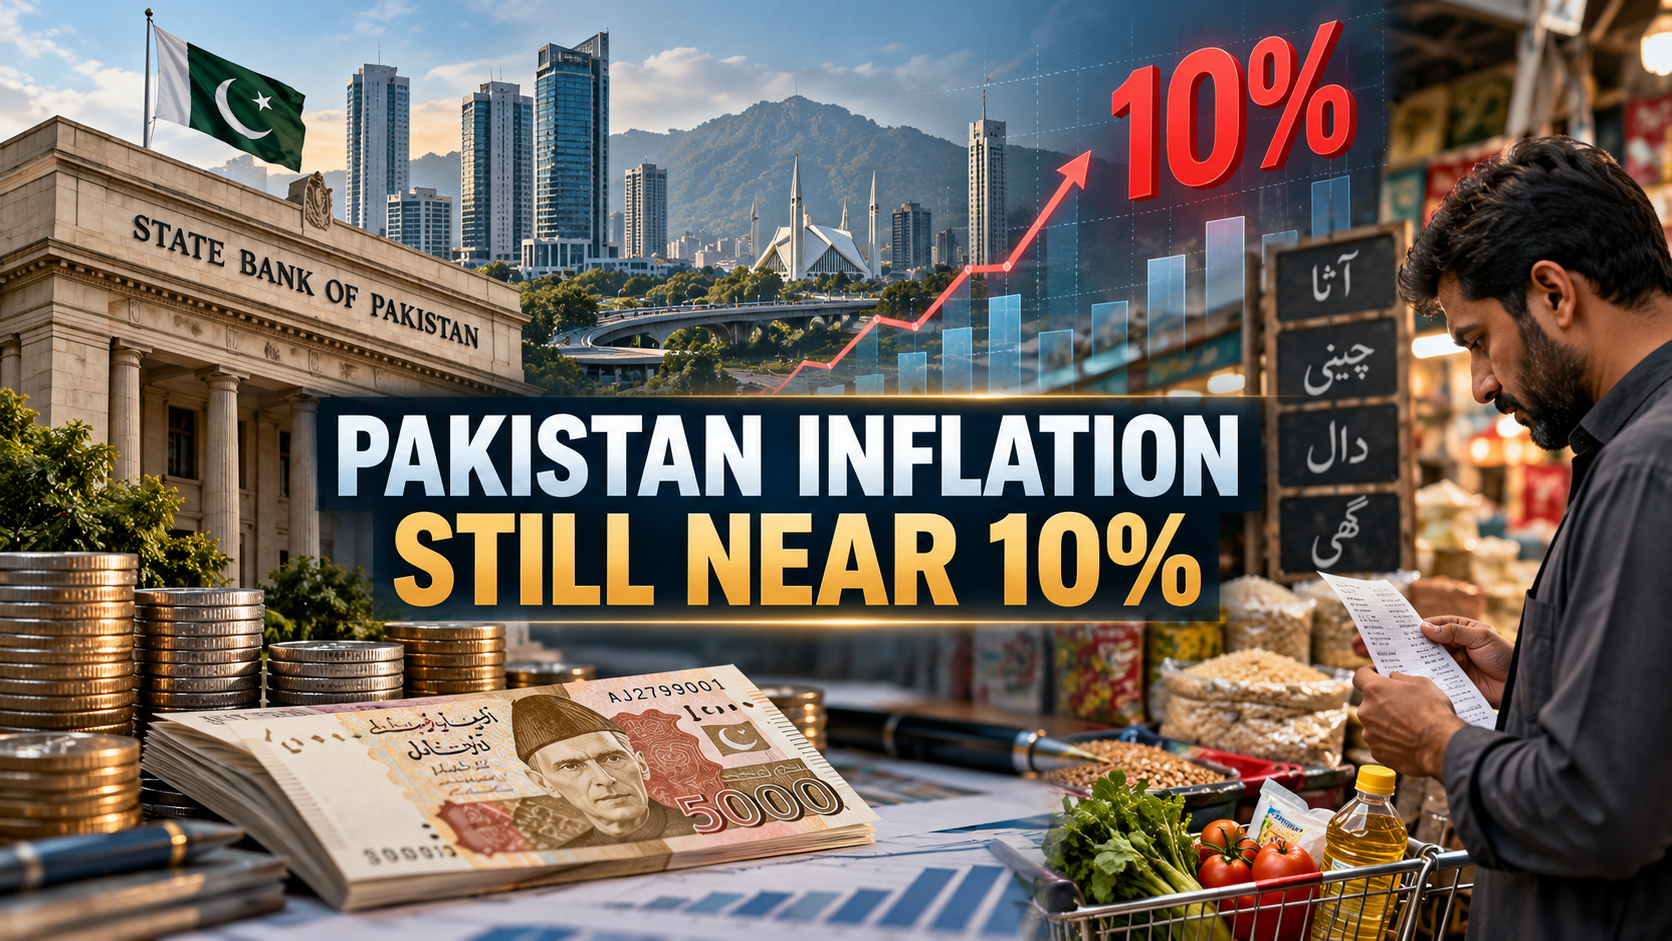
Key Takeaways
- The IMF projects inflation of 9.9% for FY2026-27, which means prices are still rising much faster than most households would like.
- Energy import costs, exchange-rate moves, and global oil prices are the main drivers, and the government controls only some of them.
- Stabilisation has stopped the crisis from getting worse, but it has not yet brought prices back to comfortable levels.
- Lower inflation would most help people on fixed incomes, shopkeepers with thin margins, and workers whose wages lag behind food and fuel costs.
Pakistan’s economy has stopped sliding, but that is not the same as recovering. Inflation is still close to 10%, which means a basket of goods that cost 100 rupees a year ago now costs about 110. The IMF’s latest projection for FY2026-27 is 9.9%, so the state does not expect a sharp drop soon.
The reason is simple to describe and harder to fix. Pakistan imports much of its energy, pays for it in dollars, and passes the cost to households through fuel and electricity prices. When the rupee weakens or global oil rises, prices follow quickly. When they fall, the relief arrives more slowly.
Energy Is the Biggest Lever
Oil and gas make up a large share of Pakistan’s import bill. Each time the price of crude moves in global markets, the cost of petrol, diesel, and power changes at home. Transport costs then ripple through to food, because trucks carry vegetables, flour, and cooking oil across the country.
Think of a bus fare in Lahore. When diesel rises, the operator asks for more per trip. The vegetable seller at the next stop pays more to bring stock to market, so tomato prices climb too. Nobody decided that tomatoes should cost more. The energy bill did the deciding.
The Exchange Rate Problem
A weaker rupee makes imports more expensive in rupee terms. That includes fuel, machinery, medicines, and raw materials for factories. Exporters can benefit from a cheaper currency, but households and importers feel the pain first.
Policy has tried to manage this by holding the rupee within a controlled range. That approach limits sudden shocks, but it can also leave the currency overvalued in some periods, which hurts exporters. The balance between stability and competitiveness is one of the hardest choices facing policymakers.
What the IMF Projects
The IMF’s projection of 9.9% inflation and 3.5% growth for FY2026-27 tells a specific story. The economy is expected to expand modestly while prices stay high. Growth at that pace is not enough to create jobs quickly for a population that keeps growing.
The projection also depends on assumptions about oil prices, exchange rates, and fiscal discipline. If oil stays above current levels, inflation could stay higher for longer. If it falls, the outlook improves, but the government still needs to collect enough revenue to avoid borrowing more.
Where Economists Disagree
Some analysts argue that inflation will fall steadily once the effects of past currency moves pass through. Others warn that energy subsidies, circular debt in the power sector, and tax increases keep pushing prices up. Both views have evidence behind them, and the outcome will depend on which pressure proves stronger.
It is fair to say that inflation expectations matter. If businesses and workers expect prices to keep rising, they set prices and wages higher, which makes inflation harder to bring down.
What This Means for You
If your income rises slowly, focus on the categories where prices move most: food, fuel, and power. Track your own spending for three months to see where your money actually goes. A household budget built on real numbers is more useful than a general rule.
If you run a small shop, watch your supplier costs closely and review prices at least monthly. Passing on costs too late can hurt cash flow, and passing them on too quickly can cost you customers.
What to Watch Next
- Monthly consumer price index releases from the Pakistan Bureau of Statistics.
- State Bank of Pakistan policy rate decisions, which influence borrowing costs and inflation expectations.
- Global oil price movements and any changes to domestic petroleum pricing.
- The next IMF programme review, which will test whether the inflation path matches the projection.
Confirm each date on the official calendars before you plan around it.
Frequently Asked Questions
Why is inflation still high if the economy has stabilised?
Stabilisation means the most acute crisis has eased. It does not mean prices have fallen. Past currency falls and energy costs continue to work their way into shop prices over time.
Does the exchange rate cause inflation? It is one important cause. When the rupee weakens, imported goods and fuel cost more in local currency, and those costs spread across the economy.
Will inflation fall to pre-crisis levels soon?
Not on current projections. The IMF’s FY2026-27 figure of 9.9% suggests prices will stay elevated for some time.
What can households do right now?
Focus on fixed costs such as power and transport, compare prices across suppliers, and review any income-linked support you may qualify for.
Conclusion
Inflation near 10% is the price of a fragile recovery, and it will not disappear with one good month of data. The real test is whether energy, the currency, and public finances move in the same direction for long enough to lower prices. Watch the monthly CPI, and you will see the trend before the headlines do.
Discover more from The Economy
Subscribe to get the latest posts sent to your email.


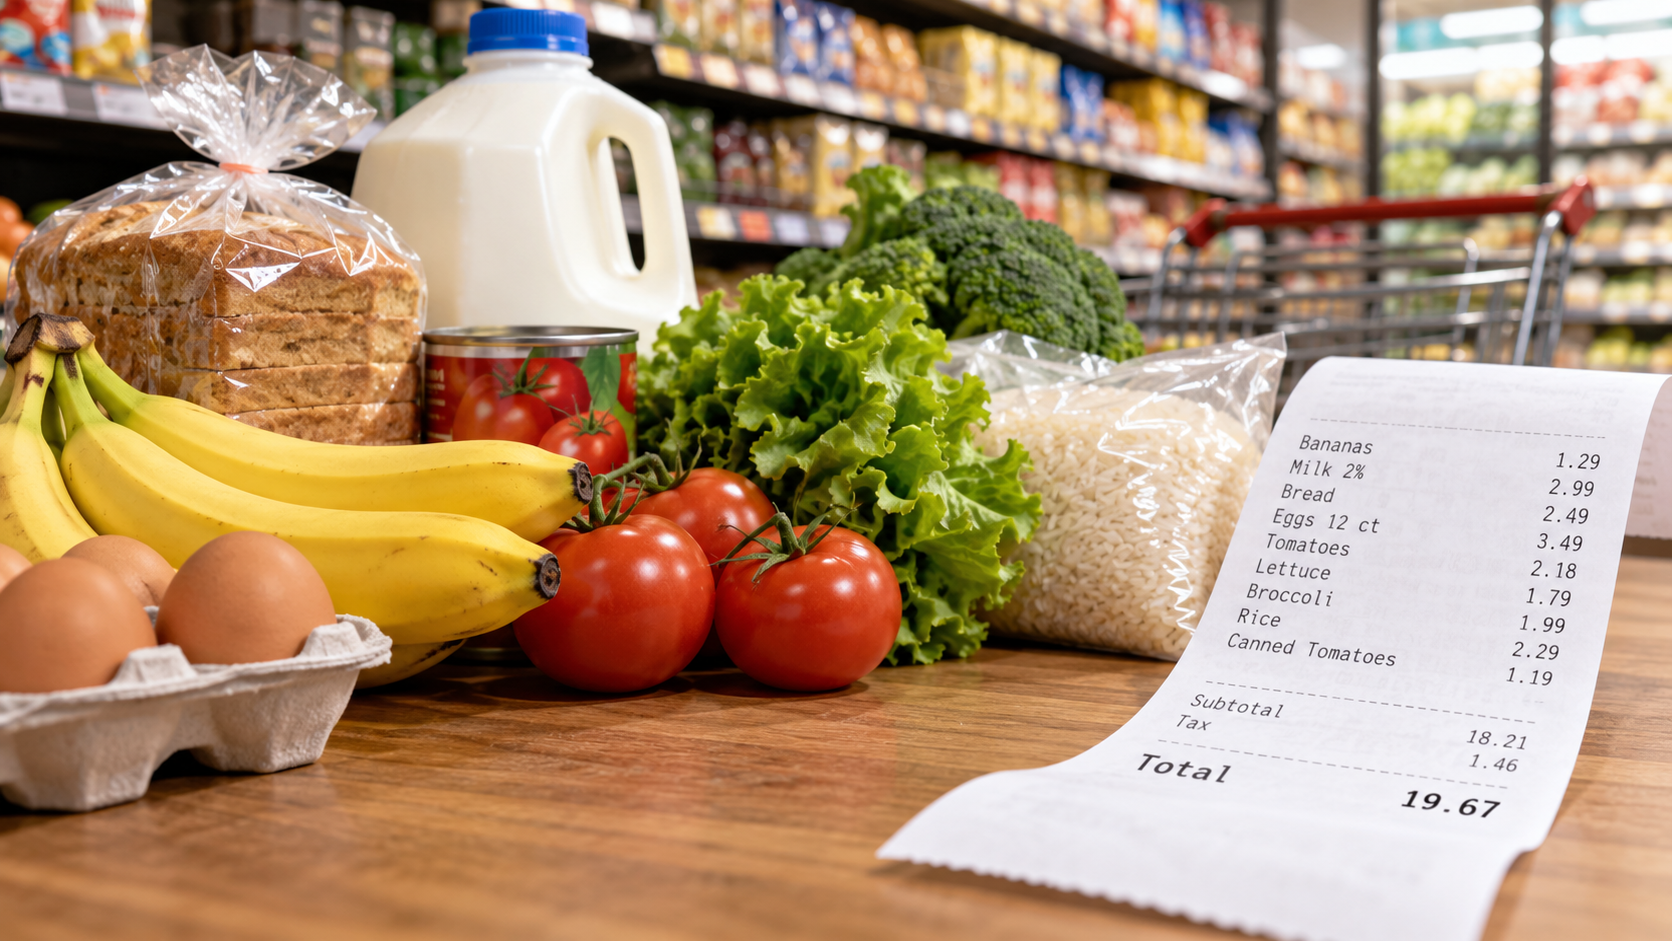
There is a paradox at the supermarket checkout: the latest monthly US grocery inflation reading showed a small decline, yet food producers and retailers are preparing for another wave of cost pressure. Both developments can be accurate because the consumer price index measures what happened to retail prices, not every expense that will influence prices over coming months.
The Bureau of Labor Statistics reported that the food-at-home index fell 0.1% in September 2026 from the previous month, while remaining 1.8% higher than a year earlier. Supermarket News covered that modest decrease. It would be misleading to turn one month’s decline into a claim that the cost-of-living problem has disappeared.
Why prices can pause while costs rise
Retailers do not change every shelf label the instant crude oil, fertilizer or packaging costs move. Many buy through contracts, hold inventories, hedge some inputs and adjust prices selectively. Competing stores may temporarily accept lower margins to maintain customer traffic. This creates a lag between changing supplier conditions and the consumer prices visible in official data.
Reporting by the Financial Times points to diesel, freight and other input costs as renewed sources of concern. That is a plausible channel: food must be produced, processed, refrigerated and transported, sometimes through several distribution centers, before it reaches a shelf.
Not every aisle moves together
A headline grocery index hides distinct markets. September’s BLS release showed declines in beef and dairy prices during the month but increases for some beverages, fruits and vegetables. Seasonal harvests, disease outbreaks, transportation costs and global commodity conditions affect different products on different schedules.
A household that spends heavily on fresh produce may experience a different inflation rate from one buying mostly shelf-stable goods. This is why household budgets often feel disconnected from the national average. Useful service journalism compares a consistent basket over time instead of selecting the most dramatic products after the fact.
Supermarket strategies during inflation
Large chains use private-label products, promotions, loyalty pricing, purchasing scale and supplier negotiations to compete for spending. Discount grocers may emphasize simple store formats and limited assortments. Premium formats may focus on convenience or prepared foods. These strategies do not change the official inflation rate mechanically, but they do affect the price choices consumers face.
Retailers also make trade-offs. Heavy discounts can boost traffic but reduce margins; frequent price changes can confuse shoppers; and private-label expansion can improve value while increasing reliance on a narrower pool of manufacturers.
What households can do without chasing every promotion
Compare unit prices, not only package prices. Plan around a handful of adaptable meals and substitute among comparable ingredients when one category spikes. Check whether a discount requires a loyalty account or bulk purchase that leads to waste. A lower price is not a saving if the product will expire before it is used.
For tracking inflation personally, retain a small set of recurring receipts and calculate the total for identical quantities monthly. Do not compare a holiday basket with a routine basket; the difference may reflect what you bought rather than price increases.
What could change the outlook?
Oil prices, freight costs, farm conditions, tariffs, labor costs and retailer competition will all matter. The 12-month measure can accelerate even if some individual months remain mild. Forecasts should be labelled as forecasts, not as prices already paid.
An effective supermarket news article serves two audiences: investors evaluating margins and families trying to budget. The relevant questions are connected but not identical. Higher selling prices may lift revenue while reducing volumes and worsening customer trust.
How to read the next inflation release
The difference between month-on-month and year-on-year inflation is especially important. A 0.1% monthly fall after earlier increases does not return the price level to where it was before the increases. Likewise, a 12-month inflation rate can ease because last year’s unusually large price rise drops out of the comparison, even if shoppers see no actual cut today. The food-at-home index is a standardized economic measure, while the household’s experience depends on its purchasing mix and store choices. When the next BLS release arrives, compare monthly moves for food at home, food away from home and energy, then assess whether higher freight costs are appearing across multiple categories.
Frequently asked questions
Did grocery prices fall in September 2026?
The US food-at-home index declined 0.1% month on month, but was still up 1.8% over 12 months, according to BLS.
Why do grocers expect pressure later?
Fuel, transportation, packaging and agricultural inputs can take time to show up in retail prices.
Are private-label groceries always cheaper?
Often, but not always. Compare price per unit, quality and the quantity actually needed.
Discover more from The Economy
Subscribe to get the latest posts sent to your email.
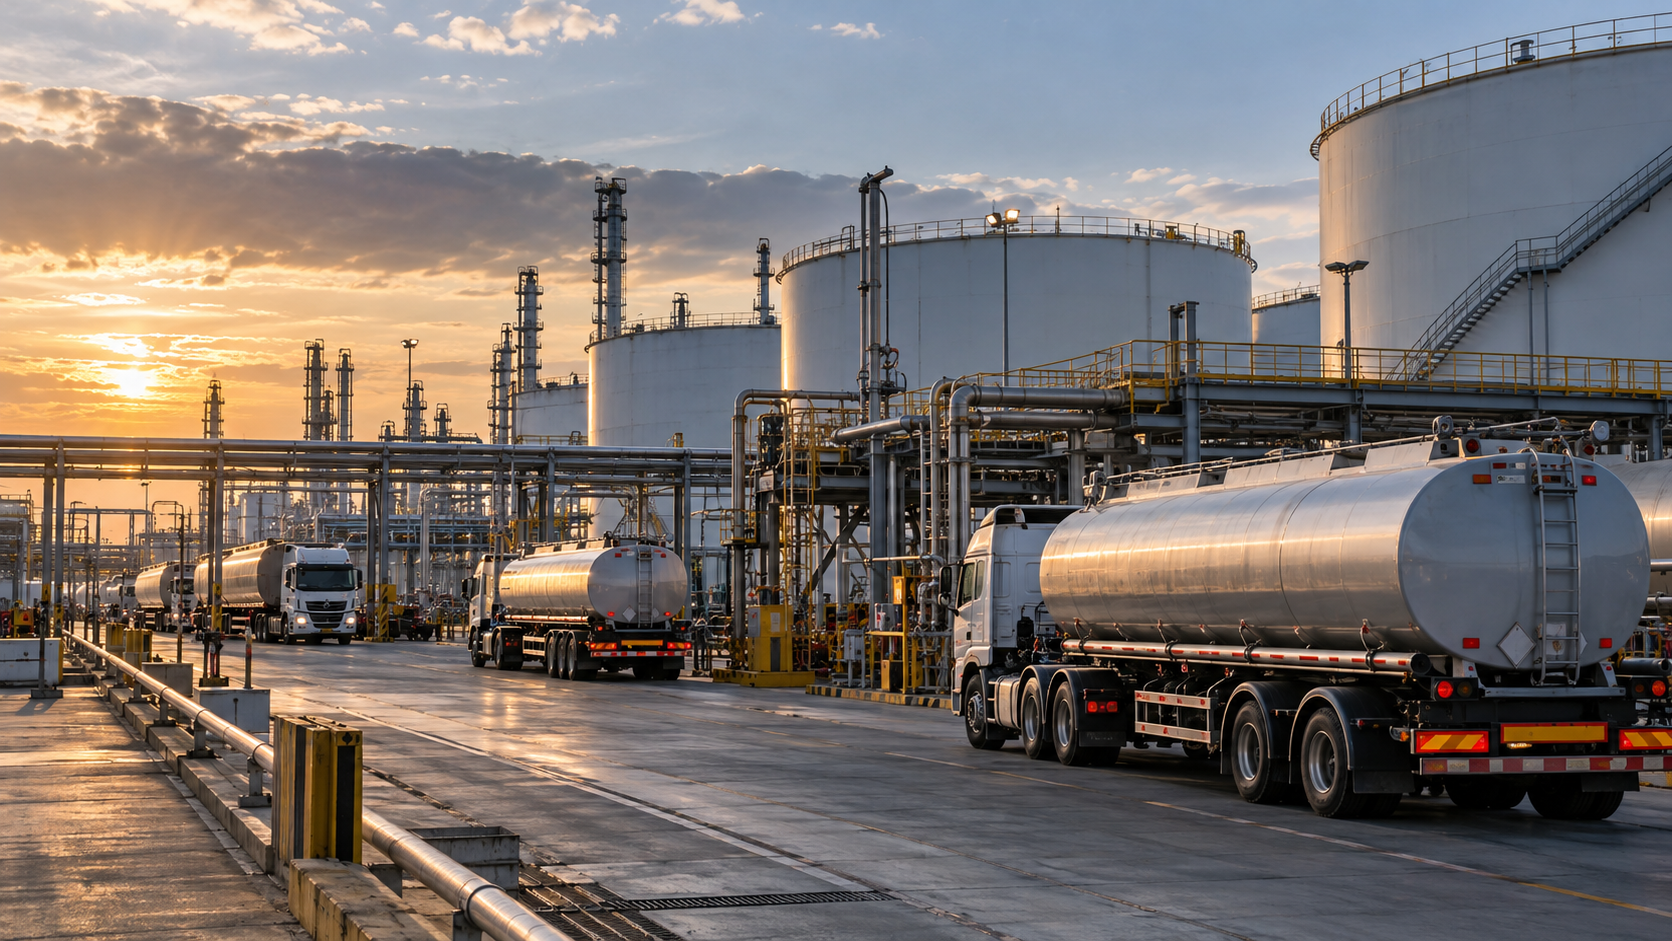
Energy prices are back near the center of the inflation debate in October 2026. Associated Press reporting on October 12 described elevated crude prices and market reactions to proposed Russian diesel purchases against the backdrop of international tensions. The existence of political announcements does not establish that contracted volumes have already arrived or reduced retail pump prices. Sources: Associated Press energy coverage and International Monetary Fund.
The important context competitors can overlook
Crude oil and diesel are related but different markets. Refineries need the right feedstock, sufficient capacity, suitable shipping routes and compliance with regulations. A region can have adequate crude yet experience tight middle-distillate supply because of refinery disruptions, inventory shortages or freight bottlenecks. Trucking, agriculture and industrial logistics transmit fuel costs into goods prices with different time lags. For primary-source checks and current reporting, see Associated Press energy coverage and World Trade Organization. The key distinction is separate crude headlines from finished fuel supply.
Crude prices and diesel prices follow related but different supply chains. Refinery capacity, transport and product inventories help explain the gap. Research cutoff: October 12, 2026; confirm developing facts before publication.
A practical way to use this information
Follow refinery output, diesel inventories, freight costs and wholesale spreads alongside Brent and WTI. For consumers, compare a weekly average fuel price with the prior month rather than inferring national inflation from one service station. For businesses, test whether fuel surcharges are formula-based or discretionary. The honest answer to “will diesel get cheaper?” depends on both delivered product supply and demand.
Why lower crude does not always mean cheaper diesel
| Link in the chain | Potential bottleneck | What to watch |
|---|---|---|
| Crude extraction | Disruption or policy limits | Delivered crude availability |
| Transportation | Tanker capacity and insurance | Freight and route costs |
| Refining | Unit outages and product mix | Diesel output and margins |
| Distribution | Storage, taxes and local supply | Wholesale-to-retail lag |
A political agreement may improve expectations before physical shipments change inventories. This is why fuel inflation coverage should distinguish a possible future supply release from barrels or diesel cargoes actually received.
What to verify before making a decision
The right next step is to identify the source, timestamp and applicable market or jurisdiction. Check whether a number is a historical observation, official announcement, target, forecast or scenario. If you intend to act financially, legally or commercially, use the relevant provider’s current terms and obtain professional advice where appropriate. The sources cited here establish context; they are not a substitute for live prices, individual eligibility checks or binding agreements.
Reader questions
Is diesel price the same as oil price? No. Refining capacity, product inventories, shipping and local taxes create substantial differences.
Do policy announcements lower pump prices immediately? Not necessarily; delivery timing and wholesale markets determine pass-through.
Crude oil and diesel are connected—but not the same commodity
Crude oil is a refinery input, while diesel is one of several refined fuels that emerge from processing it. A change in the crude benchmark affects refiners’ input costs, but the price of diesel also depends on local refinery capacity, maintenance, fuel specifications, product inventories and transport availability. A refinery can have access to crude and still be unable to produce enough diesel for its market. Conversely, a region with healthy diesel inventories may see pump prices respond more slowly to an international crude rally. This is why headlines about a political agreement to increase crude supply should not automatically promise immediate relief to truck drivers.
The difference between the selling price of a refined product and its crude input cost is often discussed through a refining margin or crack spread. These spreads fluctuate as product demand and refinery utilization change. They can rise sharply when product supply is constrained even if crude prices soften. For readers, a graph of Brent oil alone cannot explain every regional diesel price move. Look for product-level benchmarks and inventory data alongside the crude quotation.
How a fuel shock enters broader inflation
Fuel costs affect more than motorists. Trucks carry food, building materials and consumer goods; farm machinery uses diesel; ships and industrial users depend on related refined energy products. Higher transport costs can flow into freight contracts and eventually shelf prices, but the timing depends on contract terms, profit margins and competition. Airlines typically face jet-fuel costs rather than road-diesel costs, so a service article should not present every transport sector as using the same product. Households also respond differently depending on commuting needs and heating arrangements.
An energy shock can affect headline inflation quickly through direct fuel prices, while broader price pressure may take longer. Central banks often distinguish volatile energy components from measures intended to capture underlying inflation, but persistent energy increases can influence expectations and wage negotiations. Reporting should describe the channels without claiming a specific change in CPI before the statistics agency releases its measured result.
Four scenarios for October’s energy market
First, an announced supply deal may be implemented and deliver usable fuel after shipping, payment and compliance arrangements are complete. Second, the deal may be delayed or revised, leaving near-term product shortages unresolved. Third, refinery disruptions or shipping bottlenecks may offset additional crude availability. Fourth, weakening economic demand could reduce consumption even while geopolitical risks remain elevated. In each case, the direction of the crude price, diesel price and pump price may differ. A scenario is a tool for reasoning, not an assertion that an event has occurred.
The distinction is especially important when headlines mention a government statement or preliminary agreement. A political declaration is not physical delivery; a cargo nomination is not necessarily a completed arrival; and the arrival of crude is not itself the production of road-ready diesel. For verification, identify the party making the statement, the product and volume involved, the destination, the delivery window and any relevant sanctions or trade restrictions.
What businesses can do about fuel exposure
A delivery company can examine route optimization, fleet efficiency and whether fuel surcharges fairly reflect current costs. A manufacturer can review freight contracts, supplier concentration and inventory policies. A small retailer should calculate how much of total expense is actually fuel-sensitive before raising prices across the board. Households may compare total travel costs, not just the pump-price sign. All these responses have tradeoffs: extra inventory ties up cash, and hedging instruments can create their own financial risks.
For investors, energy producers, refiners and transport companies can react very differently to the same headline. An oil producer may benefit from higher crude prices while an airline faces higher fuel costs. A refiner’s profitability can depend more on product margins than on crude’s absolute level. Sector labels should never substitute for analyzing actual business exposure.
A practical fuel-price monitoring dashboard
Compare Brent and WTI crude with regional diesel benchmarks, refinery utilization, relevant inventories, transport constraints and local tax structures. Date each observation and note whether figures are daily prices, weekly averages or monthly reports. The U.S. Energy Information Administration is a useful primary source for U.S. energy data. Official inflation releases help distinguish the impact on consumer prices from speculative claims about a future inflation wave.
A good oil-and-diesel article protects readers from two oversimplifications: that every supply announcement immediately changes retail prices, and that every increase in crude produces an identical change in diesel. The market has multiple stages, each with its own constraints and lags.
Discover more from The Economy
Subscribe to get the latest posts sent to your email.

Hong Kong’s average wage rates recorded a 3.4% year-on-year increase in nominal terms, reflecting an enduring tight labor market across key commercial sectors. Data released by the Census and Statistics Department of Hong Kong demonstrates that after accounting for consumer price inflation, wages grew 1.8% in real terms, signaling genuine gains in employee purchasing power across the SAR economy.
The continuous upward movement in wage indices underscores a structural deficit in middle- to upper-tier manpower, further intensified by local economic restructuring and talent retention initiatives.
Key Wage Statistics at a Glance
| Economic Sector | Nominal Wage Growth (YoY) | Real Wage Growth (YoY) | Primary Industry Drivers |
| Financial & Insurance | +4.2% | +2.6% | Wealth management expansion, AI integration, regulatory compliance |
| Professional & Business Services | +3.8% | +2.2% | Legal tech, ESG reporting demand, corporate advisory |
| Transportation & Logistics | +3.5% | +1.9% | Aviation recovery, regional supply chain recalibration |
| Personal Services & Healthcare | +3.2% | +1.6% | Aging demographic demand, private healthcare expansion |
| Retail, Accommodation & Food | +2.6% | +1.0% | Local consumption adjustment, cross-border retail shifts |
Sectorial Performance: Finance and Professional Services Lead the Rally
Growth was not uniformly distributed across the economy. High-value knowledge sectors outstripped consumer-facing operational industries:
1. Financial Services & Wealth Management
The financial sector posted the strongest performance, backed by a rebound in wealth management inflows from mainland China and increased hiring within asset management and private banking. According to policy tracking by the Hong Kong Monetary Authority, institutional demand for risk management and compliance talent boosted salary floors across Tier-1 institutions.
2. Professional, Technical, and Digital Services
Consultancies, legal practices, and tech infrastructure providers recorded robust wage gains. The push toward digital transformation and mandatory sustainability reporting across listed companies created a competitive bidding environment for specialized professionals.
3. Retail, Food Services, and Consumer Travel
While hospitality and food services posted positive nominal gains, their real wage growth lagged behind the citywide average. Retail operators continue to adjust business models in response to altered consumer behavior, including weekend outbound travel by Hong Kong residents to neighboring Guangdong cities.
Real Wages vs. Inflation: Deconstructing Household Purchasing Power
While headline nominal growth stood at 3.4%, the net gain for households relies on the trajectory of the Composite Consumer Price Index (Composite CPI). Official figures from the Hong Kong Government Information Centre indicate underlying consumer inflation remained moderate at approximately 1.6% over the corresponding period.
Nominal Wage Growth (3.4%) − Inflation (1.6%) = Real Wage Growth (1.8%)
This positive differential confirms that worker compensation effectively outpaced baseline living cost increases, supporting private consumption capacity despite broader capital market volatility and elevated interest rates.
Strategic Drivers: Talent Schemes and Structural Shortages
Two major structural forces continue to dictate Hong Kong’s wage dynamic:
- Labor Supply Deficits: Demographic shifts and earlier labor force exits created persistent vacancies across both professional ranks and frontline operational roles.
- Impact of Top Talent Programs: Measures designed to import skilled workforce—such as the Top Talent Pass Scheme—are gradually replenishing senior ranks. However, as noted in economic reviews by the International Monetary Fund, the intake has primarily stabilized mid-to-senior levels while entry-to-mid operational tiers continue to face acute labor tightness, forcing employers to raise entry-level base compensation.
Macro Economic Outlook: What to Expect in Upcoming Quarters
The Hong Kong SAR Government expects further moderate wage increases through the second half of the year. Key factors influencing the trajectory include:
- Monetary Policy Easing: Global interest rate cuts are anticipated to reduce borrowing costs for small and medium-sized enterprises (SMEs), freeing up capital for workforce expansion and salary revisions.
- Cross-Border Integration: Enhanced economic alignment within the Greater Bay Area (GBA) will continue to reshape retail and service-sector wage dynamics, prompting local businesses to optimize efficiency through technology adoption.
- Corporate Cost Management: While talent retention remains a top priority, corporate profit margins are under scrutiny, leading many firms to pivot toward variable performance bonuses rather than permanent base-salary shifts.
Discover more from The Economy
Subscribe to get the latest posts sent to your email.

Why Pakistan’s Inflation Is Still Near 10% Despite Economic Stabilisation

Holiday Airfare 2026: Why Flights Cost More & Fares

California Prop 40 Explained: The 2026 Billionaire Wealth Tax Ballot Measure

US–Iran Conflict in October 2026: Hormuz, Oil Prices and Diplomacy

AIIB in 2026: Can Green Infrastructure Deliver Measurable Growth?

IMF and World Bank Outlook 2026: Growth, Debt and the Missing Investment

Singapore Stocks 2026: STI Outlook After a Record High

Asian Markets in October 2026: What the AI Sell-Off Means for Investors

Supermarket News 2026: Why Grocery Prices Could Rise Again

Wind Farm Economics in 2026: What Determines Whether a Project Pays?

Boomers vs Young Adults: Why the Net Worth Gap Is More Complicated Than It Looks

Is the AI Bubble Bursting in 2026? Five Tests Investors Should Watch

Germany–France ‘Made in Europe’ Deal Could Reshape China’s EV Ambitions

Treasury Yields and Inflation 2026: What Bond Moves Mean for Borrowers

World’s Largest Economies: Ranking the Top Global Powers

Crude Oil & Petroleum Market Analysis: OPEC+ Decisions and Price Forecasts

Pakistan Economy 2026: Inside the SBP’s Balancing Act

Bitcoin Price Forecast 2026–2027: Will the 4-Year Cycle Hold?

Asian Stock Markets 2026: Japan, China, Pakistan & More

Silver Price Today: Why the Xi-Trump AI Standoff Is Fueling a Safe-Haven Rally

SpaceX IPO 2026: History’s Biggest Stock Debut?

SpaceX IPO: How Aerospace Is Reshaping Tech Startup News

Oil Prices 2026: Inside the Hormuz Crisis That Won’t End

Algorithmic Dogfights: Why the U.S. and China Must Establish Rules of Engagement for Autonomous Air Power

IMF Reports 2026: What the Latest Data Means for the Global Economy

Top US Convenience Store Chains: Store Counts, EV Charging, and Sales Trends

Business Insurance: What Coverage You Actually Need and What It Costs in 2026

Corporate America Faces a New Debt Test as US Borrowing Costs Surge
-

 Markets & Finance10 months ago
Top 15 Stocks for Investment in 2026 in PSX: Your Complete Guide to Pakistan’s Best Investment Opportunities
-

 Analysis8 months ago
Johor’s Investment Boom: The Hidden Costs Behind Malaysia’s Most Ambitious Economic Surge
-

 Analysis8 months ago
Top 10 Stocks for Investment in PSX for Quick Returns in 2026
-

 Banks9 months ago
Best Investments in Pakistan 2026: Top 10 Low-Price Shares and Long-Term Picks for the PSX
-

 Analysis8 months ago
Brazil’s Rare Earth Race: US, EU, and China Compete for Critical Minerals as Tensions Rise
-

 Investment9 months ago
Top 10 Mutual Fund Managers in Pakistan for Investment in 2026: A Comprehensive Guide for Optimal Returns
-

 Global Economy10 months ago
15 Most Lucrative Sectors for Investment in Pakistan: A 2025 Data-Driven Analysis
-

 Global Economy10 months ago
Pakistan’s Export Goldmine: 10 Game-Changing Markets Where Pakistani Businesses Are Winning Big in 2025