
Analysis
Like Biden Before Him, Trump Faces a Resurgent Inflation Crisis—But This One Bears His Own Fingerprints
In the early morning mist of eastern Ohio, the diesel pumps at a major interstate truck stop tell a story that Washington’s economic models are only beginning to digest. For long-haul drivers, filling an 110-gallon tank now commands an agonizing price tag of nearly $500, with national average gas prices hovering stubbornly around $4.50 per gallon. A few hundred miles away in Chicago, independent restaurateurs are adjusting their menus weekly, confronting a stunning 2.7% single-month surge in wholesale beef prices.
For the American consumer, the exhausting sensation of economic déjà vu has arrived with a vengeance.
According to the latest data released by the U.S. Bureau of Labor Statistics, the annualized Consumer Price Index (CPI) accelerated to 3.8% in April 2026, up sharply from 3.3% in March. This represents the highest inflationary peak since mid-2023, effectively extinguishing any lingering hopes for an imminent monetary easing cycle. Simultaneously, the Producer Price Index (PPI) for final demand surged by 1.4% in April alone—the most aggressive monthly wholesale leap since 2022—pushing annualized factory-gate inflation to a blistering 6.0%.
The political irony is as acute as the economic pain. Donald Trump won a historic return to the White House largely on a mandate to dismantle the “Biden inflation” that had soured the American electorate. Yet, halfway through his second term, the Trump inflation problem has morphed from a campaign talking point into a systemic structural crisis.
While the first inflationary wave of the 2020s could be attributed to global pandemic dislocations and post-lockdown demand surges, this second wave—the Trump self-inflicted inflation 2026 crisis—is structurally distinct. It is an economic reality engineered not by the residual hangover of the pandemic, but by a volatile mix of aggressive global trade protectionism, expansionary domestic fiscal policy, and direct geopolitical brinkmanship.
The Tale of Two Inflationary Cycles: A Biden vs Trump Inflation Comparison
To understand the mechanics of the current macroeconomic malaise, one must chart a clear Biden vs Trump inflation comparison. The inflationary surge that plagued the Biden administration between 2021 and 2023 was primarily a crisis of disrupted supply and unprecedented global liquidity. The global economy was attempting to restart an intricate machine that had been abruptly frozen by COVID-19. Microchip shortages, backlogged ports, and historic cash injections via the American Rescue Plan collided with a sudden, massive release of pent-up consumer demand. Biden’s inflation was an inherited global phenomenon, later exacerbated by Russia’s unexpected invasion of Ukraine, which sent international commodity markets into a tailspin.
By contrast, the economic landscape inherited by the second Trump administration in early 2025 was vastly more stabilized. Inflation was steadily gliding down toward the Federal Reserve’s 2.0% target, supply chains were fluid, and global growth had normalized.
Inflationary Wave 1 (Biden Era):
Global Lockdown Closures ➔ Supply Chain Snarls + Global Liquidity ➔ Broad Peak Inflation (9.1%)

Inflationary Wave 2 (Trump 2026 Era):
Normalized Baseline ➔ 10% Universal Tariffs + Hormuz Energy Shock + Corporate Tax Cuts ➔ Resurgent Inflation (3.8%)
The pivot to how Trump policies raising prices 2026 occurred because the administration chose to test the limits of supply-side economic engineering in a fully employed economy. Rather than letting a cooling economy settle into a low-inflation groove, the administration executed an aggressive trifecta: a sweeping universal tariff regime, expansionary tax cuts via the 2025 Reconciliation Act, and an unprovoked, high-stakes military escalation in West Asia.
Where Biden’s inflation problem was largely driven by an exogenous global shock, Trump’s inflation problem is increasingly seen by economists as an endogenous, policy-driven phenomenon.
The Geopolitical Spark: The Iran War and the $4.50 Gallon
The most immediate and painful vector of this resurgent inflation is written in the language of global energy markets. On February 28, 2026, the long-simmering friction between Washington, Tel Aviv, and Tehran erupted into an active military conflict. The resulting regional instability led to the immediate closure of the Strait of Hormuz—the world’s most vital maritime choke point, through which roughly 20% of global petroleum passes daily.
The economic consequence was instantaneous. The U.S. Bureau of Labor Statistics reported that the domestic energy index jumped a staggering 17.9% over the last 12 months ending in April 2026. Within the monthly basket, gasoline prices spiked by 5.4% in April alone, while the annual increase in fuel costs reached a painful 28.4%. Energy costs accounted for more than 40% of the total monthly increase in the consumer price index.
Strait of Hormuz Closure ➔ Global Supply Constrained ➔ 17.9% Annual Energy Index Surge ➔ 40% of Total CPI Hike
When confronted by reporters regarding the acute domestic economic fallout of the West Asian campaign, President Trump’s response reflected a stark prioritization of geopolitical objectives over cost-of-living concerns:
“Not even a little bit. The only thing that matters when I’m talking about Iran, they can’t have a nuclear weapon. I don’t think about Americans’ financial situation. I don’t think about anybody. I think about one thing: We cannot let Iran have a nuclear weapon.”
While this hardline posture aims to project strategic resolve internationally, it creates an immense burden for domestic monetary policy. Analysts at Goldman Sachs note that energy shocks are notoriously difficult for central banks to counter because they operate as a regressive tax on consumers, directly dampening real disposable income while feeding into the transportation and logistical costs of virtually every physical good in the American marketplace.
Protectionism Under Judicial Whiplash: The 2026 Tariff Tax
If the energy shock is the external hammer hitting American households, the administration’s trade policy is the internal grinding wheel. The second Trump administration began with an unprecedented protectionist experiment: elevating the overall average effective U.S. tariff rate from a baseline of 2.5% in early 2025 to a historic peak of 27% by mid-2025.
This sweeping use of the International Emergency Economic Powers Act (IEEPA) to impose universal “fentanyl tariffs” and reciprocal levies plunged global supply chains into chaos. However, in February 2026, the legal framework cracked. In the landmark case Learning Resources, Inc. v. Trump, the Supreme Court ruled that the administration had overstepped its statutory authority under the IEEPA. This forced the federal government to begin the messy process of arranging billions of dollars in corporate refunds.
Rather than abandoning the protectionist playbook, the White House pivoted immediately. Trump invoked Section 122 of the Trade Act of 1974, implementing a mandatory 10% universal global tariff scheduled to remain in effect for 150 days until July 24, 2026.
| Tariff Regime Period | Effective Average U.S. Tariff Rate | Primary Legal Justification |
| Pre-2025 Baseline | 2.5% | Standard Trade Agreements |
| Mid-2025 Peak | 27.0% | IEEPA Executive Action (Struck down by SCOTUS) |
| April 2026 Current | 11.8% | Section 122 Trade Act of 1974 (Under Appeal) |
The direct transmission mechanism of the Trump inflation tariffs Iran war nexus is now vividly apparent in corporate behavior. According to comprehensive research published by the Federal Reserve Bank of Dallas, import-dependent businesses are no longer absorbing these shifting compliance costs within their profit margins. Having spent over a year navigating tariff whiplash, corporate supply chain managers are passing the costs directly to consumers. The Dallas Fed concluded that this persistent tariff pass-through has added a full percentage point to the core consumer price index.
The Peterson Institute for International Economics (PIIE) notes that a flat 10% tariff on imported inputs acts precisely like a consumption tax. It raises the baseline cost of everything from industrial aluminum to electronic components, ensuring that even if domestic firms do not import directly, their domestic suppliers raise prices in tandem.
Fiscal Incendiarism: Cutting Taxes in a Hot Economy
Compounding this supply-side disruption is an exceptionally loose fiscal policy. In late 2025, the administration successfully pushed through the 2025 Reconciliation Act. Designed to secure corporate investment incentives, the bill radically expanded corporate tax deductions and asset-expensing provisions.
The fiscal fallout has been swift. Data compiled by the Congressional Budget Office indicates that federal corporate income tax collections plunged by 23% in the first five months of fiscal year 2026. This sharp contraction in tax receipts occurred even as mandatory spending on social entitlement programs expanded due to demographic pressures and past cost-of-living adjustments.
2025 Reconciliation Act ➔ 23% Drop in Corporate Tax Receipts ➔ $1.9 Trillion Projected 2026 Deficit (5.8% of GDP)
Consequently, the federal budget deficit is projected to hit a massive $1.9 trillion for fiscal year 2026, equivalent to 5.8% of GDP—an extraordinary deficit figure for an economy not currently in a recession. The federal debt held by the public has officially climbed past 101% of GDP.
While the administration argues that these tax cuts stimulate supply-side growth, mainstream macroeconomic theory from organizations like the OECD suggests that running a massive fiscal deficit when unemployment is low and core inflation is sticky simply adds fuel to the fire. By injecting substantial liquidity into the corporate sector while simultaneously restricting the supply of foreign goods through tariffs, the administration’s fiscal strategy is working at direct cross-purposes with the Federal Reserve’s inflation-fighting mandate.
The Deepening Impact: US Inflation April 2026 Impact on Consumers
The convergence of these policy choices has produced a deeply bifurcated American economy. On one hand, capital markets remain incredibly resilient. The tech-heavy Nasdaq and the S&P 500 continue to dance near historic highs, propelled by an unprecedented, secular capital expenditure boom in artificial intelligence infrastructure.
On the other hand, the US inflation April 2026 impact on consumers is triggering a profound collapse in household sentiment. The reality of the modern American cost-of-living crisis is found in the divergence between asset prices and real incomes:
- Real Wage Erosion: While nominal wage growth grew at an annualized rate of 3.6% in April, real average hourly wages fell by 0.5% month-over-month when adjusted for inflation. Salaries are actively losing the race against basic living expenses.
- The Grocery Cart Tax: The food index increased 3.2% over the past year. Within the grocery store, structural pressures have intensified: fruits and vegetables are up 6.1% annually, nonalcoholic beverages have jumped 5.1%, and core protein staples like beef climbed 2.7% in April alone.
- The Shelter Trap: Core inflation, which excludes volatile food and energy, stepped up to 2.8% YoY (up from 2.6%). This stickiness is driven heavily by the shelter index, which climbed 0.6% in April, reflecting an acute shortage of affordable housing supply that high interest rates have only worsened.
Consumer polling indicates deep public dissatisfaction. Families perceive an economy where the cost of daily survival is continuously escalating, driven by macro-forces entirely outside their control.
The Central Bank’s Corner: No Rate Relief in 2026
For the Federal Open Market Committee (FOMC), the April CPI report is a sobering confirmation that inflation has broken out of its downward trajectory. The dream of a smooth, immaculate disinflationary “soft landing” has been deferred.
Financial institutions have swiftly realigned their expectations. A comprehensive analysis by ICICI Bank indicates that the Federal Reserve will likely maintain its elevated benchmark interest rate completely unchanged throughout the remainder of 2026. The upside risks introduced by the West Asian conflict and the impending July expiration of Section 122 tariffs give the Fed zero room to maneuver.
Hot CPI & PPI Data ➔ Fed Trapped in Status Quo ➔ Bond Market Rout (10-Year Treasury at 4.5%, 30-Year at 5.0%)
The bond market has responded with a dramatic repricing of risk. The benchmark 10-year Treasury yield has pushed up to 4.5%, while the 30-year Treasury bond now carries a 5.0% interest rate—the highest borrowing costs the federal government has faced in over a year.
These elevated yields mean that the cost of servicing the national debt is itself becoming an inflationary driver. The Bipartisan Policy Center notes that net interest payments on the public debt increased by 8% in the first half of the fiscal year alone, consuming a rapidly expanding share of federal outlays and further complicating the nation’s long-term fiscal health.
The Scenarios Ahead: A Policy Choice
As the summer of 2026 approaches, the Trump administration stands at a critical macroeconomic crossroads. The current policy mix—unbounded geopolitical confrontation, aggressive import taxes, and deficit-financed domestic incentives—has created an unsustainable inflationary feedback loop.
Independent research bodies, including the Yale Budget Lab, suggest two distinct paths forward:
Scenario A: The Escalation Loop
The administration doubles down on its protectionist stance, allowing Section 122 tariffs to transition into a permanent 15% universal levy in July while continuing an extended military campaign in Iran. In this scenario, supply shocks solidify. Inflation could comfortably breach 4.5% by winter, forcing the Federal Reserve to consider active interest rate hikes, risking a severe stagflationary recession.
Scenario B: The Pragmatic Pivot
Confronted by cratering consumer confidence and an unsustainable bond market rout, the White House pursues an aggressive diplomatic resolution in West Asia to reopen the Strait of Hormuz, while quietly allowing the universal tariffs to sunset or soften through sweeping corporate exemptions. Chief economists at Moody’s Analytics project that such a pragmatic retreat could see inflation swiftly recede back toward 3.3% by year-end, restoring stability to domestic supply chains.
The fundamental lesson of the April 2026 inflation data is that the laws of economics cannot be bypassed by political willpower. Every tariff is a tax; every war is an energy shock; every unhedged tax cut in a hot economy is a monetary demand spike. Joe Biden discovered the steep political price of inflation between 2022 and 2024. If the current administration refuses to recognize its own hand in the current crisis, Donald Trump may soon find that the economic fire he stoked will burn his own legacy down.
Frequently Asked Questions (FAQ)
Why is US inflation rising again in April 2026?
Inflation rose to 3.8% in April 2026 due to two primary catalysts: an energy price shock caused by the military conflict with Iran, which closed the vital Strait of Hormuz, and a 10% universal global tariff implemented by the Trump administration, which forced domestic businesses to pass higher import costs directly along to consumers.
How do Donald Trump’s tariffs impact everyday consumer prices?
When the U.S. imposes tariffs on foreign goods, domestic companies that rely on imported parts, metals, or finished items must pay a higher cost at the border. According to the Federal Reserve Bank of Dallas, businesses are passing these costs directly to consumers, which has added roughly a full percentage point to consumer price inflation in 2026.
What is the difference between the Biden-era inflation and the 2026 Trump inflation?
The Biden-era inflation (which peaked at 9.1% in 2022) was primarily driven by global supply chain disruptions from the COVID-19 pandemic and large-scale post-pandemic liquidity injections. The 2026 Trump inflation is viewed as largely self-inflicted, driven by active policy choices including a new trade war, corporate tax cuts that widened the federal deficit to $1.9 trillion, and military escalation in West Asia.
Will the Federal Reserve cut interest rates in 2026?
Due to sticky core inflation (2.8%) and a volatile global energy market, major financial institutions expect the Federal Reserve to keep interest rates completely unchanged throughout 2026 to prevent the economy from overheating.
Discover more from The Economy
Subscribe to get the latest posts sent to your email.


The Definitive Guide to the New Green Claims Rules and What They Mean for Business
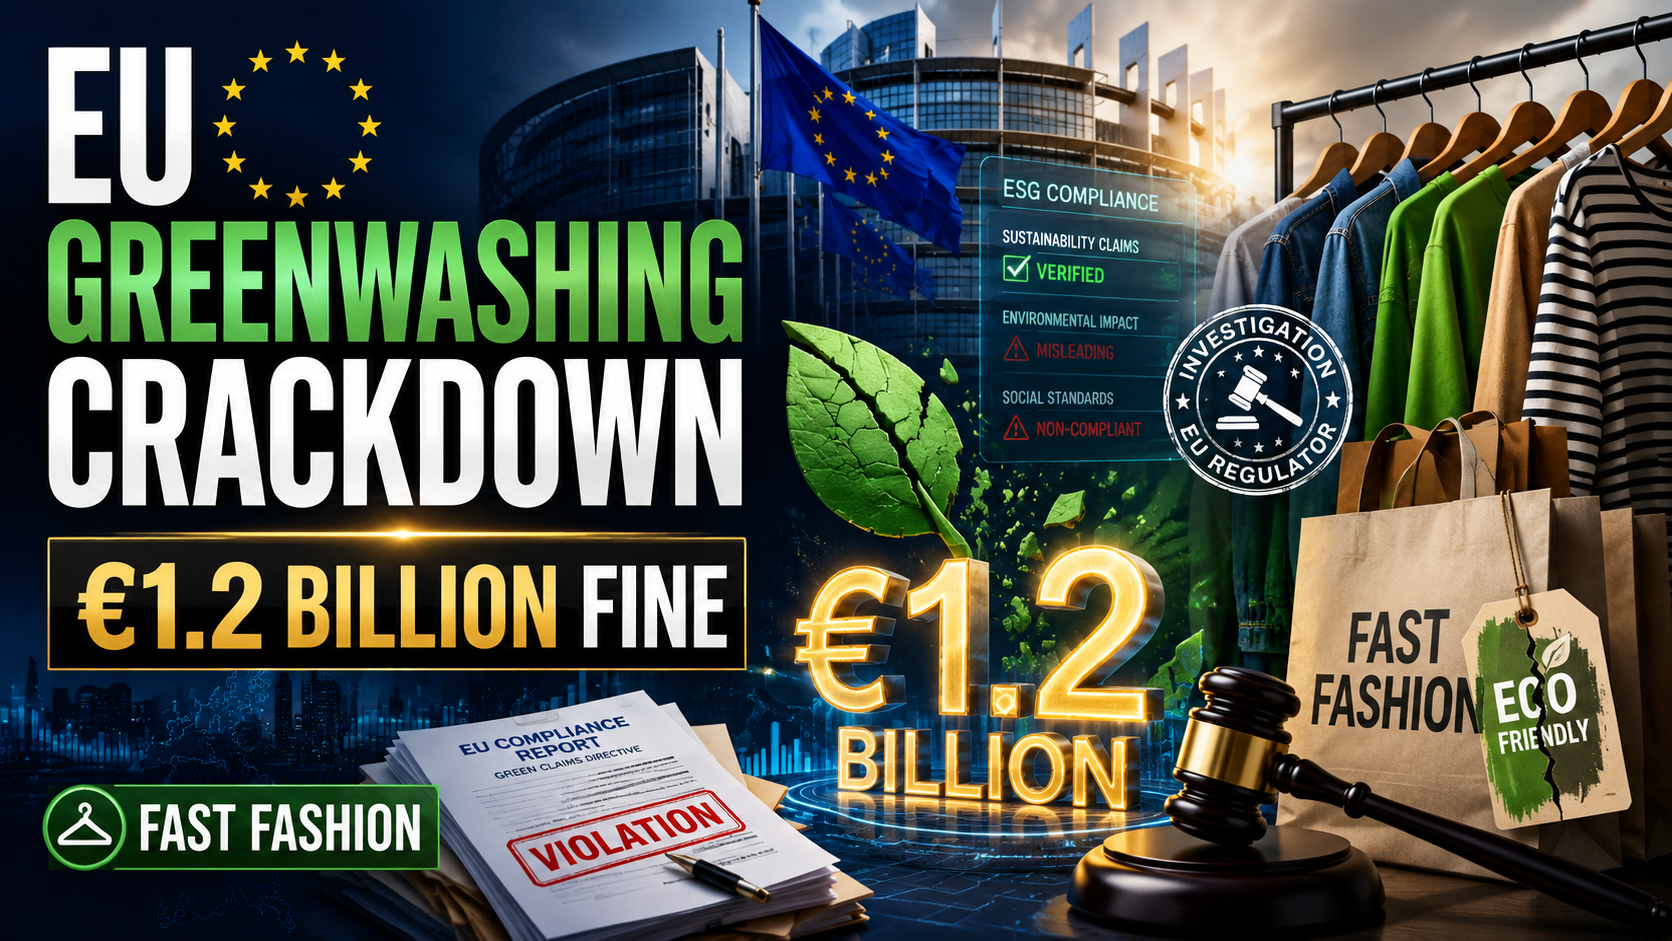
The European Commission dropped a bombshell on the fast‑fashion industry in late June 2026, fining five major retailers a combined €1.2 billion for systematically misleading consumers about the environmental credentials of their products (European Commission Press Corner, June 2026). The coordinated action, brought by the EU Consumer Protection Cooperation Network, marks the largest EU greenwashing enforcement action in history and signals a new era of aggressive regulation. The companies—whose names have been redacted pending legal review—were found to have used vague terms like “eco‑friendly,” “sustainable choice,” and “green” without substantiating their claims with verifiable lifecycle assessments. One retailer’s “recycled polyester” jackets, which still relied on virgin fossil‑fuel‑based material for 70% of their content, were singled out as “grossly misleading.”
The Legal Framework: Empowering Consumers Directive and Green Claims Directive
This crackdown operationalizes two landmark pieces of legislation. The Empowering Consumers Directive, adopted in March 2024 and transposed into member state law by mid‑2026, amends the Unfair Commercial Practices Directive to explicitly ban generic environmental claims that cannot be proven. The Green Claims Directive, which entered into force in January 2026, requires any explicit environmental claim—such as “carbon‑neutral” or “biodegradable”—to be substantiated by an independent, third‑party‑verified assessment using a product environmental footprint (PEF) methodology. The directive also prohibits claims that a product has a neutral or positive environmental impact based solely on offsetting carbon credits; actual emissions reductions must be demonstrated first.
The June 2026 fines are a direct consequence of this legal framework. The EU’s consumer protection network, working with national authorities, conducted a “sweep” of over 5,000 product webpages and found that 42% contained “vague, false, or deceptive” green claims. The fast‑fashion sector, with its high turnover of styles and marketing built on constant newness, was the worst offender. The €1.2 billion penalty—calculated as 4% of the companies’ annual EU‑wide turnover—is the maximum allowed under the new regime and is intended as a deterrent.
Corporate Sustainability Claims Crackdown: What Must Change
The crackdown is forcing a fundamental rethink of marketing and product development. Companies can no longer rely on a glossy “sustainability” microsite alongside a core business of high‑volume, low‑price disposable fashion. The corporate sustainability claims crackdown requires:
- Lifecycle Transparency: Claims must be supported by a full lifecycle assessment (LCA) that covers raw material extraction, manufacturing, transport, use, and end‑of‑life. The EU is building a centralized registry of verified LCAs, accessible to consumers via a QR code on product labels.
- Digital Product Passports: By 2027, all textile products sold in the EU must carry a digital product passport that details the product’s composition, recycled content, water usage, and carbon footprint. This passport must be updatable and linked to a tamper‑proof blockchain ledger (European Commission, Digital Product Passport Regulation).
- No Offsetting‑Based Neutrality: Statements like “climate‑neutral” or “CO₂‑neutral” are banned unless the company has already achieved deep in‑house emission cuts. Offsetting can only address the final, residual emissions.
- Substantive Change, Not Marketing Spin: Fast‑fashion firms must decouple revenue from resource use. The EU’s Textile Strategy, a parallel policy, mandates that by 2030, textiles placed on the EU market must be durable, repairable, and recyclable. Brands are now investing in recycling infrastructure, bio‑based materials, and rental/resale models.
The Global Precedent
The EU’s action is setting a global precedent. The UK’s Competition and Markets Authority (CMA) has launched a parallel investigation into three fashion retailers, and the US Federal Trade Commission is finalizing its update to the “Green Guides,” which will require similar substantiation for claims made in the American market (FTC, Green Guides Update Notice, June 2026). Australia, Canada, and South Korea have also signaled they will adopt the EU’s PEF methodology. For multinational brands, the EU standard is becoming the de facto global benchmark because supply chains are integrated; it is inefficient to produce one “green” line for Europe and a “conventional” line for the rest of the world.
Business Response and Strategic Advantage
The immediate reaction among fast‑fashion CEOs has been a scramble to hire compliance officers, retrain marketing teams, and audit supply chains. Some are pre‑emptively dropping all environmental claims from their advertising and replacing them with numeric data. “We’re moving from adjectives to numbers,” the chief sustainability officer of a major European retailer told the Financial Times. “Instead of saying ‘eco‑friendly jeans,’ we say ‘These jeans contain 42% recycled cotton and used 20% less water than our baseline in 2022.’ It’s less sexy but more honest.”
Forward‑thinking companies see the regulation as a competitive moat. Those that have already invested in traceability, such as using blockchain to track organic cotton from farm to garment, can verify their claims and will gain consumer trust. The EU Ecolabel is being revamped to incorporate the new criteria, and early adopters are experiencing a “green trust premium” in brand valuation. New entrants are building business models entirely around compliance: repair‑and‑resale platforms, rental subscription services, and circular‑design software are attracting venture capital.
The Bottom Line
The €1.2 billion fine is a watershed moment. It signals that greenwashing is no longer a public‑relations risk; it is a material financial, legal, and reputational liability. Companies that have treated sustainability as a marketing veneer are being exposed, and the cost of non‑compliance—fines, exclusion from public procurement, and damage to brand equity—is now existential. The EU greenwashing enforcement wave is just beginning, and its ripple effects will reshape consumer goods markets for a decade. The takeaway for business leaders is clear: substantiate, digitize, and transform your product design, or face the consequences.
Discover more from The Economy
Subscribe to get the latest posts sent to your email.
Demographics, Digital Infrastructure, and a Manufacturing Explosion Propel India’s Ascent
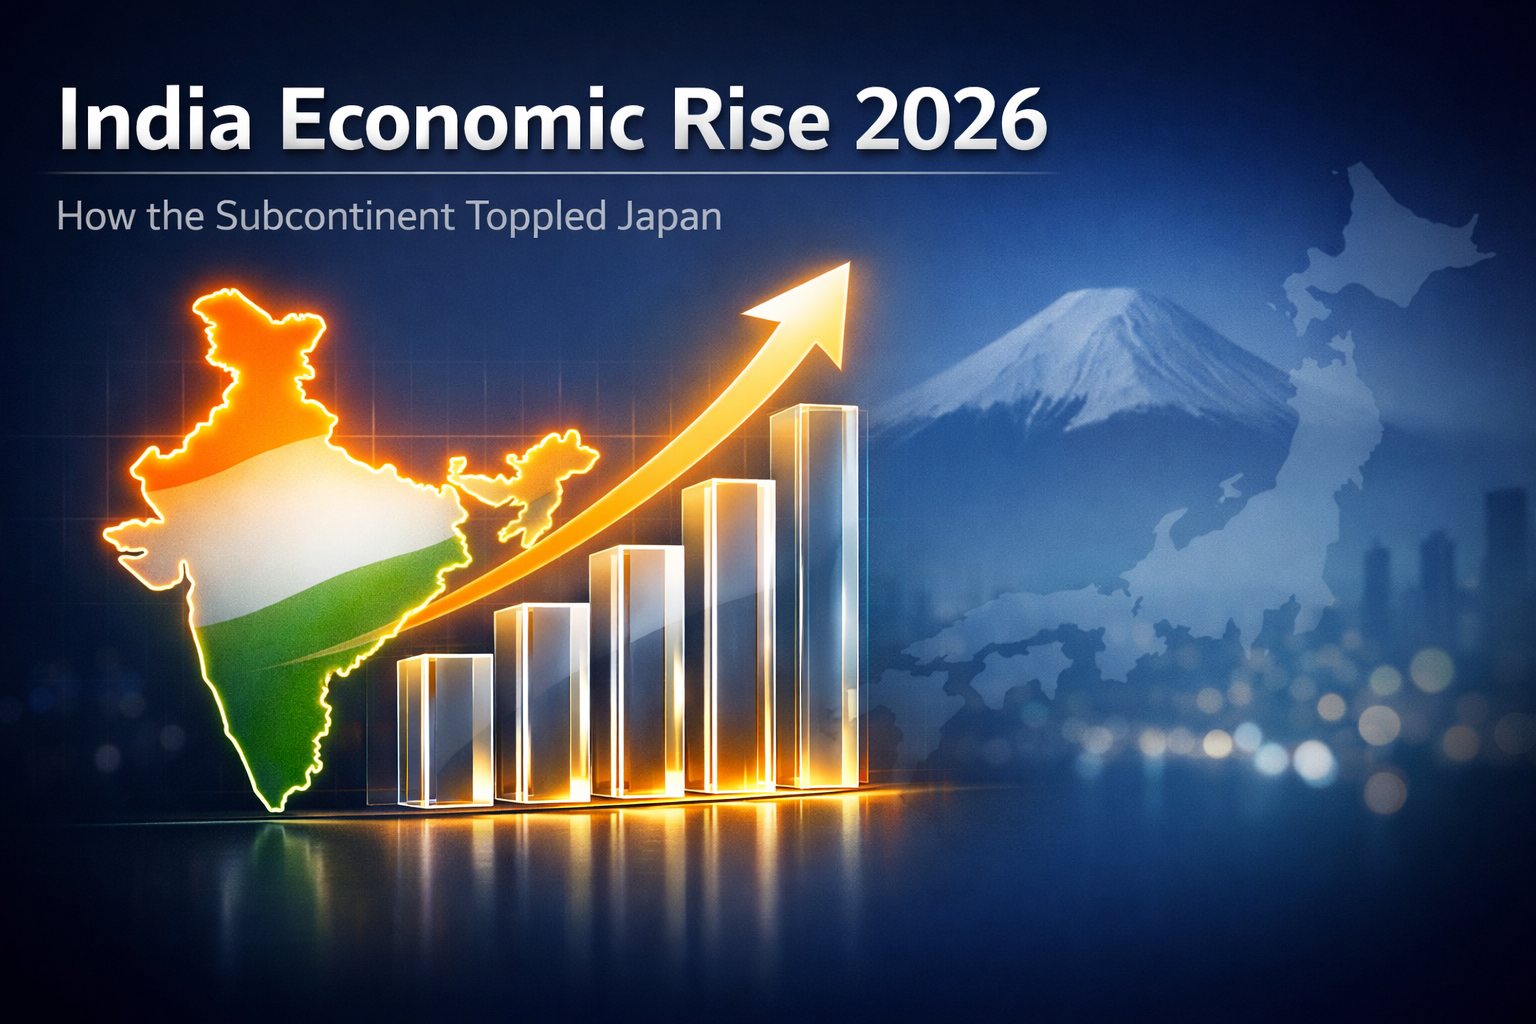
India has officially overtaken Japan to become the world’s third‑largest economy in nominal GDP terms, the International Monetary Fund confirmed in its April 2026 World Economic Outlook database. With a GDP of $5.2 trillion, India now trails only the United States ($32 trillion) and China ($21 trillion) (IMF WEO Database, April 2026). The milestone cements the India economic rise 2026 narrative that has captivated global investors, strategists, and policymakers. The ascent is not a statistical fluke; it is the result of a confluence of structural forces: a demographic dividend, a digital‑public‑infrastructure revolution, and a manufacturing boom that is redrawing global supply chains.
The Demographic Dividend: A 25‑Year Tailwind
India’s population, at 1.48 billion, is now the world’s largest, and its median age is just 28. While China and Japan grapple with aging, shrinking workforces, India is adding 12 million young people to the labor market every year. The United Nations projects that India will account for 22% of the world’s working‑age population between 2025 and 2050. This demographic bulge, if effectively harnessed, can produce a virtuous cycle of rising savings, investment, and consumption.
The challenge is employment. The labor force participation rate has improved to 55% from a low of 40% in 2021, but is still below the 60%+ levels needed to absorb the influx. The government’s response is a combination of mass skilling (the Skill India Digital platform has trained 250 million people), entrepreneurship support (the MUDRA loan scheme has disbursed over $150 billion to micro‑enterprises), and large‑scale infrastructure projects. The National Infrastructure Pipeline, which aims to invest $2 trillion by 2030, is creating jobs in construction, logistics, and urban services.
Digital Public Infrastructure: The Game‑Changer
India’s most powerful economic weapon is its digital public infrastructure. The Unified Payments Interface (UPI) processed 18 billion transactions worth $3.5 trillion in May 2026 alone, a volume that dwarfs all other real‑time payment systems globally ([NPCI Monthly Statistics, June 2026](https://www.npci.org.in/statistics/monthly-metrics)). UPI has formalized a vast informal economy, allowing street vendors to accept digital payments, small businesses to access credit based on transaction history, and the government to deliver subsidies directly to beneficiaries’ bank accounts, plugging $45 billion in annual leakage.
The Open Network for Digital Commerce (ONDC) is democratising e‑commerce by unbundling the platform‑centric model of Amazon and Flipkart, enabling small retailers to list their products on a unified network. The Account Aggregator framework is pioneering consent‑based data sharing, reducing the cost of credit assessment and enabling a boom in small‑business lending. Aadhaar, the biometric ID, covers 1.4 billion people and is the backbone for KYC and service delivery. This stack, collectively, is adding an estimated 1.5 percentage points to annual GDP growth by cutting transaction costs and increasing economic participation (IMF Working Paper, “India’s Digital Revolution”, 2026).
The Manufacturing Boom and PLI Scheme
India’s manufacturing sector, long an underperformer, has undergone a renaissance. The Production‑Linked Incentive (PLI) scheme, launched in 2020 and expanded to 14 sectors, offers fiscal incentives to firms that achieve specified investment and sales thresholds. By June 2026, PLI‑sanctioned investments had reached $65 billion, creating 2.8 million direct jobs (DPIIT Annual Report 2025‑26). The biggest success stories are in electronics and automobiles. Apple now produces over 20% of its global iPhone output in India, up from 5% in 2022, and its supplier ecosystem—Foxconn, Wistron, Pegatron—has expanded aggressively. Samsung’s smartphone factory in Noida is its largest globally. Tesla’s Gigafactory in Sanand, Gujarat, started production in early 2026, initially targeting domestic and Southeast Asian markets.
Semiconductor fabrication, a strategic priority, has received a $15 billion government commitment. Micron’s ATMP facility in Sanand and the Tata Group’s fab in Dholera are under construction, with the first “Made in India” chips expected in 2027. The global manufacturing boom in India is being driven by the “China + 1” strategy, but also by the sheer size of the Indian consumer market, which is projected to become the world’s third‑largest by 2027.
The Nominal GDP League Table and What It Means
Surpassing Japan in nominal GDP is symbolically powerful but must be understood in context. India’s per‑capita GDP is still only $3,600, about one‑tenth of Japan’s and less than one‑third of China’s. The country remains a lower‑middle‑income nation, with 220 million people living below the national poverty line. However, the pace of income growth is accelerating: real per‑capita GDP has grown at an average of 6.5% annually over the past four years, a trajectory that, if maintained, could lift per‑capita income to $10,000 by 2035, transforming India into an upper‑middle‑income country.
For global investors, India is the “consensus long” of the decade. Equity markets, represented by the Nifty 50, have delivered a 15% compound annual growth rate in dollars over the last five years, driven by earnings growth, not multiple expansion. Foreign portfolio inflows have been robust, but foreign direct investment is the real engine, reaching $85 billion in FY2025‑26. Sectors attracting the most FDI include renewable energy, digital services, data centers, and healthcare. The bond market’s inclusion in the J.P. Morgan and Bloomberg emerging‑market indices has reduced borrowing costs and expanded the investor base.
Risks remain: political polarization, the complex federal structure that can delay land acquisition and labor reforms, and the external vulnerability of oil imports (India imports 85% of its crude). Yet the structural narrative is overwhelmingly positive. India’s rise is not just about catching up; it is about creating a distinct, digitally‑native growth model that combines scale, frugality, and innovation. As Japan’s Nikkei noted in an editorial, “India’s ascent is a reminder that economic dynamism has shifted from the old industrial powers to the demographic giants of the South” (Nikkei Asia, June 2026).
Discover more from The Economy
Subscribe to get the latest posts sent to your email.
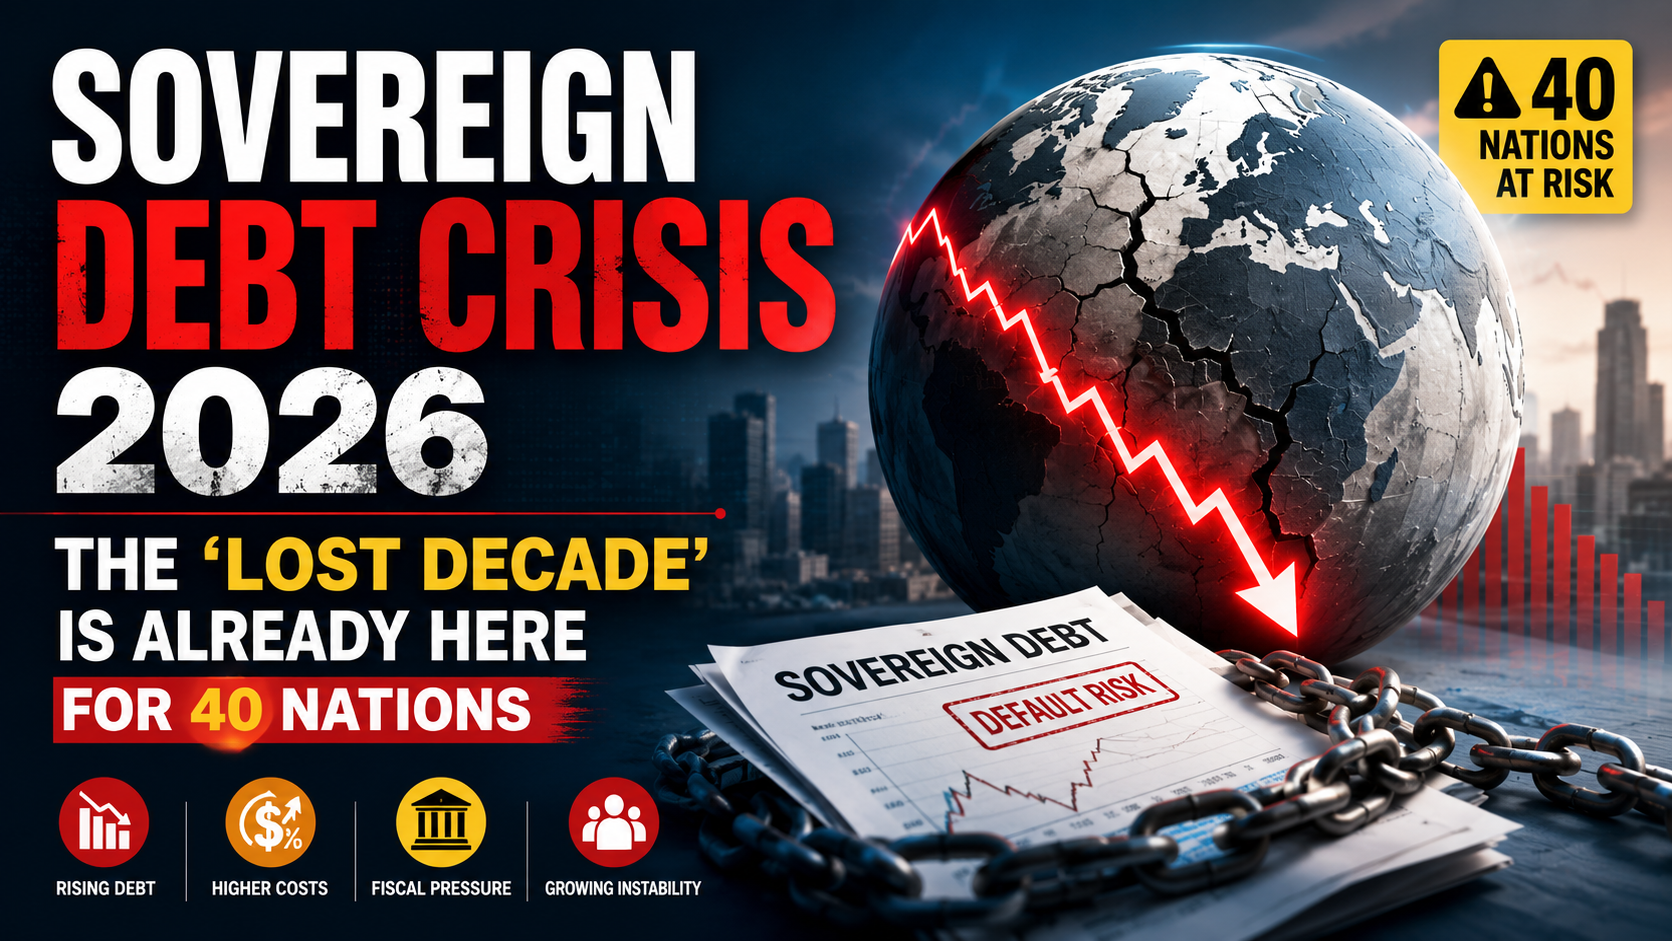
World Bank Issues Its Starkest Warning Yet for Developing Economies
Half of the world’s low‑income countries are poorer today than they were before the COVID‑19 pandemic, the World Bank’s Global Economic Prospects report for June 2026 declares. The report paints a grim picture of a sovereign debt crisis 2026 that is pushing 40 developing nations into a lost decade of economic stagnation, rising poverty, and dwindling human capital (World Bank, Global Economic Prospects, June 2026). “A tepid global recovery, tight monetary conditions, and escalating climate impacts have created a perfect storm for the world’s most vulnerable economies,” the Bank’s chief economist wrote in the foreword. The consequences are not just economic; they are unraveling decades of development gains.
The Vicious Cycle of Debt Distress
The mechanics of the crisis are well‑rehearsed but no less devastating. Developing countries borrowed heavily during the pandemic to sustain livelihoods and later to cope with food and energy price spikes after the Ukraine war and the 2024–25 El Niño. Much of that borrowing was on commercial terms—Eurobonds and syndicated loans with high interest rates and short maturities. When the Federal Reserve and other advanced‑economy central banks raised rates to fight inflation, the dollar strengthened, and global risk appetite shrank. Countries faced a triple whammy: higher debt servicing costs, weaker currencies that inflated the local‑currency value of dollar‑denominated debt, and reduced access to new financing.
The World Bank reports that the median external debt‑to‑GNI ratio for low‑income countries has climbed to 65%, up from 42% in 2019. Debt service is absorbing an average of 22% of government revenue, crowding out spending on education, health, and infrastructure. Zambia, which defaulted in 2020 and only concluded a protracted restructuring in 2024, is again in distress as copper prices have declined and new loans carry steep premiums. Ghana’s 2024 restructuring has not restored market access; its international bonds still trade at deeply distressed levels. Ethiopia, in the midst of a civil conflict recovery, is attempting to restructure $30 billion of external debt under the G20 Common Framework, but negotiations with private creditors and China, its largest bilateral lender, are gridlocked over the comparability of treatment principle (IMF Press Briefing, June 2026).
The “Lost Decade” for Human Capital
The fiscal squeeze is translating into a human tragedy. The UN Development Programme estimates that 1 in 3 children in debt‑distressed low‑income countries are out of school, up from 1 in 5 in 2019. Public health spending per capita has fallen by 12% in real terms since 2019 in sub‑Saharan Africa, leaving health systems unprepared for recurrent climate‑related disease outbreaks. The World Bank warns that the “learning poverty” rate—the share of 10‑year‑olds unable to read a simple text—has surged to 85% in the worst‑affected countries. This erosion of human capital will permanently lower the growth potential of a generation.
Climate change is amplifying the debt trap. When a cyclone hits Mozambique or a drought withers crops in the Sahel, the reconstruction costs force governments to take on more emergency debt, often at punitive rates, while climate‑proofing infrastructure is deferred due to lack of grant finance. The World Bank calculates that the 40 most climate‑vulnerable, debt‑distressed nations face an average annual climate‑related loss of 3.2% of GDP, exceeding their total inward foreign direct investment (World Bank, “Climate and Debt Nexus” report, June 2026). The promised $100 billion‑a‑year climate finance goal (now $2.4 trillion ask) remains unmet, and only 25% of that arrives as grants rather than loans, further adding to debt stocks.
Multilateral Reform: Too Little, Too Late?
The international community’s response remains inadequate. The G20 Common Framework, designed to coordinate debt relief among Paris Club, non‑Paris Club, and private creditors, has been slow and beset by legal disputes. Only a handful of countries have reached agreements, and the process lacks enforcement power. The IMF has proposed a “Bridgetown 2.0” initiative, championed by Barbados Prime Minister Mia Mottley, which would create a systemic debt‑for‑nature swap facility, a new issuance of Special Drawing Rights channeled to developing countries, and a permanent sovereign debt restructuring mechanism (UN General Assembly, “Bridgetown 2.0 Briefing”, May 2026). The proposal has broad support among developing nations but faces resistance from some creditor countries worried about moral hazard and the precedent of automatic debt write‑downs.
The World Bank itself is undergoing a capital adequacy review to stretch its balance sheet, potentially freeing up an additional $100 billion in lending capacity over a decade. But even this is insufficient relative to the trillions in investment needed. Private creditors, including large asset managers like BlackRock and Amundi, have signaled willingness to participate in “new money” deals if the IMF and World Bank provide credit enhancements and if countries adopt transparent fiscal rules. The “Zambia model” of a two‑stage restructuring—a relatively quick sovereign debt treatment, followed by a longer‑term reprofiling with GDP‑linked bonds—has become a template, but its replication has proven difficult.
Investor Implications
For global investors, the developing‑country debt crisis presents a high‑risk, high‑reward landscape. Distressed sovereign bonds of frontier markets offer yields of 15–25%, and vulture funds are circling. However, litigation risks, as seen in the Argentine saga, are high. The more constructive play is in “new money” bonds that come with World Bank partial guarantees, which are being developed for green infrastructure projects. Development finance institutions are also creating securitization structures that pool diversified climate‑resilient assets, offering investors a blended return with credit enhancement. The key is to be selective: countries with credible IMF programs, diversified export bases (like Senegal and Rwanda), and manageable bilateral debt are better placed to navigate the crisis.
The World Bank’s stark message is that the lost decade is not a forecast; it is a lived reality. Without a dramatic acceleration in debt relief, concessional finance, and private‑sector innovation, the Sustainable Development Goals will be missed by a generation, and the human and geopolitical costs will reverberate far beyond the borders of the affected nations.
Discover more from The Economy
Subscribe to get the latest posts sent to your email.

Bitcoin $150k Milestone Achieved as US Sovereign Crypto Pivot Looms

S&P 500 7000 Target: Wall Street’s Bullish Case for Year‑End 2026

EU Greenwashing Enforcement Hits New Peak with €1.2 Billion Fast‑Fashion Fine

India Economic Rise 2026: How the Subcontinent Toppled Japan

Sovereign Debt Crisis 2026: The ‘Lost Decade’ Is Already Here for 40 Nations

Crude Oil Price Rally June 2026: OPEC+ Extends Cuts, Targets $100

China Housing Market Turnaround: White‑List Model Stabilises Prices

US Sovereign Debt Risk 2026: CBO Projects $50 Trillion, Fitch Warns

BRICS De‑Dollarization Strategy Takes Shape with $15 Billion Local‑Currency Push

Digital Euro Cross‑Border Pilot Goes Live: What It Means for Banks

AI Impact on Wages 2026: Productivity Soars, Paychecks Stagnate

Global Economic Outlook June 2026: Trade Fragmentation Bites

SpaceX IPO 2026: Inside the $2 Trillion Valuation That Remade Wall Street

Kevin Warsh’s Regime Change: The Federal Reserve in the Age of War, Inflation, and Political Pressure

PwC China Partner Payouts Cut Amid Evergrande Audit Fraud

Broadcom Market Value Loss: Revenue Forecast Disappoints

Investors Pile Into Bullish Dollar Bets as ‘US Exceptionalism’ Trade Returns

Here’s How Much It’ll Cost You to Be Part of SpaceX’s Record-Breaking $75 Billion IPO

Nasdaq Tumbles 4% as Chip and Memory Stocks Sink: A $1.2 Trillion Wipeout

How to Fix Pakistan’s Debt Economy: A Structural Blueprint

Japan’s Nikkei Scales Record Peak as AI Shares Track US Chip Rally

Smash Capital Leads $200M Funding for Allen Control Systems

Grinding the Already Ground: Pakistan’s Inflation Crisis

Democrats Draw a Red Line Around Military AI — And the Pentagon Is Already Pushing Back

New Investment Super-Cycle: AI, Green Energy & Re-Shoring

JPMorgan Cuts Anthropic AI Access in Hong Kong

Xponential Fitness Franchise Lawsuit: The $3.97M Judgment

Middle East Conflict Oil Prices: The $4 Surge Explained
-

 Markets & Finance6 months ago
Top 15 Stocks for Investment in 2026 in PSX: Your Complete Guide to Pakistan’s Best Investment Opportunities
-

 Analysis4 months ago
Top 10 Stocks for Investment in PSX for Quick Returns in 2026
-

 Analysis5 months ago
Brazil’s Rare Earth Race: US, EU, and China Compete for Critical Minerals as Tensions Rise
-

 Analysis4 months ago
Johor’s Investment Boom: The Hidden Costs Behind Malaysia’s Most Ambitious Economic Surge
-

 Banks5 months ago
Best Investments in Pakistan 2026: Top 10 Low-Price Shares and Long-Term Picks for the PSX
-

 Investment6 months ago
Top 10 Mutual Fund Managers in Pakistan for Investment in 2026: A Comprehensive Guide for Optimal Returns
-

 Global Economy6 months ago
15 Most Lucrative Sectors for Investment in Pakistan: A 2025 Data-Driven Analysis
-

 Global Economy6 months ago
Pakistan’s Export Goldmine: 10 Game-Changing Markets Where Pakistani Businesses Are Winning Big in 2025