
Analysis
IMF Global Growth Forecast 2026: War, Tariffs, and AI Uncertainty Shatter the Recovery
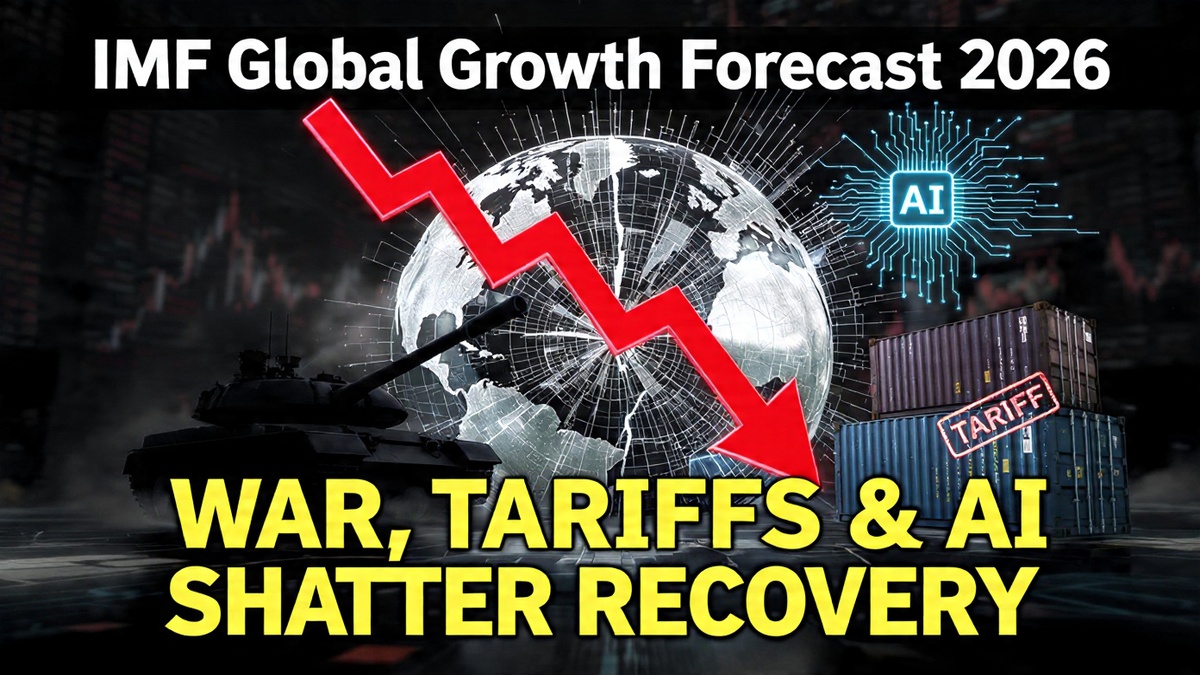
The IMF cut its 2026 global growth forecast to 3.1% as the Iran war, renewed US tariff threats, and AI investment uncertainty converge. Inside the most fragile global economic outlook since COVID.
The International Monetary Fund’s April 2026 World Economic Outlook carried an unusually sober subtitle: Global Economy in the Shadow of War. It was not rhetorical flourish. The Fund revised its global growth forecast to 3.1%, down from 3.4% in 2025, describing the path ahead as “fragile and highly sensitive to further disruption.” For a global economy already navigating post-pandemic fiscal consolidation, residual supply chain reorganisation, and the early strains of AI-driven labour displacement, the additional weight of a major Middle East war proved decisive in shifting the risk calculus.
Three Shocks Arriving Simultaneously
The IMF identified three overlapping risks that distinguish 2026’s fragility from prior cycles. First, the geopolitical shock: the US-Israeli war on Iran, which disrupted Strait of Hormuz oil flows, triggered inflation across energy-dependent economies, and introduced military escalation scenarios that financial markets struggled to price. Second, trade policy uncertainty: the Trump administration’s inauguration of an investigation into 60 countries for alleged facilitation of forced-labour imports — including the European Union — with tariffs of 10-12.5% threatened on their exports to the United States. Third, AI investment uncertainty: the possibility that the large AI productivity gains priced into equity markets may arrive more slowly, or be more concentrated, than consensus assumes.
The Financial Stability Board’s Warning on War Risk
The Financial Stability Board — comprising central bankers, regulators, and finance ministers from G20 countries — warned that the Middle East conflict was creating significant global financial instability, with rising market volatility, tighter financial conditions, and risks from stretched asset valuations, high leverage in non-bank finance, and liquidity mismatches. The FSB explicitly flagged that these vulnerabilities could amplify shocks in sovereign bond markets, private credit, and broader financial stability if conditions deteriorated.
Against this backdrop, Goldman Sachs documented hedge funds buying a record $86 billion in stocks over five sessions — a surge driven mainly by systematic, trend-following strategies responding to easing geopolitical tensions. The bank estimated funds could add another $70 billion if momentum continued. The divergence between systematic strategy positioning and the IMF’s fundamental outlook captured the market’s central tension: short-term momentum traders on one side, long-term structural risk assessors on the other.
Regional Divergence: Banks Profit, Emerging Markets Struggle
Major US banks delivered first-quarter earnings that reflected institutional resilience rather than broader economic health. Goldman Sachs posted its best quarter in years. Morgan Stanley’s stock traders benefited from volatility-driven volume surges. Bank of America reported earnings growth driven by higher trading revenue. The “big six” US banks collectively posted profits above consensus estimates — a pattern that reflects how institutional financial businesses often benefit from the very volatility that damages real-economy participants.
South Korea’s financial markets, after a sharp March selloff, attracted returning foreign investors on easing Middle East tensions, AI-driven tech demand, and reform momentum. But the won remained near multi-decade lows, and the economy retained significant exposure to energy price shocks. UK lenders began cutting fixed mortgage rates as swap rates fell following the stabilisation of Middle East tensions — offering relief to borrowers, though rates remained elevated relative to pre-crisis levels.
The divergence between institutional financial performance and household economic wellbeing is one of 2026’s defining features. Financial markets can absorb, price, and even profit from uncertainty. Households and small businesses, lacking the hedging tools and balance sheet depth of institutions, bear the uncertainty without corresponding offset.
Discover more from The Economy
Subscribe to get the latest posts sent to your email.
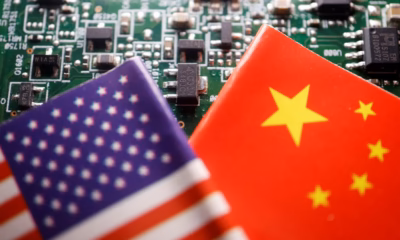


China’s domestic chip ecosystem is accelerating even as US export controls tighten. With tungsten up 557% and Nvidia’s China share halving, we map the permanent splitting of the global semiconductor supply chain.The global semiconductor supply chain is bifurcating. This statement was contested in 2023, hedged in 2024, and is now — as of 2026 — treated as a structural baseline by supply chain strategists, chipmakers, and government planners on both sides of the Pacific. The question has shifted from whether the split will happen to how deep and permanent it will become.
The evidence is visible in multiple datasets simultaneously. Nvidia, which once commanded over 90% of the Chinese AI chip market, had seen that share decline to approximately 50% by early 2026 — not because US export controls had successfully denied China access to capable chips, but because the combination of tariffs, “buy local” mandates, and regulatory uncertainty had accelerated Chinese enterprises’ migration to domestic alternatives. Meanwhile, China’s semiconductor output surged 87% year-on-year in May 2026, underscoring that domestic production capacity was advancing at a pace that few had forecast five years ago.
The Tungsten Shock: A Materials Leverage Beijing Chose to Use
In February 2026, China added tungsten to its export control list as trade tensions with the United States escalated. The consequence was rapid and severe. Tungsten prices rose 557% in just over a year — outperforming gains in gold, copper, and oil by a wide margin. Chinese exports of restricted tungsten products fell approximately 40% in 2025. The strategic logic was precise: China controls roughly 79% of global tungsten mine production, and tungsten’s exceptionally high melting point and density make it an essential input for chipmaking — both in chips themselves and in multiple fabrication processes at advanced nodes.
The move demonstrated that materials leverage extends far beyond rare earths. For semiconductor supply chains already under AI-driven demand stress, the tungsten shock added a new category of critical bottleneck that western efforts to build alternative supply chains cannot resolve in the near term.
Nvidia’s Paradox: Export Controls and the H200 Restart
The Nvidia-China relationship in 2026 illustrates the inherent contradiction of export controls applied to commercially motivated technology companies. After a roughly ten-month freeze on advanced chip exports to China — during which Nvidia absorbed a $5.5 billion charge tied to stranded inventory — a December arrangement allowed H200 sales to approved Chinese customers, with the US government taking a 25% cut of revenues. The arrangement normalised commerce while creating a fiscal mechanism for the US government.
Chinese tech firms collectively placed orders for more than two million H200 units for 2026 delivery — a volume that simultaneously demonstrates unmet demand and the limits of export control effectiveness. Where legal channels are closed, demand finds other pathways: a DOJ indictment unsealed in 2026 detailed a scheme involving approximately $2.5 billion in Supermicro servers containing restricted Nvidia GPUs being smuggled to Chinese buyers.
China’s Domestic Progress: Real but Incomplete
China’s semiconductor self-sufficiency ambitions are advancing, but the trajectory is uneven across subsectors. SMIC and Hua Hong have made genuine progress at mature nodes. Equipment vendors Naura and AMEC are gaining market share globally. The country’s AI chip domestic alternatives — while not yet matching Nvidia’s leading-edge capability — are advancing at an accelerating pace under the pressure of necessity.
The critical constraint remains high-bandwidth memory. CXMT, China’s domestic HBM producer, is targeting viable HBM3 yields in 2026 and HBM3E by 2027. If those milestones are achieved on schedule, Nvidia’s current China advantage — which exists precisely because China’s domestic HBM production remains constrained — will narrow materially. The competitive window is real but finite.
The Strategic Implication: Permanent Bifurcation as Business Baseline
For supply chain strategists, the most consequential shift is not any individual export control or price spike — it is the recognition that the global semiconductor supply chain’s bifurcation is permanent. Semiconductor leaders navigating this environment most effectively are treating the US-China bifurcation as a structural feature of the landscape, not a temporary disruption awaiting resolution.
This means conducting detailed audits of supplier dependencies, stress-testing revenue models against scenarios where China access is restricted or structurally changed, and tracking China’s domestic chip progress as a competitive variable rather than a geopolitical curiosity. Revenue projections that assume stable China market access now carry geopolitical risk that most financial models have not historically priced.
The age of a single, integrated global semiconductor supply chain is over. The question is how many chains will replace it, and at what cost.
Discover more from The Economy
Subscribe to get the latest posts sent to your email.
AI
AI Infrastructure Debt Bubble 2026: $570 Billion in Global Debt Issuance Raises Systemic Risk Alarm

Morgan Stanley estimates AI-related global debt issuance will hit $570 billion in 2026, with hyperscaler spending exceeding $1 trillion by 2027. Oracle’s crisis may be the first systemic warning sign.
The question Wall Street was reluctant to ask openly throughout 2024 and most of 2025 is now unavoidable: is the AI infrastructure buildout generating a debt burden that markets have not yet properly priced?
The numbers have become too large to dismiss as routine capital expenditure cycles. Morgan Stanley estimates that AI-related global debt issuance will more than double to nearly $570 billion in 2026, with aggregate hyperscaler capital expenditure projected to exceed $1 trillion by 2027. That figure encompasses spending by Amazon, Microsoft, Alphabet, Meta, Oracle, and a growing constellation of second-tier infrastructure providers building the physical layer of the AI economy.
How the Debt Stack Has Built
The trajectory of Oracle’s balance sheet is instructive as a case study in the speed at which leverage can accumulate. In fiscal 2025, Oracle carried a net cash deficit of approximately $394 million after free cash flow. By the end of fiscal 2026, that had deteriorated to negative $23.7 billion in free cash flow, with long-term debt reaching approximately $124.7 billion. Capital expenditures of $55.7 billion in a single fiscal year represent a 162% increase from the prior year.
Oracle is not alone, though its position is the most stretched. The structural dynamic across the hyperscaler complex is that the companies investing most aggressively in AI data centre capacity are simultaneously facing competitive pressure on their existing software and cloud businesses from AI-native tools — creating a margin squeeze that occurs precisely when cash demands are highest.
Credit Default Swaps as an Early Warning System
One underappreciated signal in this cycle is the behaviour of credit default swaps. Fortune reported that Morgan Stanley’s Lisa Shalett flagged Oracle’s CDS widening as a potential early indicator of broader AI trade stress. CDS spreads — which function as insurance premiums against corporate default — had reached record levels for Oracle by early 2026, even before the most recent earnings-related stock decline.
The concern Shalett articulated was systemic rather than company-specific: “If people start getting worried about Oracle’s ability to pay, that’s gonna be an early indication to us that people are getting nervous.” For a company whose debt is included in major corporate bond indices, the widening of Oracle’s CDS spreads has implications not just for Oracle investors but for anyone holding investment-grade credit exposure broadly.
Bank of America Research described “the lack of clarity on hyperscaler borrowing” as “the key risk going into 2026” — a view validated by subsequent events as Oracle’s stock collapsed and CDS widened even further.
The OpenAI Nexus
A critical vulnerability embedded in the current AI infrastructure cycle is concentration around OpenAI as both the defining customer and the primary justification for hyperscaler spending. Oracle‘s remaining performance obligations are concentrated at least $300 billion in the OpenAI relationship. OpenAI itself is burning cash at what one analyst described as “an insane rate” and has committed to more than $1.4 trillion in total AI buildouts — a commitment that depends on the company’s own ability to sustain fundraising and ultimately generate revenue at scale.
The logical chain from that dependency is a concern articulated plainly by Melius Research: “It is hard to know if Oracle can stick to this capex plan if incremental business arises from the likes of OpenAI and Anthropic. Also, its competitors are unlikely to slow spending and could use Oracle’s spending moderation as the means to gain share.” The competitive dynamic creates a collective action problem: no single hyperscaler can slow down without ceding ground, yet the collective pace of spending is generating balance sheet stress across the sector.
Second-Order Vulnerabilities: Data Centre REITs and Chip Suppliers
The debt accumulation in hyperscaler balance sheets has second-order effects that are not captured in the headline AI capex numbers. Data centre real estate investment trusts — which provide the physical infrastructure that hyperscalers increasingly lease rather than own — have their own exposure to counterparty concentration and lease extension risk. Reports that Blue Owl, Oracle‘s primary data centre financing partner, declined to back the Michigan facility highlighted the fragility of the supporting ecosystem even when the primary tenant appears solvent.
Nvidia, whose chips underpin the entire AI buildout, has been insulated from these concerns by persistent demand that exceeds supply. But if even two or three hyperscalers simultaneously scaled back data centre spending in response to balance sheet pressures, the chip demand outlook would shift rapidly.
The Memory Shortage as Collateral Signal
CNBC reported in late June 2026 that “the memory shortage shaking Apple and Microsoft is an ‘existential crisis’ for smaller players” — a reminder that supply chain bottlenecks are not yet resolved, adding cost and execution risk to projects whose timelines are already being stretched. The combination of persistent demand exceeding supply, expensive debt financing, and uncertain monetisation schedules creates a financial engineering challenge that may prove harder to solve than the engineering challenges of building the data centres themselves.
The AI infrastructure cycle is not necessarily a bubble in the sense of zero underlying demand — the use cases are real and adoption is accelerating. But the debt structure being used to finance it, and the concentration of risk around a small number of foundational relationships, has introduced systemic vulnerabilities that markets are only beginning to price.
Discover more from The Economy
Subscribe to get the latest posts sent to your email.
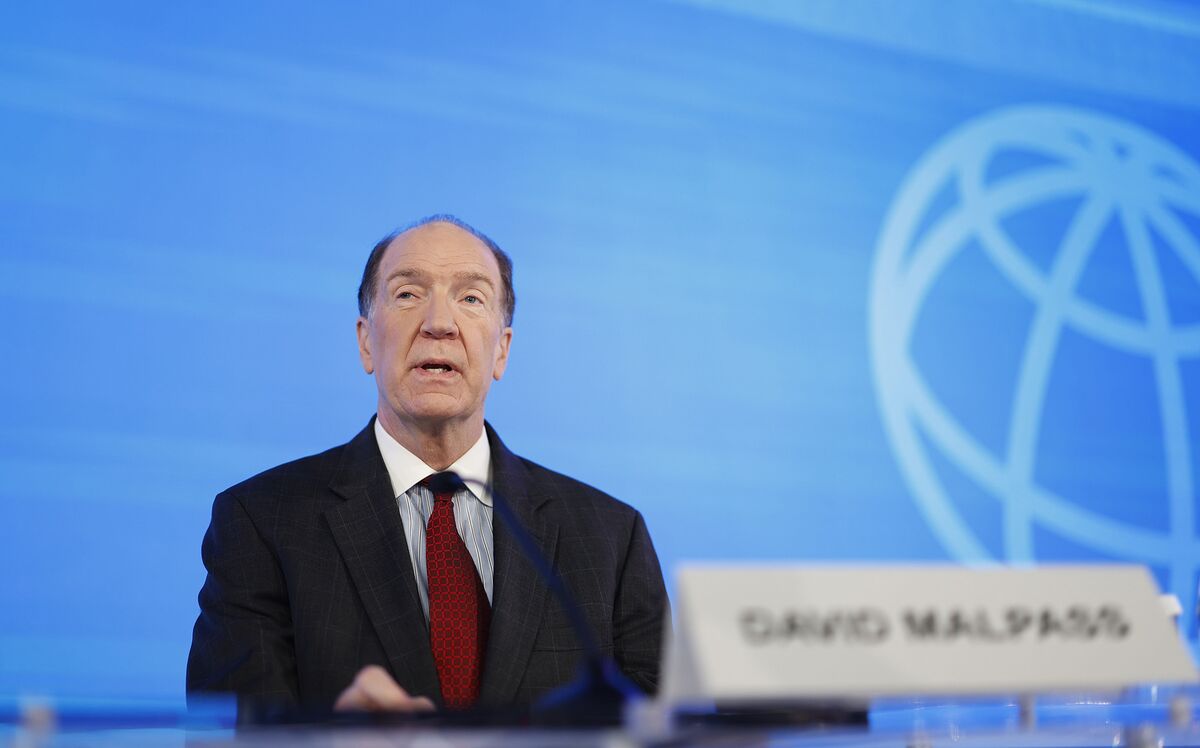
The World Bank projects global growth at 2.5% in 2026, the weakest since the pandemic, as the US-Iran conflict drives energy price spikes, inflation, and tighter monetary policy worldwide.The World Bank’s mid-2026 baseline carries a number that markets have had to absorb slowly: global GDP growth of 2.5% this year — the weakest since the pandemic — and the culprit is clear.
The World Bank’s latest Global Economic Prospects report identifies the US-Iran conflict that began in late February 2026 as the central shock reshaping the international economic outlook. Energy prices have risen sharply, inflation has re-accelerated across multiple continents, and central banks that had been on the verge of easing cycles have instead begun signalling hikes. The combination has compressed household incomes, widened fiscal deficits, and created a global policy dilemma — fight inflation or protect growth — that has no clean answer.
The Anatomy of the Slowdown
Emerging market and developing economies (EMDEs) face what the World Bank characterises as their weakest per capita income growth since the pandemic era. Growth is projected to decelerate across all EMDE regions in 2026, with the Middle East, North Africa, Afghanistan, and Pakistan bearing the worst damage given direct exposure to the conflict, higher energy import costs, and disrupted shipping. South Asia remains the fastest-growing EMDE region but has nonetheless seen forecasts revised downward.
The mechanism of transmission is threefold. Direct energy price exposure drives headline inflation and suppresses real consumer spending. Disruptions to Strait of Hormuz shipping — which handles roughly 20% of global oil trade — have compressed supply chains and added a risk premium to shipping costs more broadly. And the expectation of prolonged tighter monetary policy has pushed sovereign borrowing costs higher for indebted developing economies.
The Rio Times Global Economy Briefing captured the daily rhythm of the uncertainty: “Whether the US-Iran ceasefire holds. Renewed strikes would push oil higher and add to the inflation problem the Fed is already confronting.” As of the week of June 28, markets remained on edge about the durability of the ceasefire following reports of Iranian targeting of US military assets, which temporarily pushed Brent crude higher and triggered a brief equity sell-off before the market recovered.
Advanced Economies: Slow But Not Collapsing
Advanced nations face a different but related challenge: growth that was already below trend has been further dragged by energy costs and the policy response to inflation. Deloitte’s 2026 Global Economic Outlook noted that after years of disruptive US trade policy, the global trading system has partially reorganised — with numerous bilateral trade deals struck between non-US countries as an alternative to the US-centric framework.
France is projecting GDP growth of just 0.9% in 2026, according to Banque de France, with the contribution of net exports turning negative. Germany and Japan face their own exposure to the China Shock 2.0, as Chinese high-tech exports crowd into categories where both countries previously held competitive advantage. The US itself is navigating a narrowing current account deficit that reflects weaker domestic demand rather than export strength — an ambiguous signal that the Federal Reserve has explicitly flagged as complicating its rate decisions.
Fiscal Pressure and the Poverty Gap
One consequence of the conflict-driven slowdown that policy discussions often underweigh is the distributional impact on the world’s poorest economies. Low-income countries are projected to grow at 5.4% in 2026 — 0.3 percentage points below prior forecasts — as energy import costs consume fiscal space that would otherwise go to infrastructure, healthcare, and education. The World Bank projects that gains in per capita income, averaging 2.7% annually through 2027–28, will be “insufficient to significantly reduce poverty” given the breadth of the setback.
Fiscal pressures will limit governments’ ability to reduce food insecurity and create jobs — a combination the World Bank regards as a medium-term political risk as well as a humanitarian one. A newly identified Ebola outbreak in a low-income economy adds a further downside tail to the forecast.
The 2027 Recovery Thesis
The World Bank’s forward guidance is that a recovery should materialise in 2027–28, driven by an assumed decline in energy prices as supply adjusts and the conflict’s acute phase passes, and a rebound in global trade activity. That recovery is explicitly conditional on the ceasefire holding and conflict not escalating to involve Gulf oil infrastructure more directly. Recoveries are projected across all EMDE regions in 2027–28, but the pace will depend heavily on policy buffers — many of which were depleted fighting the post-pandemic inflation.
The upside scenario, acknowledged in the World Bank report, involves broader AI adoption lifting productivity and economic activity. Estimates of the productivity impact of AI vary “widely,” and the report notes that different scenarios “could lead to markedly different growth paths.” The AI tailwind is real but front-loaded in advanced economies, and access to the technology in lower-income countries remains constrained by infrastructure gaps and digital divides.
Discover more from The Economy
Subscribe to get the latest posts sent to your email.

IMF Global Growth Forecast 2026: War, Tariffs, and AI Uncertainty Shatter the Recovery

US-China Semiconductor War 2026: Bifurcation, Tungsten Shock, and the Race for AI Chips

Salt Is the New Oil: Critical Minerals, the 2026 Investment Playbook

AI Infrastructure Debt Bubble 2026: $570 Billion in Global Debt Issuance Raises Systemic Risk Alarm

Argentina Economy 2026: Milei’s Fiscal Surplus, Inflation Drop to 29%, and What Comes Next

Global Economic Growth 2026: World Bank Cuts Forecast to 2.5%

Gold Price 2026: J.P. Morgan Forecasts $6,000/oz as Inflation, Iran War

US Section 301 Tariffs 2026: 60 Countries Face 12.5% Duties on Forced Labour Goods

China Economy 2026: 87% Semiconductor Surge, Property Crisis

Kevin Warsh Fed 2026: Rate Hold, Hawkish Dot Plot, and the End of Forward Guidance

SpaceX IPO 2026: $2 Trillion Valuation, Retail Frenzy, and the Risks

Oracle AI Debt Crisis 2026: $130 Billion Gamble Triggers Worst Stock Crash Since Dot-Com Bust

Male Labor Force Participation Rate 2026: Why Men Are Leaving & Economic Impact

Trump Tariffs 2026: Economic Impact, Household Costs & Trade War Outlook

PwC China Partner Payouts Cut Amid Evergrande Audit Fraud

Broadcom Market Value Loss: Revenue Forecast Disappoints

Investors Pile Into Bullish Dollar Bets as ‘US Exceptionalism’ Trade Returns

Here’s How Much It’ll Cost You to Be Part of SpaceX’s Record-Breaking $75 Billion IPO

Nasdaq Tumbles 4% as Chip and Memory Stocks Sink: A $1.2 Trillion Wipeout

How to Fix Pakistan’s Debt Economy: A Structural Blueprint

Smash Capital Leads $200M Funding for Allen Control Systems

Democrats Draw a Red Line Around Military AI — And the Pentagon Is Already Pushing Back

New Investment Super-Cycle: AI, Green Energy & Re-Shoring

Grinding the Already Ground: Pakistan’s Inflation Crisis

Xponential Fitness Franchise Lawsuit: The $3.97M Judgment

Middle East Conflict Oil Prices: The $4 Surge Explained

The End of the Chatbot: Why OpenAI is Tearing Up Its Most Successful Product

Musk’s SpaceX Lines Up Retail Investors for Record IPO Allocation
-

 Markets & Finance6 months ago
Top 15 Stocks for Investment in 2026 in PSX: Your Complete Guide to Pakistan’s Best Investment Opportunities
-

 Analysis4 months ago
Top 10 Stocks for Investment in PSX for Quick Returns in 2026
-

 Analysis5 months ago
Brazil’s Rare Earth Race: US, EU, and China Compete for Critical Minerals as Tensions Rise
-

 Analysis4 months ago
Johor’s Investment Boom: The Hidden Costs Behind Malaysia’s Most Ambitious Economic Surge
-

 Banks5 months ago
Best Investments in Pakistan 2026: Top 10 Low-Price Shares and Long-Term Picks for the PSX
-

 Investment6 months ago
Top 10 Mutual Fund Managers in Pakistan for Investment in 2026: A Comprehensive Guide for Optimal Returns
-

 Global Economy6 months ago
15 Most Lucrative Sectors for Investment in Pakistan: A 2025 Data-Driven Analysis
-

 Global Economy6 months ago
Pakistan’s Export Goldmine: 10 Game-Changing Markets Where Pakistani Businesses Are Winning Big in 2025