
Analysis
Greg Abel’s Patient Baton: How Discipline—Not Drama—Will Define Berkshire Hathaway’s Next Century

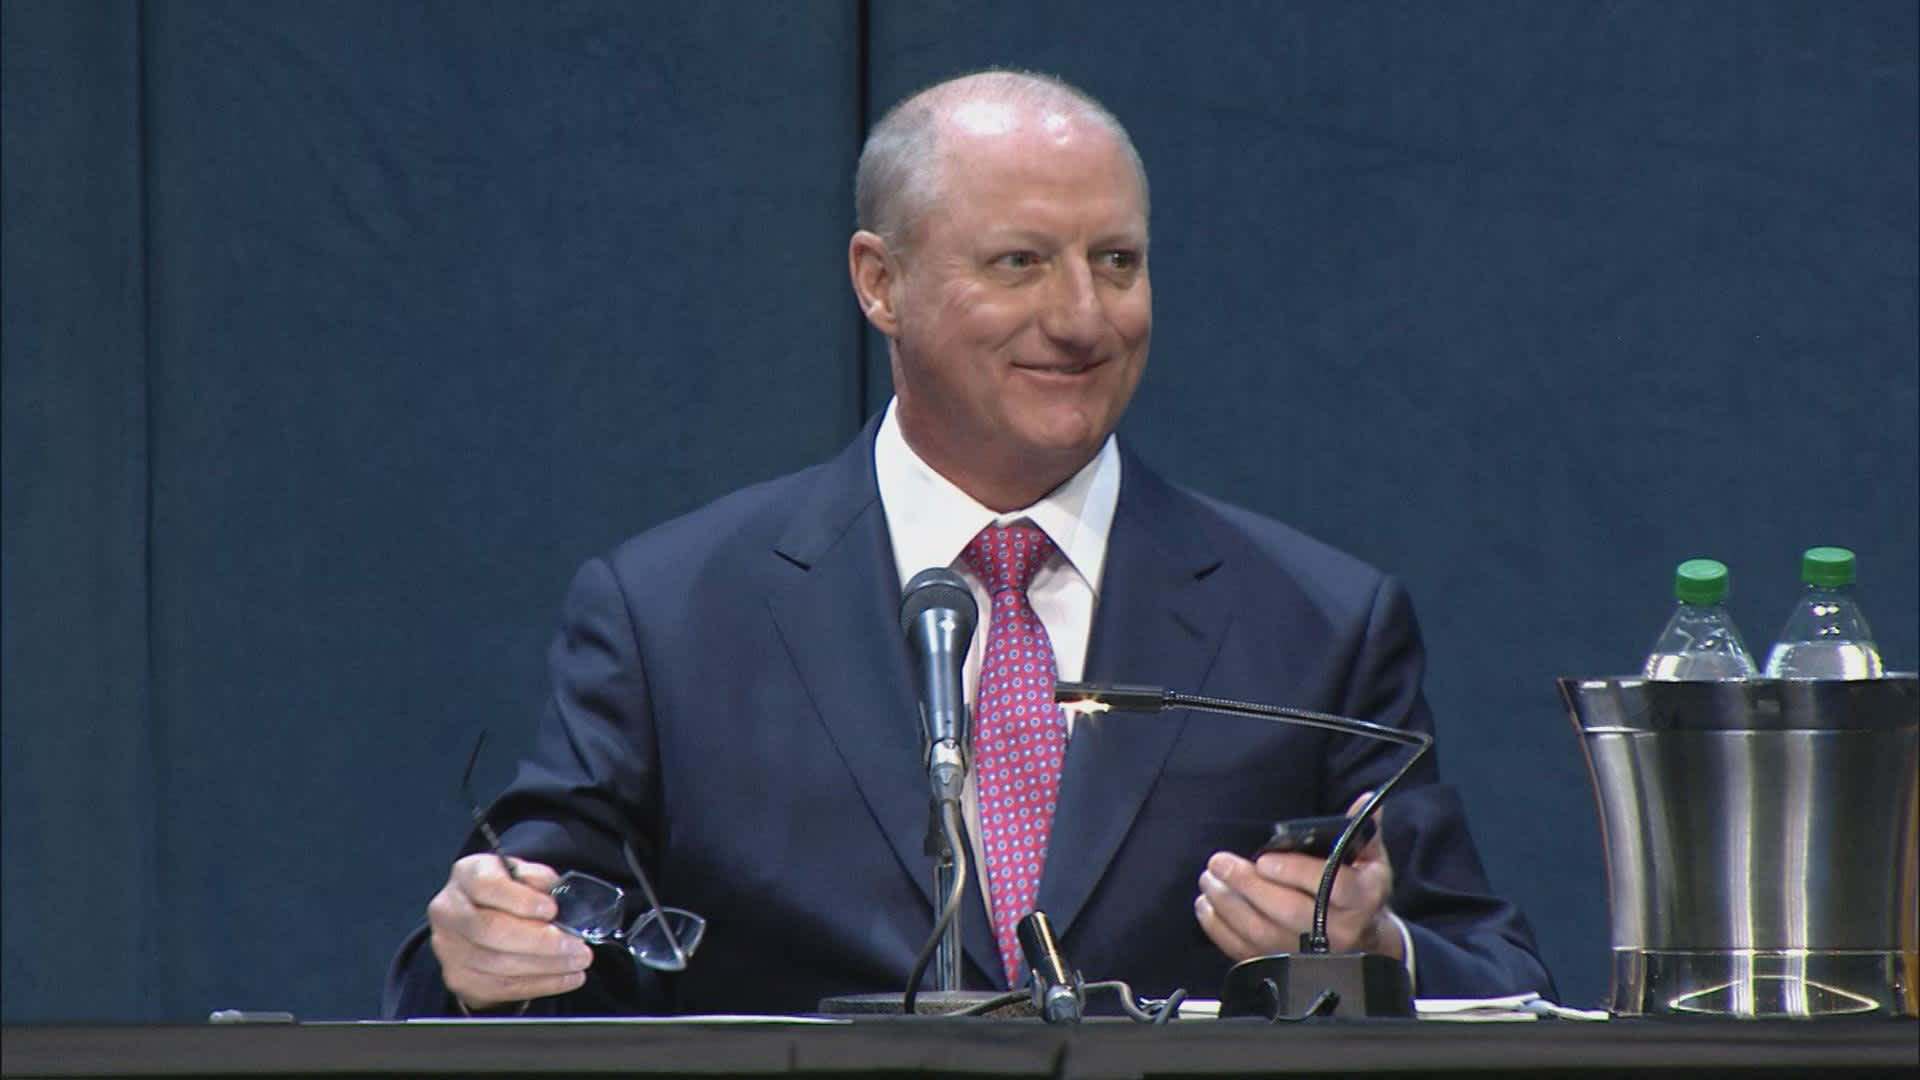
Greg Abel’s first annual meeting as Berkshire Hathaway CEO delivered a clear signal: patience and disciplined capital allocation will define the post-Buffett era. With a record $397.4 billion cash pile and operating earnings up 18%, here’s what investors need to understand.
The Morning After a Legend Leaves the Stage
When someone really special steps down, it gets really quiet. On May 2, 2026, at the CHI Health Center in Omaha, Nebraska, the people who own parts of Berkshire Hathaway got together for their yearly meeting. This was the first time in 60 years that Warren Buffett wasn’t in charge of the meeting. The big room was only half full, which was really different from the 40,000 people who used to come every year. And the simple, wise sayings that Warren Buffett used to share with everyone were mostly gone.
It felt like something was missing, like the air in the room wasn’t the same without him. The meeting was still important, but it wasn’t the same without the person who had been leading it for so long. People were probably thinking about how things would change now that Warren Buffett wasn’t in charge. The quiet in the room was like a sign that something big had happened, and everyone was waiting to see what would come next. Instead of flashy announcements, the CEO focused on in-depth business talks, key performance numbers, and a well-structured approach. As the sole leader of the sixth-largest company in the world, he gave his first public presentation and said exactly what long-term investors wanted to hear. He showed that he is a careful and disciplined CEO, which is what the company needed at this time. This approach was a breath of fresh air for investors who are in it for the long haul.
“One of our greatest strengths at Berkshire is patience and being disciplined at allocating our capital. We’re not anxious to deploy capital into subpar opportunities.” — Greg Abel, Berkshire Hathaway CEO, Omaha, May 2, 2026
Greg Abel, 63, the Canadian-born engineer-turned-conglomerate-executive who spent more than 25 years earning Buffett’s trust, stood before shareholders and said something profoundly unfashionable in an era of algorithmic trading, AI hype cycles, and relentless activist pressure: we are not in a hurry.
That restraint is not timidity. It is strategy. And understanding why it may be the most sophisticated capital allocation posture available to a $1 trillion enterprise in today’s market environment is the central task of this analysis.
Abel’s First Letter: Stewardship, Not Showmanship
Before the Omaha meeting, Abel authored his first annual shareholder letter as CEO—a document that financial analysts, value investors, and institutional allocators parsed with the intensity usually reserved for Federal Reserve minutes. The letter’s opening paragraph set the tone with elegant simplicity: “Your capital is commingled with ours, but it does not belong to us. Our role is stewardship.”
That single sentence—eight words distilled from decades of Buffett doctrine—tells you nearly everything about how Abel intends to run Berkshire. He is not positioning himself as a disruptor. He is positioning himself as a custodian.
The letter repeatedly invoked net operating cash flow as the true compass for evaluating Berkshire’s varied businesses, comparing current performance against five-year averages rather than quarterly analyst estimates. Abel committed to assessing value carefully, acting patiently, and holding for the long term—”preferably forever.” He reiterated the fortress balance sheet as a non-negotiable asset, writing that Berkshire’s liquidity ensures the company “can act decisively when opportunities appear and remain resilient during difficult periods.”
This is the language of a man who has read the entire Buffett canon, internalized it, and is now authoring the next chapter in the same idiom—without copying the syntax.
The $397 Billion Question: Patience or Paralysis?
The most provocative number hovering over the 2026 annual meeting was not an earnings figure but a bank balance. Berkshire’s cash, Treasury bills, and short-term securities reached a record $397.4 billion at the end of Q1 2026, up from $373 billion at year-end 2025—itself a record inherited from Buffett’s 13-consecutive-quarter streak as a net seller of equities.
For context, $397 billion is roughly the GDP of Malaysia. It exceeds the market capitalization of most S&P 500 companies. It is not a liquidity buffer. It is a strategic arsenal.
Critics will frame this as elephantine inertia—a conglomerate so large it can no longer find elephants large enough to hunt. That framing mistakes constraint for character. Berkshire is not sitting on cash because it cannot decide what to buy. It is sitting on cash because, as both Abel and Buffett made clear on Saturday, the prices being asked for most assets do not reflect the returns Berkshire requires.
Buffett, now 95 and attending as chairman emeritus, said it plainly in a sideline interview with CNBC’s Becky Quick: “It isn’t our ideal environment in terms of deploying cash for Berkshire,” citing elevated market valuations as the central obstacle. He noted that prices for “an awful lot of things will look awfully silly,” channeling the same sensibility he expressed in his famous 1999 Fortune essay warning against extrapolating a decade of equity returns into the next.
Abel echoed the sentiment from the stage with characteristic operational precision: “It doesn’t mean you need to deploy all your capital and spend all your money.” He acknowledged that Berkshire had identified several firms with interesting management and operations but wasn’t interested in paying current valuations to own them. This is not indecision—it is the Ted Williams strike zone philosophy applied to corporate finance. Wait for your pitch.
The brilliance of that posture becomes clearer when you consider the alternative. A CEO who felt compelled to spend $400 billion to demonstrate decisiveness would almost certainly overpay, diluting decades of compounding in the process. The history of corporate M&A is a graveyard of such urgency.
Operating Results: The Unglamorous Engine Keeps Humming
While the cash pile attracts the headlines, the underlying engine of Berkshire’s operating businesses continues to generate returns that most conglomerates can only envy. Q1 2026 operating earnings came in at $11.35 billion, up nearly 18% year-over-year—a number that reflects the durable cash generation of Berkshire’s 60-plus operating subsidiaries rather than the volatility of mark-to-market investment gains.
Net income attributable to shareholders more than doubled, rising to $10.1 billion from $4.6 billion in Q1 2025, as the value of Berkshire’s equity portfolio—still anchored by Apple, American Express, Coca-Cola, and Moody’s—appreciated sharply.
The insurance segment, long the golden goose of Berkshire’s float-driven model, delivered an underwriting profit of $1.7 billion, up from $1.34 billion in the same period last year. Ajit Jain, the legendary insurance chief who joined Abel onstage in Omaha, reinforced the discipline-over-volume philosophy: insurance premiums are only written when they can be done profitably, on terms that make sense for the long haul. When the market softens and competitors chase volume at inadequate rates, Berkshire pulls back—even if the resulting numbers look temporarily rough.
BNSF railroad and Berkshire Hathaway Energy both showed improved operating results, with Abel spending considerable time on his energy businesses’ pivotal role in the AI infrastructure buildout. His observation that hyperscalers and data centers “have to bear the full cost” of the energy they consume was both a policy statement and a revenue signal: Berkshire’s utility assets are positioned to be among the key beneficiaries of the data center boom, provided the regulatory and cost frameworks are structured fairly.
Continuity vs. Evolution: What Actually Changes Under Abel?
The meeting carried the branding “The Legacy Continues”—a phrase that could read as reassurance or as obligation, depending on your disposition. For investors trying to map Abel’s tenure against Buffett’s, three meaningful differences are worth tracking closely.
Communication style. Buffett translated capitalism into parable. Abel translates it into operations. Where Buffett might invoke Ben Franklin, Abel will cite net operating cash flow and five-year averages. This is not a deficiency—it is a different skill set. Abel spent decades as the hands-on operator of Berkshire Hathaway Energy, running a complex regulated utility empire across multiple jurisdictions. He thinks in infrastructure, not allegory. Shareholders who were drawn to Omaha for Buffett’s wit will need to recalibrate; those drawn for financial substance will find Abel’s style more directly useful.
Collaborative leadership. Abel notably shared the stage with his top lieutenants—a departure from the Buffett-Munger bilateral that defined the meeting’s format for decades. CEOs of Dairy Queen, See’s Candies, Brooks Running, and Jazwares were given time to address shareholders. NetJets CEO Adam Johnson, who now oversees 32 retail and service businesses, was prominently featured. This distributed model signals something important: Abel is building an institutional structure, not a cult of personality. When the latter is inevitable (as it was with Buffett), it is also irreplaceable. When the former is constructed deliberately, it endures.
Technology posture. Buffett famously avoided technology investments for most of his career, then made an extraordinarily well-timed bet on Apple. Abel is carving out a more nuanced stance. He told shareholders that Berkshire “isn’t going to do AI for the sake of AI,” but acknowledged that AI presents both significant opportunities (particularly through the energy infrastructure that powers data centers) and existential risks—including the cybersecurity vulnerabilities illustrated, somewhat surreally, when the first shareholder question of the day arrived via a deepfake of Buffett himself.
The Cultural Moat: Berkshire’s True Durable Advantage
Perhaps the most underappreciated element of Berkshire’s post-Buffett positioning is the cultural architecture that Buffett spent 60 years constructing. Dan Sheridan, CEO of Brooks Running, captured it well from the floor of the exhibit hall: “I think this is a very deeply rooted culture that Warren has created, and I believe the transition to Greg is going to be rooted in those values that Warren has for 60 years instituted and will continue.”
That culture operates on several levels simultaneously. At the subsidiary level, Berkshire’s radical decentralization—CEOs run their businesses with minimal headquarters interference, maximizing accountability and entrepreneurial energy—has survived multiple management transitions at the operating company level without degradation. At the capital allocation level, the aversion to what Abel called the “ABCs”—arrogance, bureaucracy, and complacency—functions as an immune system against the empire-building tendencies that have destroyed shareholder value at comparable conglomerates.
Critically, the float model—insurance premiums invested in equities and bonds before claims are paid—remains structurally intact and irreplaceable. No competitor can simply choose to replicate it. It took Buffett and Jain decades to build GEICO and General Re and the reinsurance operations into the capital generation machines they are today. This is the moat that other moats flow from, and Abel understands it at the granular operational level that the job requires.
The Japan Chapter: Patient Capital’s Finest Recent Chapter
One of Buffett’s most celebrated late-career decisions—accumulating roughly $20 billion in stakes across five major Japanese trading houses (Itochu, Marubeni, Mitsubishi, Mitsui, and Sumitomo)—remains a template for how Berkshire approaches patient capital deployment at scale. Those positions, initiated quietly in 2019 and revealed on Buffett’s 90th birthday, have since generated substantial gains as the trading companies reported record profits, increased dividends, and bought back shares aggressively.
The Japan investments embody the Berkshire thesis in concentrated form: identify businesses with durable economics trading at irrational discounts, accumulate quietly, hold without the pressure to demonstrate activity, and let compounding do the heavy lifting. Abel has signaled that Berkshire’s relationship with its Japanese partners will continue and deepen. More broadly, the Japan playbook offers a template for how $397 billion in dry powder might eventually be deployed—not in a single transformative acquisition, but in patient accumulation of concentrated positions in undervalued, cash-generative businesses, wherever global dislocations create them.
Key Investor Takeaways
For investors assessing Berkshire in the post-Buffett era, several signals deserve close attention:
- The buyback signal. Berkshire repurchased $234.2 million in stock during Q1 2026—modest but meaningful, its first buyback activity since May 2024. The resumption suggests Abel views current prices as at or below intrinsic value, a useful calibration data point. The average Class A repurchase price of $729,701 and Class B price of ~$486.92 establish implicit floor valuations.
- The valuation discipline signal. Abel explicitly told shareholders that Berkshire has identified companies with excellent management and operations but won’t pay current prices. This is Berkshire’s version of a disciplined capital deployment framework: the opportunity set exists, but the entry prices do not yet justify action.
- The insurance discipline signal. Jain’s comments about pulling back in competitive market conditions—even at the cost of volume—confirm that Berkshire’s insurance profitability is structural, not cyclical. The $1.7 billion underwriting profit in a quarter when peers were facing elevated catastrophe losses is not accidental.
- The AI infrastructure signal. Abel’s emphasis on Berkshire’s energy businesses as essential infrastructure for the data center boom represents the most actionable near-term growth vector for a company of Berkshire’s scale. Unlike direct AI investments, utilities provide regulated, predictable returns with AI-driven tailwinds—precisely the kind of investment profile Berkshire has always preferred.
The Elephant in the Room: Scale as Berkshire’s Primary Challenge
Any honest analysis of Berkshire’s post-Buffett prospects must grapple with the constraint that Abel himself will never quite name directly: size. At roughly $1 trillion in market capitalization and $397 billion in available capital, Berkshire has effectively outgrown the universe of investments that can move the needle. A $10 billion acquisition that would transform a mid-cap company is almost irrelevant to Berkshire’s per-share value. Only acquisitions in the $50 billion–$150 billion range register meaningfully—and at current valuations, such acquisitions are nearly impossible to execute at returns Berkshire would accept.
This is the fundamental tension of the Abel era, and it has no clean resolution. The most likely outcome is a gradual shift toward more international exposure (building on the Japan template), larger bolt-on acquisitions within existing verticals like energy and industrials where Abel has the deepest expertise, and continued share repurchases when prices are attractive.
What the scale constraint definitively rules out is the kind of transformative bet—a General Re in 1998, a Burlington Northern in 2009—that Buffett made at critical junctures to reshape Berkshire’s future. Those opportunities required not just capital but a market dislocation severe enough to offer Berkshire-sized targets at Berkshire-acceptable prices. They are rare, and when they appear, Abel will need to act with the conviction of someone who has never previously managed an investment portfolio at the public company level. That is a legitimate and unresolved question.
Why Patience Remains a Superpower
Buffett, in his sideline CNBC interview, made an observation that cuts to the heart of why Berkshire’s cash patience is a genuine competitive advantage rather than institutional inertia: “We’ve never had more people in a gambling mood than now.”
The evidence is abundant. Retail options volumes at record highs. Meme stocks cycling in and out of speculative manias. Cryptocurrency valuations that defy discounted cash flow analysis. AI-adjacent companies trading at revenue multiples that price in decades of flawless execution. In this environment, a company with $397 billion in dry powder and the institutional culture to resist deployment pressure is not being passive—it is accumulating an option on the next dislocation.
Those dislocations come. They always do. In 2008, Berkshire deployed capital into Goldman Sachs and General Electric at terms available only to lenders of last resort. In 2020, Berkshire was slower to deploy than the historical record would suggest it should have been—a fact Buffett himself acknowledged—but the Japanese trading house accumulation that began in 2019 proved masterful timing in retrospect. The lesson is not that Berkshire is infallible. It is that a company with permanent capital, a fortress balance sheet, and the patience to wait for its pitch will consistently outperform over the full cycle, even if it lags in the middle innings of a bull market.
Berkshire’s Class B shares have underperformed the S&P 500 by 12.4% since Abel was named CEO—a datapoint that bears watching but almost certainly reflects the transition anxiety of a shareholder base recalibrating to a new face rather than any deterioration in the underlying business. For long-term investors, this is exactly the kind of sentiment-driven dislocation that Berkshire’s own investment framework would identify as an opportunity.
Conclusion: The Long Game Is the Only Game Berkshire Plays
Greg Abel is not Warren Buffett. He will never be Warren Buffett. And the sooner investors stop expecting him to be, the sooner they will be able to see what he actually is: a disciplined, operationally sophisticated, culturally literate steward of one of the greatest capital allocation machines ever assembled.
His first shareholder letter established the terms of engagement with clarity and humility. His first annual meeting—delivered without the safety net of Buffett’s presence on stage—demonstrated that he can hold the room, manage the Q&A, honor the legacy, and chart a forward course, all simultaneously. Warren Buffett himself, watching from the audience, told the crowd that Abel is “very, very smart about businesses” and expressed satisfaction with the timing and execution of the transition.
The fundamental premises of Berkshire’s model—permanent capital, decentralized operations, float-funded investing, cultural alignment, and an absolute refusal to deploy capital into subpar opportunities—remain intact under Abel’s stewardship. The $397 billion in cash is not a problem to be solved. It is a testament to sixty years of disciplined refusal to be rushed. In an investment landscape increasingly defined by the tyranny of the quarterly calendar, that refusal is rarer and more valuable than ever.
Patience, as Abel put it in Omaha, is one of Berkshire’s greatest strengths. The market will spend the next several quarters deciding whether to believe him. The long-term record suggests it probably should.
Key Takeaways at a Glance
- Berkshire’s Q1 2026 cash pile hit a record $397.4 billion, up from $373 billion at year-end 2025
- Operating earnings rose 18% year-over-year to $11.35 billion in Q1 2026
- Abel’s core message: patience in capital allocation is a strength, not a failure to act
- Abel explicitly confirmed Berkshire has identified good companies but won’t pay today’s elevated prices
- Insurance underwriting profit of $1.7 billion confirms the structural strength of the float model
- The first share buybacks since May 2024 ($234.2 million) signal Abel’s view on intrinsic value
- The culture of decentralization, anti-bureaucracy, and long-term holding is explicitly preserved
- Energy/utility infrastructure is positioned as Berkshire’s primary near-term AI-era growth vector
- Buffett publicly praised Abel as “very, very smart about businesses”
Frequently Asked Questions
Q: Who is Greg Abel and why is he running Berkshire Hathaway? Greg Abel, 63, is a Canadian-born executive who spent more than 25 years at Berkshire Hathaway, primarily as the head of Berkshire Hathaway Energy. He was publicly identified as Buffett’s successor in 2021 and became CEO on January 1, 2026, after Buffett announced his retirement at the 2025 annual meeting. Buffett remains chairman emeritus.
Q: Why is Berkshire Hathaway not deploying its $397 billion cash pile? Abel has stated clearly that Berkshire will not deploy capital into “subpar opportunities”—meaning companies whose current market prices do not offer the return profile Berkshire requires for long-term compounding. With equity markets trading at historically elevated valuations, the opportunity cost of patience is low while the risk of overpaying is high. Buffett separately noted that the current environment is “not ideal” for deploying Berkshire’s cash.
Q: How did Berkshire perform in Q1 2026 under Greg Abel? Berkshire reported operating earnings of $11.35 billion in Q1 2026, up nearly 18% from the prior year. Net income more than doubled to $10.1 billion. The insurance segment reported a $1.7 billion underwriting profit, up from $1.34 billion. The cash pile grew to a record $397.4 billion from $373 billion at year-end 2025.
Q: Is Greg Abel’s investment style different from Warren Buffett’s? Abel communicates in operational specifics rather than Buffett’s parables, but the underlying investment philosophy—patience, discipline, long holding periods, cultural alignment, refusal to overpay—is explicitly preserved. Abel has also signaled a more systematic approach to leadership, sharing the stage with subsidiary CEOs and building an institutional rather than personality-driven culture.
Q: What is Berkshire Hathaway’s approach to artificial intelligence under Greg Abel? Abel stated that Berkshire will not “do AI for the sake of AI.” The conglomerate’s most direct AI exposure comes through Berkshire Hathaway Energy, whose utility assets power data centers. Abel argued that hyperscalers must bear the full cost of the energy they consume, positioning Berkshire’s utilities as infrastructure beneficiaries of the AI buildout. He also flagged cybersecurity as a significant risk being actively managed, particularly within the insurance businesses.
Q: Should long-term investors hold Berkshire Hathaway stock under Greg Abel? This is a financial decision that depends on individual circumstances, and readers should consult a financial advisor. Analytically, Berkshire’s Class B shares have underperformed the S&P 500 by approximately 12.4% since Abel was named CEO—likely reflecting transition anxiety rather than fundamental deterioration. The underlying business continues to generate record operating earnings and a growing cash reserve, and Abel has demonstrated cultural continuity with the Buffett playbook. Investors with long time horizons who value capital preservation and disciplined compounding have hi
Discover more from The Economy
Subscribe to get the latest posts sent to your email.



Key Takeaways
- Rolex’s secondary market rose approximately 7.9% year-over-year as of 2026 (per WatchCharts data) — trailing Patek Philippe (+16.2%) and Tudor (+11.4%) but still outperforming Audemars Piguet (+3.4%).
- Rolex raised U.S. retail prices 4–9% in January 2026 (steel models ~5.6%, gold models ~8.7%), narrowing the historical gap between retail and pre-owned pricing.
- Not every model appreciates: steel sports references (Submariner, GMT-Master II, Daytona) have held value far better than two-tone or widely available dress references like the standard Datejust.
- The Lady-Datejust posted the sharpest 2026 gain among tracked collections — up 22.73%, from roughly $9,269 to $11,376 — driven by demand for smaller, “everyday luxury” watches.
- Gold’s rise past $2,400/oz has directly lifted the investment case for Rolex’s precious-metal references (Day-Date, Sky-Dweller, Yacht-Master).
The Model-by-Model Picture
| Category | 2026 Trend |
|---|---|
| Lady-Datejust | +22.73% (strongest performer among tracked collections) |
| Steel sports models (Submariner, GMT-Master II) | Held value well; corrected from 2022 peak but stabilized above retail |
| Daytona | Corrected from highs above $50,000 to the mid-$30,000s; still among the most sought-after references |
| Two-tone/widely available Datejust | Flat to negative — “holds value” is an overstatement for this category |
| Gold references (Day-Date, Sky-Dweller) | Lifted by gold’s rise above $2,400/oz |
Why the “Rolex Always Appreciates” Myth Is Fading
The pandemic-era boom pushed some references — the Daytona above all — to speculative highs disconnected from historical norms. Since the March 2022 peak, steel sports models have compressed meaningfully, and dealers who bought inventory near the top have in some cases faced 20–40% markdowns on liquidation. The lesson for 2026 buyers: Rolex as a category is not a monolith. Value retention depends heavily on specific reference, condition, and whether the piece comes with box and papers (“full set”).
What’s Actually Driving 2026 Strength
- Retail price increases raise the floor. When a new Submariner retails at $10,050 (up from $9,500), a pre-owned example at $11,000–$12,000 suddenly represents a smaller premium — narrowing the gap without secondary prices actually moving.
- Supply discipline remains Rolex’s core lever. The brand has never confirmed production numbers, and secondary-market premiums remain entirely a function of Rolex’s own manufacturing decisions — a risk factor as much as a support.
- Certified Pre-Owned rollout. Rolex’s now fully rolled-out CPO program has changed how buyers transact in the used market, adding a layer of brand-verified legitimacy that supports pricing.
The Case for Rolex as a Portfolio Diversifier
Financial advisors increasingly frame luxury watches not as a replacement for equities or bonds, but as a tangible, historically low-correlation diversifier — one that carries its own risks (illiquidity, condition-dependent pricing, no yield) but has demonstrated multi-decade resilience for specific references.
Is Rolex a good investment in 2026?
It depends heavily on the specific reference. Steel sports models like the Submariner and Daytona have held or grown in value; two-tone and widely available dress models generally have not. Overall, Rolex’s secondary market rose about 7.9% year-over-year in 2026, trailing Patek Philippe but ahead of Audemars Piguet.
Discover more from The Economy
Subscribe to get the latest posts sent to your email.

Navigating Mortgage and Loan Refinancing in a High-Yield Environment
Global public debt crossing critical thresholds has kept central bank policies volatile, resulting in fluctuating US Treasury yields throughout 2026. For homeowners and commercial property holders burdened by previous high-interest borrowing cycles, finding optimal refinance windows has become a high-stakes financial puzzle. Stalled disinflation and stubborn employment numbers mean rate cuts are incremental, requiring borrowers to act with precision.
Timing your mortgage or commercial loan refinance in this environment requires a deep understanding of yield curve movements and lender risk appetites.
Decoding 2026 Refinance Dynamics
The 10-Year Treasury Yield Benchmark
Mortgage rates continue to track closely with the 10-year US Treasury yield. When macroeconomic anxiety spikes debt issuance, yields rise, tightening consumer borrowing capacity. Savvy borrowers monitor weekly Treasury auctions to lock in rates during brief dip windows.
Hybrid ARMs and Alternative Structures
With fixed rates remaining elevated, 7/1 and 10/1 adjustable-rate mortgages (ARMs) have surged in popularity. These products offer lower initial monthly payments, giving borrowers breathing room until central bank easing cycles fully materialize.
| Loan Product | Current Rate Range | Best For | Key Risk Factor |
| 30-Year Fixed Mortgage | 6.2% – 6.8% | Long-term predictability | Higher initial monthly outlay |
| 7/1 Hybrid ARM | 5.5% – 5.9% | Short-term ownership / flipping | Rate reset risk after year 7 |
| Commercial Refinance | 7.0% – 8.2% | Corporate asset restructuring | Strict DSCR lender covenants |
Actionable Steps for Successful Refinancing
To maximize your chances of securing favorable refinance terms in a volatile market, follow a disciplined preparation strategy.
Boost Your Credit Score Immediately: Lenders in 2026 are applying stringent credit tiering; a 20-point increase can drop your APR by a crucial quarter-point.
Shop Regional Credit Unions: Smaller financial institutions often offer portfolio loans with more flexible underwriting than major national banks.
Calculate the Break-Even Point: Ensure your total closing costs are recouped through monthly savings within 24 months of closing.
“Market Strategist View: Refinancing in 2026 is an exercise in opportunistic timing. Borrowers must maintain immaculate financial profiles ready to strike the moment Treasury yields dip.”
Mastering the complexities of today’s debt environment ensures you can successfully lower your debt service costs and protect your long-term financial stability.
Discover more from The Economy
Subscribe to get the latest posts sent to your email.

The days of pulling generic auto insurance quotes based purely on your zip code and age are officially over. In 2026, insurance comparison engines are powered entirely by generative AI and real-time telematics. These platforms digest thousands of live data points—ranging from your driving smoothness via connected vehicle sensors to real-time traffic congestion patterns—to generate hyper-personalized premiums instantly.
For consumers, this evolution represents both a massive opportunity for savings and a hidden trap for penalty pricing. Understanding how AI algorithms evaluate risk is essential for anyone looking to lower their monthly auto insurance premiums.
How AI Comparison Engines Evaluate Your Risk Profile
Behavioral Telematics and Connected Cars
Modern cars stream performance data directly to insurance aggregators. Generative AI models analyze braking sharpness, acceleration curves, cornering G-forces, and phone distraction metrics. Drivers who maintain smooth, defensive habits are rewarded with dynamic rate cuts of up to 40% compared to traditional rating tiers.
Predictive Traffic and Weather Modeling
AI tools now cross-reference your daily commute route with predictive weather and accident probability models. If your standard parking location or driving corridor has a statistically higher incidence of uninsured motorist claims, your quotes will reflect that hyper-local risk assessment.
| Comparison Factor | Traditional Rating Model | 2026 Generative AI Model | Impact on Premium |
| Mileage & Usage | Annual estimated odometer reading | GPS tracking & live trip duration | High (up to 35% savings) |
| Driving Behavior | MVR driving record & accidents | Real-time braking, speed, & G-force | Critical (determines tier) |
| Vehicle Tech | Make, model, and safety rating | ADAS calibration & repair cost data | Moderate |
Strategies to Lower Your AI-Driven Insurance Quote
To outsmart the algorithm and secure the lowest possible premium in 2026, drivers must proactively manage their digital footprint on insurance platforms.
Opt-In for Telematics Trial Periods: Many insurers offer immediate 15% discounts just for installing their driving app; let it track safe habits for 30 days to lock in permanent savings.
Scrub Unverified Public Records: Ensure your motor vehicle report is free of clerical errors that AI risk models misinterpret as reckless behavior.
Compare AI Aggregators: Use platforms that integrate multi-carrier API feeds rather than single-brand comparison sites to find the best risk-adjusted rate.
“Industry Note: AI-driven pricing rewards transparency and precision. Drivers who actively manage their telematics data consistently out-save those relying on legacy quote calculators.”
Embracing AI comparison tools allows savvy policyholders to customize coverage limits precisely to their driving habits, eliminating wasted premium spend while ensuring robust protection.
Discover more from The Economy
Subscribe to get the latest posts sent to your email.

Money News: How to Protect Your Portfolio From Global Inflation

World Bank Projections: Emerging vs. Big Economies of Asia

IMF Reports 2026: What the Latest Data Means for the Global Economy

Singapore Stocks Outlook: A Safe Haven in the Asian Market?

China Stocks vs. Japan Stocks: Where Should You Invest in Late 2026?

VIX Index Explained: How to Trade Wall Street’s Fear Gauge Today

Commercial vs Residential Real Estate: Which Wins in 2026?

Presidential Stock Market Performance: How Trump’s Second Term Compares to History

2026 Real Estate Market News: Are We Heading for a Correction?

Bitcoin Price Forecast 2026–2027: Will the 4-Year Cycle Hold?

Fidelity Crypto vs. Traditional Brokerages: A Guide for Modern Investors

The 2026 Global Smartphone Market: AI Integration and Competitor Analysis

SpaceX IPO: How Aerospace Is Reshaping Tech Startup News

Fidelity Investments Review: Maximizing Returns in a Volatile Stock Market

US-China Relations in Q3 2026: Trade Tariffs and Supply Chain Risks

Top 30 Stocks for Investment in PSX for Massive ROI in 2026

SpaceX Starship Flight 14: First Orbital Attempt & Starlink V3 Launch Explained

The 2026 Crypto Regulatory Shift: What It Means for Institutional Investors

AI Chip Stocks 2026: The Best Semiconductor Investments Beyond Marvell

Tween Back-to-School Trends 2026: What’s Driving the $85B Season

AI-Powered Training: The Next Multi-Billion Dollar Ecosystem in Fitness

Oil Prices Break $100 in 2026: Middle East Conflict & Energy Markets

10-Year Treasury Yield Hits 4.80%: What It Means for Rates & Portfolios

Fidelity Investments Review 2026: SPAXX Yields & Zero-Fee Funds

BRICS+ Cross-Border Payments 2026: Interoperability Explained

Shein Clothes Quality & Safety in 2026: What Lab Tests Show

MRVL Earnings 2026: Why Marvell Sank Despite Beating Estimates

China’s US$10.8 Billion Trade Shortcut: Why the Pinglu Canal Matters
-

 Markets & Finance9 months ago
Top 15 Stocks for Investment in 2026 in PSX: Your Complete Guide to Pakistan’s Best Investment Opportunities
-

 Analysis7 months ago
Johor’s Investment Boom: The Hidden Costs Behind Malaysia’s Most Ambitious Economic Surge
-

 Analysis7 months ago
Top 10 Stocks for Investment in PSX for Quick Returns in 2026
-

 Analysis8 months ago
Brazil’s Rare Earth Race: US, EU, and China Compete for Critical Minerals as Tensions Rise
-

 Banks8 months ago
Best Investments in Pakistan 2026: Top 10 Low-Price Shares and Long-Term Picks for the PSX
-

 Investment8 months ago
Top 10 Mutual Fund Managers in Pakistan for Investment in 2026: A Comprehensive Guide for Optimal Returns
-

 Global Economy9 months ago
15 Most Lucrative Sectors for Investment in Pakistan: A 2025 Data-Driven Analysis
-

 Global Economy9 months ago
Pakistan’s Export Goldmine: 10 Game-Changing Markets Where Pakistani Businesses Are Winning Big in 2025