
Markets & Finance
Gold Price Forecast 2026: Fed’s July 29 Decision and Record Central Bank Buying Explained

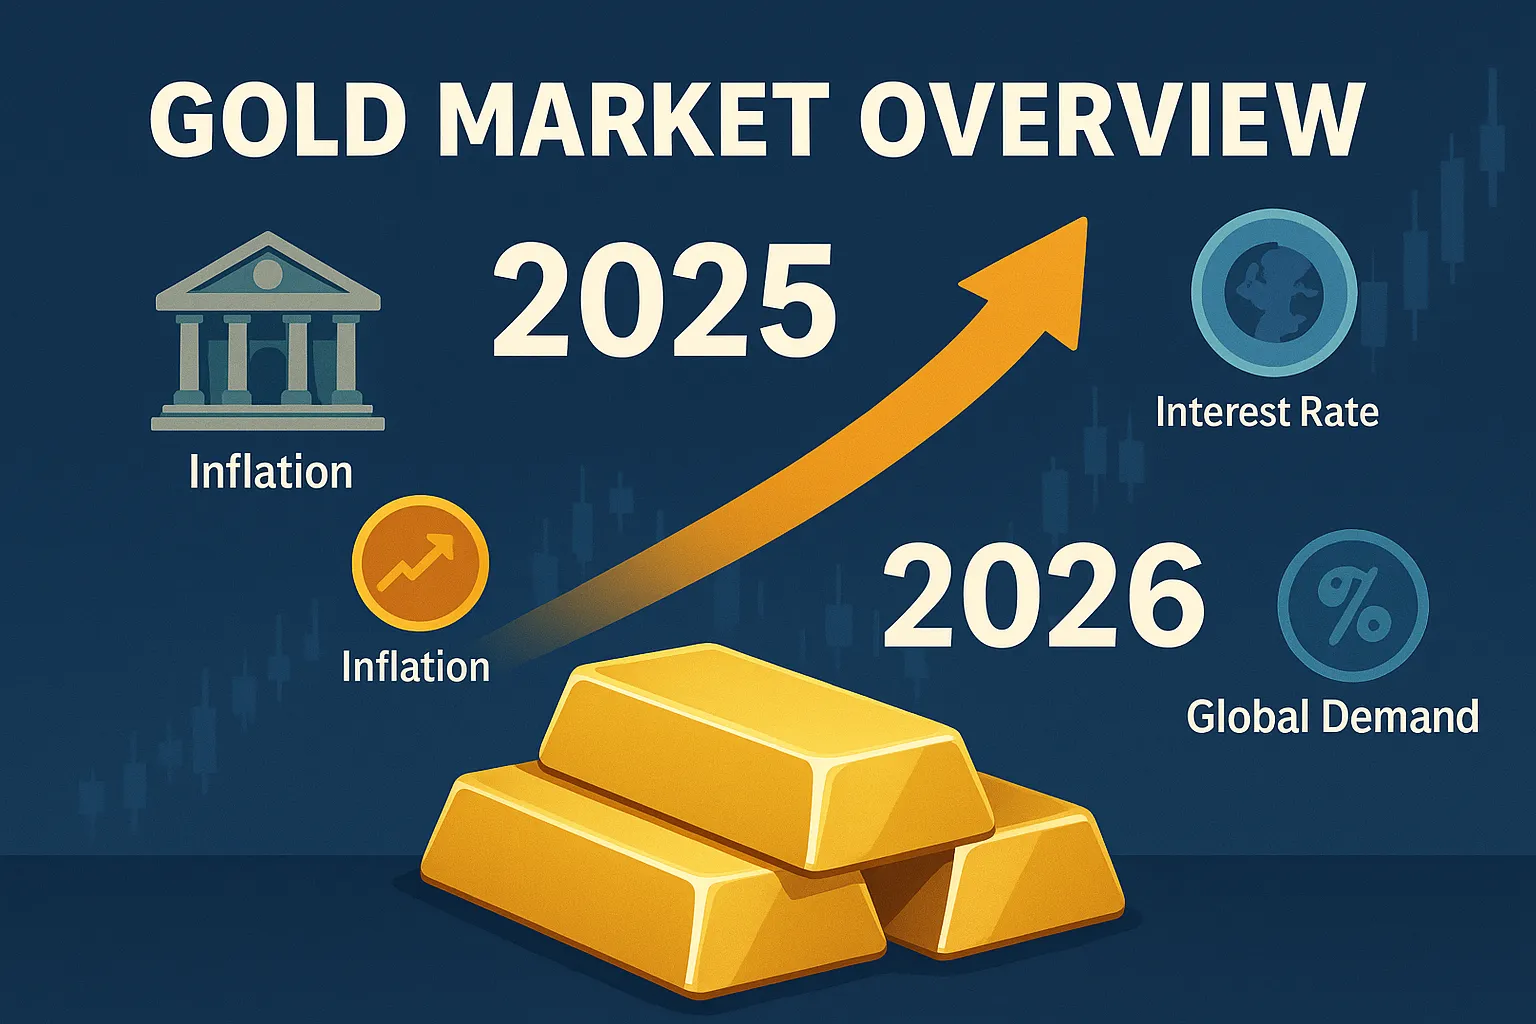
Gold has spent the past month trading in a tight band near $4,060 an ounce, but the precious metal’s next major move hinges on a single date circled on every trading desk’s calendar: July 29, 2026, when the Federal Reserve’s rate-setting committee delivers its next decision under new Chair Kevin Warsh.
Gold’s Volatile 2026: From Record Highs to a Sharp Correction
Gold opened 2026 near $4,327 an ounce before rocketing to an all-time intraday high of $5,598.39 on January 29, driven by a weaker dollar, central bank accumulation, and geopolitical risk premiums, with global gold ETFs pulling in $6.6 billion of net inflows in the first quarter alone, according to Capital.com. The metal then corrected sharply, falling to an intraday low of $3,959.33 on June 24 — its weakest level since November 2025 — as markets repriced Fed policy from rate cuts toward possible hikes.
By late June, gold had partially recovered to close near $4,062, still roughly 24.5% higher year-on-year despite being down about 6.1% year-to-date, per the same Capital.com analysis. The World Gold Council’s mid-year outlook pegs gold’s fair-value range around $4,100, plus or minus 5%, absent a major shift in macro conditions, as reported by Allegiance Gold.
The Fed’s Hawkish Pivot Under Kevin Warsh
The Federal Reserve has now held its benchmark rate at 3.50%–3.75% through multiple consecutive meetings, most recently reaffirming the hold at the June 16–17 gathering, Chair Warsh’s first as head of the central bank, according to GoldSilver. Markets had priced a 97% probability of that hold via the CME FedWatch tool. Warsh has been characterized as a price-stability hawk who has so far declined to offer forward guidance on the Fed’s rate path, unsettling markets that had grown accustomed to clearer signaling from his predecessors.
Why Central Banks Keep Buying Gold Regardless of Price
Perhaps the most consequential trend in the gold market has nothing to do with short-term Fed signaling. The People’s Bank of China added 14.93 tonnes of gold to its reserves in June 2026 alone — its largest single-month purchase since October 2023 — extending a buying streak to twenty consecutive months, according to GoldSilver’s reporting. Globally, central banks purchased an estimated 244 tonnes of gold in the first quarter of 2026 alone, exceeding both the prior quarter and their five-year average, per the World Gold Council data cited by Investing News Network. Crucially, that pace held steady even through a roughly 25% price correction from January’s peak, suggesting sovereign buyers are making multi-decade reserve allocation decisions rather than reacting to near-term price swings — a trend closely tied to broader de-dollarization efforts among BRICS-aligned economies including China and Russia.
What the July 29 Decision Means for Investors Worldwide
For gold and silver investors from Dubai to Singapore to Karachi, the July 29 Fed meeting is the next major catalyst. A dovish shift in the Fed’s dot plot toward a December rate cut would likely support gold prices, while confirmation of one more hike by year-end would strengthen the dollar and pressure bullion lower in the near term. Either way, the structural buyer — central banks diversifying reserves away from dollar-denominated assets — appears unlikely to step back regardless of the outcome.
Discover more from The Economy
Subscribe to get the latest posts sent to your email.



The diplomatic dispute between the United States and Iran has direct consequences for energy markets, commercial shipping and household costs around the world. A proposal to reopen the Strait of Hormuz could reduce pressure if implemented, but an offer is not the same as an agreement, and an agreement is not the same as vessels returning safely to normal routes.
On October 18, Reuters reported Iran’s reiteration of a conditional proposal for reopening the waterway and continuing negotiations. The report described unresolved differences between the parties. Readers should treat the proposed timeline as a diplomatic claim contingent on acceptance and implementation, not an accomplished reopening.
Why Hormuz matters
The Strait of Hormuz links the Persian Gulf with wider maritime trade routes. Disruption can affect flows of crude oil, refined products and other cargo, while insurance and freight costs can rise even for shipments that are still moving. The economic impact depends on the duration of disruption, the ability of producers to reroute exports and the availability of substitute supplies.
One of the most common mistakes in energy reporting is to assume that every barrel of oil diverted or released immediately replaces the same amount of diesel, gasoline or jet fuel. Refining configuration, product inventories and transport capacity affect what consumers can actually buy.
Diplomatic offers contain conditions
A reopening proposal needs examination of who controls access, what sanctions might change, how hostilities would pause and what verification arrangements exist. According to Reuters, Iran’s October proposal was tied to a list of conditions and the United States had not accepted them in full. That explains why a headline about talks should not be framed as a completed peace agreement.
The nuclear issue introduces another dimension. Differences over uranium enrichment and security assurances affect trust and sequencing. Analysts should distinguish confirmed public statements from unattributed negotiating leaks and describe any remaining uncertainties.
Oil prices transmit the conflict globally
Higher oil prices alter transport costs, manufacturing costs and inflation expectations. Reuters coverage of Gulf markets illustrates how markets can react differently to the same regional tensions: some exporters may benefit from elevated prices while importers and financial markets face stronger pressures.
For airlines, higher jet fuel prices can feed into fares with a lag. For farms and supermarkets, diesel and fertilizer expenses can affect the food supply chain. For governments, imported energy may widen trade deficits and complicate efforts to reduce inflation.
Why a ceasefire would not end every economic problem
Even a verified de-escalation would leave practical questions about ship insurance, port operations, damaged infrastructure and commercial confidence. Companies may require weeks or months to restore normal schedules and rebuild inventory. Markets can anticipate a diplomatic breakthrough faster than logistics systems can deliver one.
The IMF’s October outlook identifies conflict escalation and energy effects among global downside risks. Those risks have especially uneven effects across countries.
Three scenarios to watch
In a negotiated reopening, shipping traffic and risk premiums could gradually ease, subject to verification. In a prolonged stalemate, supply chains may continue operating under elevated costs and uncertainty. In an escalation, disruptions could spread or intensify, adding inflationary pressure and financial volatility. None is guaranteed; each depends on military and diplomatic decisions that can change rapidly.
Readers should follow official government statements, shipping data and independently reported market developments. Avoid live-timing claims based on rumors and separate scheduled negotiations from signed agreements.
How to assess the actual shipping recovery
One useful sign of reopening would be sustained increases in verified commercial transits, not merely a single vessel passage. Analysts would also watch marine-insurance premiums, freight rates, tanker queues, port congestion and the ability of importers to receive cargo on time. Some vessels may need new clearances or voyage plans. Others may remain unwilling to transit despite a diplomatic announcement. Price movements can anticipate these changes, but forecasts of normal shipping should be tested against operational data. A reopening is most meaningful when it is safe, repeatable and commercially viable—not just diplomatically declared.
Frequently asked questions
Has the Strait of Hormuz fully reopened?
The cited October 18 report described a conditional proposal and unresolved negotiations, not a verified full reopening.
Why does the conflict affect food prices?
Fuel, freight and fertilizer costs move through production and distribution chains, potentially raising consumer prices later.
Can energy prices fall quickly after a deal?
Market prices may respond rapidly, but physical supply and retail prices can adjust more slowly.
Discover more from The Economy
Subscribe to get the latest posts sent to your email.

Singapore’s Straits Times Index entered October with a notable recent milestone and a familiar investment question: how far can a market advance when banks are doing much of the heavy lifting? Performance needs to be read alongside valuation, dividends, earnings and the global interest-rate environment.
Singapore Exchange reported that the STI reached a record 5,828.5 on September 4 before ending September at 5,675.88, down 1.4% for the month. The exchange also reported unusually strong inflows into STI exchange-traded funds. Those figures describe September, not a guaranteed October trend.
What a record high does and does not mean
An index high can signal investor confidence, but it does not make future returns inevitable. Much depends on how much of the index is concentrated in a few large firms and how much investors already expect their profits to grow. A broad-based rally generally has a different risk profile from an advance led by a small number of stocks.
Singapore’s market is often associated with bank dividends, real estate investment trusts, transport and telecoms. Each has its own sensitivity to credit demand, funding costs and the regional economy. Investors should check index weights before assuming the STI represents every listed business evenly.
Banks remain essential to the story
The Securities Investors Association (Singapore) noted the important role played by banks during September, when high US yields, oil prices and geopolitical risks affected investors. Banks can benefit from some rate environments through interest margins but may also face weaker loan demand, funding competition and credit losses.
The right banking questions are not simply whether rates are higher or lower. Look at deposit pricing, loan growth, nonperforming loans, fee income and capital distributions. A generous dividend yield only creates value if earnings and balance-sheet resilience support the payout.
REITs face a different set of trade-offs
Singapore-listed REITs attract investors seeking income, but property sectors differ greatly. An industrial warehouse, office tower and data center face distinct tenant, refinancing and supply conditions. Falling rates can ease financing costs, yet weak rental demand or high capital expenditures can still hurt distributable income.
Compare each trust’s debt maturity schedule, fixed-rate debt share, asset occupancy and lease expiry profile. Avoid choosing a REIT only because its yield exceeds a government bond yield: the difference compensates for business, property and liquidity risks.
ETF flows offer context, not a forecast
The SGX update reported combined STI ETF assets above S$6 billion by September. Growing assets can improve investor access and liquidity, but flows can reverse and do not establish that an index is undervalued. A disciplined investor distinguishes between the ease of buying an exposure and whether the exposure is attractively priced.
Expenses, tracking difference, distribution treatment and currency matter when comparing ETFs. Domestic investors and overseas investors may also face different tax and foreign-exchange consequences.
Four checks before taking a view
First, compare the index’s forward earnings expectations with historical ranges, using consistent methodology. Second, monitor major banks’ loan quality and capital returns. Third, follow property refinancing costs and occupancy. Fourth, consider whether Asia’s chip cycle, oil prices and global bond yields change the regional growth outlook.
Singapore stocks may remain an important income and diversification allocation, but that is a portfolio decision, not a promise of gains. Readers should treat an index forecast as a scenario and insist on knowing the assumptions behind it.
Dividend returns need a total-return calculation
An investor comparing the STI with growth-oriented foreign indices should calculate total return where reliable data are available, not only price appreciation. Cash dividends can be a substantial part of the investment case for income-heavy markets. However, dividends are not free money: a company pays them from funds that otherwise could have been retained for investment or debt reduction, and share prices can adjust around ex-dividend dates. Overseas readers must also consider currency conversions and the rules of their home jurisdiction. The same headline index gain can produce a meaningfully different after-cost return for a Singapore-dollar investor and an investor whose expenses are denominated in US dollars or Pakistani rupees.
Frequently asked questions
Did the STI reach a record in September 2026?
Yes. SGX reported a September 4 high of 5,828.5, followed by month-end consolidation.
Are Singapore bank stocks safe because they pay dividends?
No investment is risk-free. Dividends depend on profits, capital strength and board decisions.
What should foreign investors track?
Index concentration, fees, dividends, tax treatment and the exchange rate of their home currency against the Singapore dollar.
Discover more from The Economy
Subscribe to get the latest posts sent to your email.
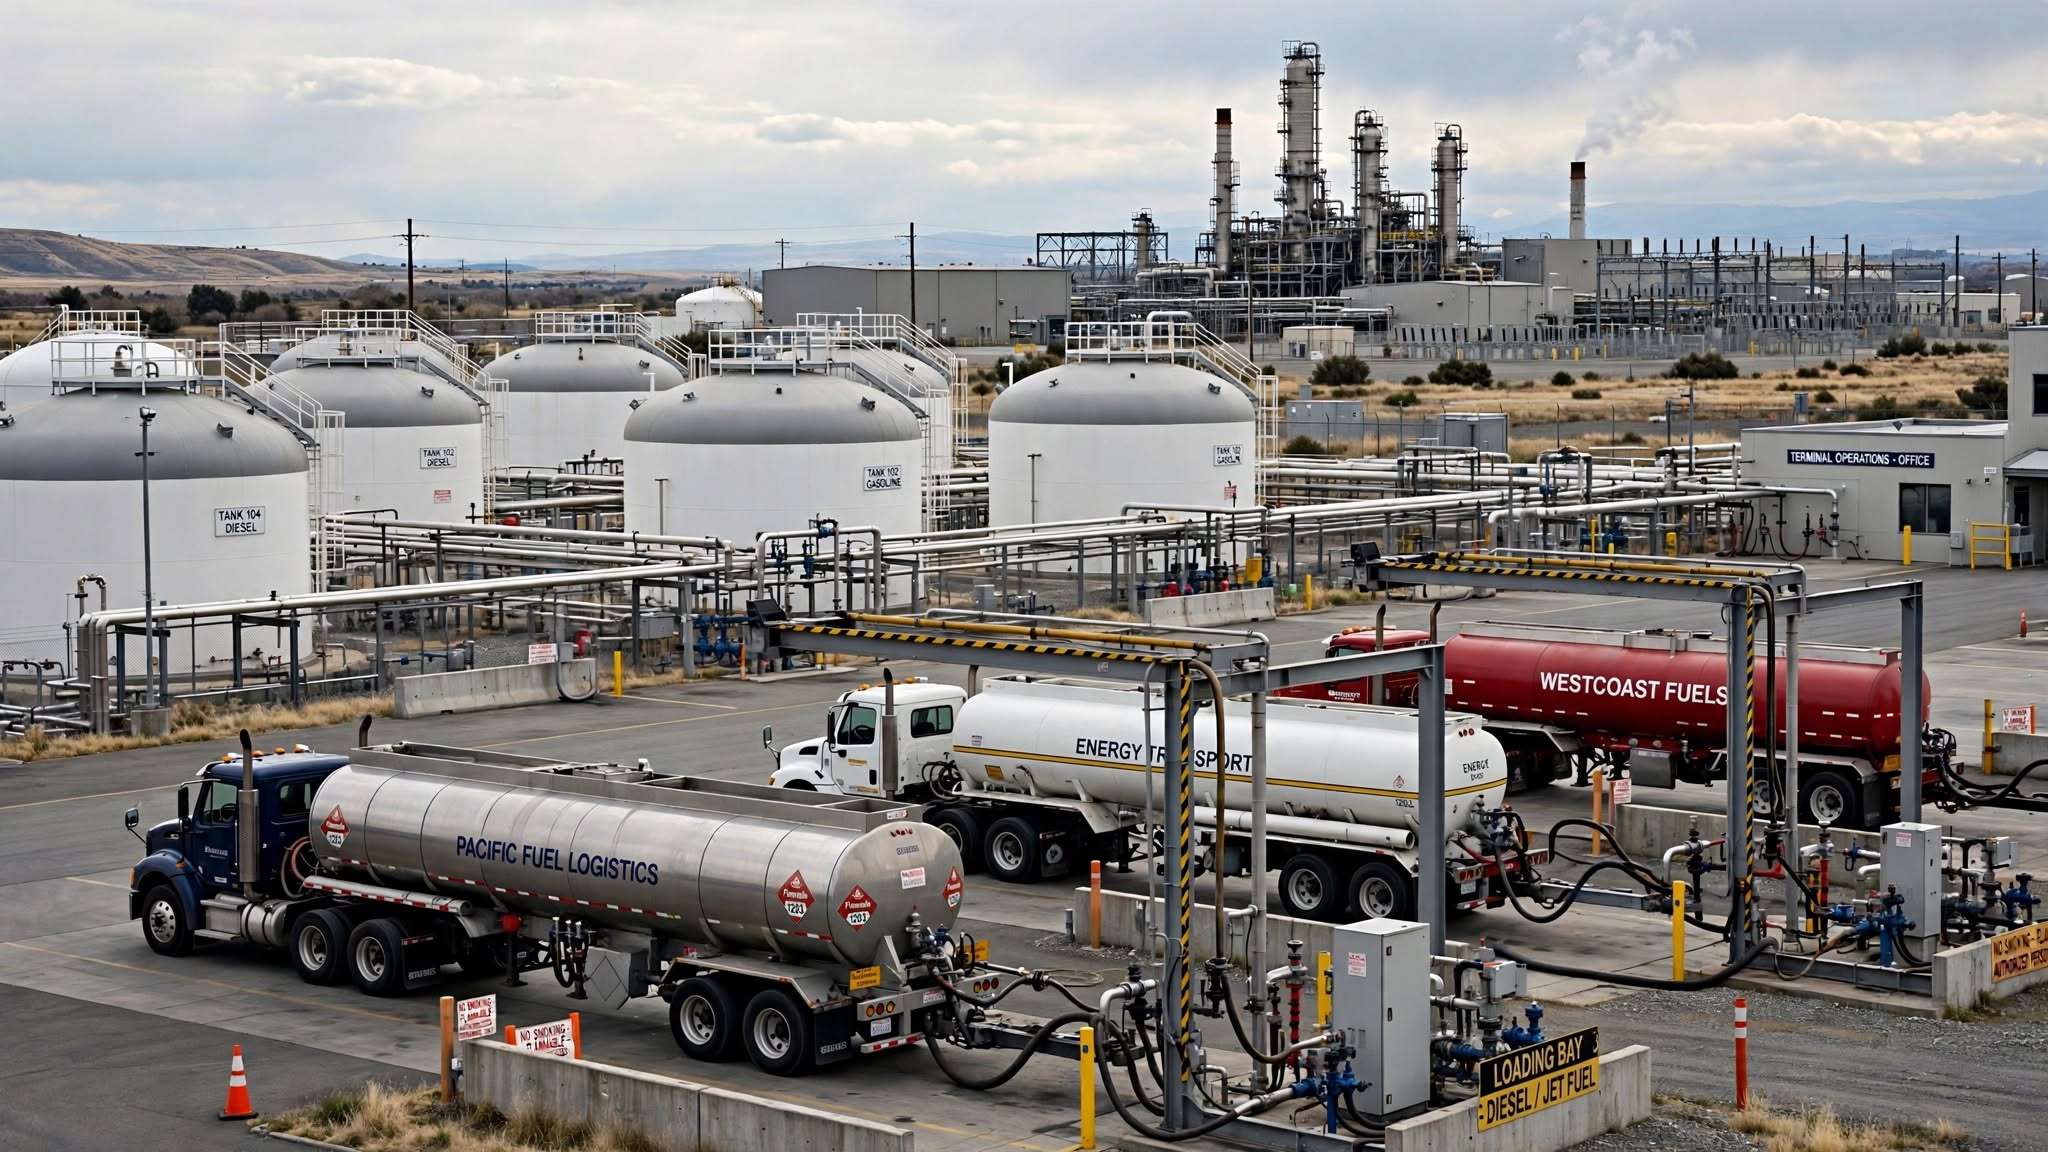
Crude prices and diesel prices follow related but different supply chains. Refinery capacity, transport and product inventories help explain the gap. Original research October 12; updated October 15, 2026. Verify newer developments before publication.
Reuters reported on October 15 that ongoing conflict and maritime disruptions continue to influence oil and energy prices. Avoid equating a crude price change with an identical movement in retail diesel prices. Source. Historical material further below is contextual and must not be mistaken for a live quotation or price.
What changed since the original research cutoff
Reuters reported on October 15 that ongoing conflict and maritime disruptions continue to influence oil and energy prices. Avoid equating a crude price change with an identical movement in retail diesel prices. The publication date and observation time are crucial: market prices, competition results and government announcements cannot be extrapolated from an earlier snapshot. A more useful reader question is what remains current today and what requires verification at the moment of a financial or travel decision. The new development should be checked against the primary or contemporary reference rather than assumed from an older headline.
What is happening and why readers are searching
Energy prices are back near the center of the inflation debate in October 2026. Associated Press reporting on October 12 described elevated crude prices and market reactions to proposed Russian diesel purchases against the backdrop of international tensions. The existence of political announcements does not establish that contracted volumes have already arrived or reduced retail pump prices. Sources: Associated Press energy coverage and International Monetary Fund.
The important context competitors can overlook
Crude oil and diesel are related but different markets. Refineries need the right feedstock, sufficient capacity, suitable shipping routes and compliance with regulations. A region can have adequate crude yet experience tight middle-distillate supply because of refinery disruptions, inventory shortages or freight bottlenecks. Trucking, agriculture and industrial logistics transmit fuel costs into goods prices with different time lags. For primary-source checks and current reporting, see Associated Press energy coverage and World Trade Organization. The key distinction is separate crude headlines from finished fuel supply.
A practical way to use this information
Follow refinery output, diesel inventories, freight costs and wholesale spreads alongside Brent and WTI. For consumers, compare a weekly average fuel price with the prior month rather than inferring national inflation from one service station. For businesses, test whether fuel surcharges are formula-based or discretionary. The honest answer to “will diesel get cheaper?” depends on both delivered product supply and demand.
Why lower crude does not always mean cheaper diesel
| Link in the chain | Potential bottleneck | What to watch |
|---|---|---|
| Crude extraction | Disruption or policy limits | Delivered crude availability |
| Transportation | Tanker capacity and insurance | Freight and route costs |
| Refining | Unit outages and product mix | Diesel output and margins |
| Distribution | Storage, taxes and local supply | Wholesale-to-retail lag |
A political agreement may improve expectations before physical shipments change inventories. This is why fuel inflation coverage should distinguish a possible future supply release from barrels or diesel cargoes actually received.
What to verify before making a decision
The right next step is to identify the source, timestamp and applicable market or jurisdiction. Check whether a number is a historical observation, official announcement, target, forecast or scenario. If you intend to act financially, legally or commercially, use the relevant provider’s current terms and obtain professional advice where appropriate. The sources cited here establish context; they are not a substitute for live prices, individual eligibility checks or binding agreements.
Reader questions
Is diesel price the same as oil price? No. Refining capacity, product inventories, shipping and local taxes create substantial differences.
Do policy announcements lower pump prices immediately? Not necessarily; delivery timing and wholesale markets determine pass-through.
Crude oil and diesel are connected—but not the same commodity
Crude oil is a refinery input, while diesel is one of several refined fuels that emerge from processing it. A change in the crude benchmark affects refiners’ input costs, but the price of diesel also depends on local refinery capacity, maintenance, fuel specifications, product inventories and transport availability. A refinery can have access to crude and still be unable to produce enough diesel for its market. Conversely, a region with healthy diesel inventories may see pump prices respond more slowly to an international crude rally. This is why headlines about a political agreement to increase crude supply should not automatically promise immediate relief to truck drivers.
The difference between the selling price of a refined product and its crude input cost is often discussed through a refining margin or crack spread. These spreads fluctuate as product demand and refinery utilization change. They can rise sharply when product supply is constrained even if crude prices soften. For readers, a graph of Brent oil alone cannot explain every regional diesel price move. Look for product-level benchmarks and inventory data alongside the crude quotation.
How a fuel shock enters broader inflation
Fuel costs affect more than motorists. Trucks carry food, building materials and consumer goods; farm machinery uses diesel; ships and industrial users depend on related refined energy products. Higher transport costs can flow into freight contracts and eventually shelf prices, but the timing depends on contract terms, profit margins and competition. Airlines typically face jet-fuel costs rather than road-diesel costs, so a service article should not present every transport sector as using the same product. Households also respond differently depending on commuting needs and heating arrangements.
An energy shock can affect headline inflation quickly through direct fuel prices, while broader price pressure may take longer. Central banks often distinguish volatile energy components from measures intended to capture underlying inflation, but persistent energy increases can influence expectations and wage negotiations. Reporting should describe the channels without claiming a specific change in CPI before the statistics agency releases its measured result.
Four scenarios for October’s energy market
First, an announced supply deal may be implemented and deliver usable fuel after shipping, payment and compliance arrangements are complete. Second, the deal may be delayed or revised, leaving near-term product shortages unresolved. Third, refinery disruptions or shipping bottlenecks may offset additional crude availability. Fourth, weakening economic demand could reduce consumption even while geopolitical risks remain elevated. In each case, the direction of the crude price, diesel price and pump price may differ. A scenario is a tool for reasoning, not an assertion that an event has occurred.
The distinction is especially important when headlines mention a government statement or preliminary agreement. A political declaration is not physical delivery; a cargo nomination is not necessarily a completed arrival; and the arrival of crude is not itself the production of road-ready diesel. For verification, identify the party making the statement, the product and volume involved, the destination, the delivery window and any relevant sanctions or trade restrictions.
What businesses can do about fuel exposure
A delivery company can examine route optimization, fleet efficiency and whether fuel surcharges fairly reflect current costs. A manufacturer can review freight contracts, supplier concentration and inventory policies. A small retailer should calculate how much of total expense is actually fuel-sensitive before raising prices across the board. Households may compare total travel costs, not just the pump-price sign. All these responses have tradeoffs: extra inventory ties up cash, and hedging instruments can create their own financial risks.
For investors, energy producers, refiners and transport companies can react very differently to the same headline. An oil producer may benefit from higher crude prices while an airline faces higher fuel costs. A refiner’s profitability can depend more on product margins than on crude’s absolute level. Sector labels should never substitute for analyzing actual business exposure.
A practical fuel-price monitoring dashboard
Compare Brent and WTI crude with regional diesel benchmarks, refinery utilization, relevant inventories, transport constraints and local tax structures. Date each observation and note whether figures are daily prices, weekly averages or monthly reports. The U.S. Energy Information Administration is a useful primary source for U.S. energy data. Official inflation releases help distinguish the impact on consumer prices from speculative claims about a future inflation wave.
A good oil-and-diesel article protects readers from two oversimplifications: that every supply announcement immediately changes retail prices, and that every increase in crude produces an identical change in diesel. The market has multiple stages, each with its own constraints and lags.
Discover more from The Economy
Subscribe to get the latest posts sent to your email.

Why Pakistan’s Inflation Is Still Near 10% Despite Economic Stabilisation

Holiday Airfare 2026: Why Flights Cost More & Fares

California Prop 40 Explained: The 2026 Billionaire Wealth Tax Ballot Measure

US–Iran Conflict in October 2026: Hormuz, Oil Prices and Diplomacy

AIIB in 2026: Can Green Infrastructure Deliver Measurable Growth?

IMF and World Bank Outlook 2026: Growth, Debt and the Missing Investment

Singapore Stocks 2026: STI Outlook After a Record High

Asian Markets in October 2026: What the AI Sell-Off Means for Investors

Supermarket News 2026: Why Grocery Prices Could Rise Again

Wind Farm Economics in 2026: What Determines Whether a Project Pays?

Boomers vs Young Adults: Why the Net Worth Gap Is More Complicated Than It Looks

Is the AI Bubble Bursting in 2026? Five Tests Investors Should Watch

Germany–France ‘Made in Europe’ Deal Could Reshape China’s EV Ambitions

Treasury Yields and Inflation 2026: What Bond Moves Mean for Borrowers

World’s Largest Economies: Ranking the Top Global Powers

Crude Oil & Petroleum Market Analysis: OPEC+ Decisions and Price Forecasts

Pakistan Economy 2026: Inside the SBP’s Balancing Act

Bitcoin Price Forecast 2026–2027: Will the 4-Year Cycle Hold?

Asian Stock Markets 2026: Japan, China, Pakistan & More

Silver Price Today: Why the Xi-Trump AI Standoff Is Fueling a Safe-Haven Rally

SpaceX IPO 2026: History’s Biggest Stock Debut?

SpaceX IPO: How Aerospace Is Reshaping Tech Startup News

Oil Prices 2026: Inside the Hormuz Crisis That Won’t End

Algorithmic Dogfights: Why the U.S. and China Must Establish Rules of Engagement for Autonomous Air Power

IMF Reports 2026: What the Latest Data Means for the Global Economy

Top US Convenience Store Chains: Store Counts, EV Charging, and Sales Trends

Business Insurance: What Coverage You Actually Need and What It Costs in 2026

Corporate America Faces a New Debt Test as US Borrowing Costs Surge
-

 Markets & Finance10 months ago
Top 15 Stocks for Investment in 2026 in PSX: Your Complete Guide to Pakistan’s Best Investment Opportunities
-

 Analysis8 months ago
Johor’s Investment Boom: The Hidden Costs Behind Malaysia’s Most Ambitious Economic Surge
-

 Analysis8 months ago
Top 10 Stocks for Investment in PSX for Quick Returns in 2026
-

 Banks9 months ago
Best Investments in Pakistan 2026: Top 10 Low-Price Shares and Long-Term Picks for the PSX
-

 Analysis8 months ago
Brazil’s Rare Earth Race: US, EU, and China Compete for Critical Minerals as Tensions Rise
-

 Investment9 months ago
Top 10 Mutual Fund Managers in Pakistan for Investment in 2026: A Comprehensive Guide for Optimal Returns
-

 Global Economy10 months ago
15 Most Lucrative Sectors for Investment in Pakistan: A 2025 Data-Driven Analysis
-

 Global Economy10 months ago
Pakistan’s Export Goldmine: 10 Game-Changing Markets Where Pakistani Businesses Are Winning Big in 2025