
Payment Channels
Fast Invoice Factoring: How to Turn Unpaid Invoices Into Cash Within 24 Hours


A business sitting on $100,000 of unpaid invoices with 60-day payment terms isn’t actually short on revenue — it’s short on timing, and fast invoice factoring exists specifically to close that gap without taking on debt.
Unlike a traditional business loan, invoice factoring isn’t borrowing at all: it’s selling your unpaid invoices to a factoring company at a discount in exchange for immediate cash, often within 24 to 48 hours. For businesses with long customer payment cycles — staffing agencies, trucking companies, manufacturers, government contractors — this speed can be the difference between making payroll and missing it.
This guide covers exactly how fast invoice factoring works, what it actually costs once every fee is accounted for, and how to evaluate a factoring company before signing an agreement.
How Fast Invoice Factoring Works
The mechanics are straightforward, but the details in the agreement determine whether it’s a smart short-term financing tool or an expensive drag on margins.
Key takeaway: Factoring companies typically advance 70% to 90% of an invoice’s value immediately, then release the remaining balance — minus fees — once your customer pays in full. The “fast” part of fast invoice factoring refers to that initial advance, not the full resolution of the transaction.
Step-by-Step: How the Transaction Proceeds
- You deliver goods or services and issue an invoice to a creditworthy business customer.
- You sell the invoice to a factoring company, which evaluates your customer’s creditworthiness — not primarily yours — since they’re the ones ultimately responsible for payment.
- The factoring company advances a percentage of the invoice value, commonly 70% to 90%, often within 24 to 48 hours of approval.
- The factoring company collects payment directly from your customer according to the invoice’s original terms.
- You receive the remaining balance, minus fees, once your customer pays in full.
Recourse vs. Non-Recourse Factoring
Recourse factoring is generally cheaper but leaves repayment risk with your business if your customer never pays; non-recourse factoring costs more but shifts that default risk to the factoring company. Most small business factoring arrangements are recourse, making customer creditworthiness screening a critical part of choosing which invoices to factor.
Financial and Strategic Implications: What Fast Factoring Actually Costs
The advertised “factor rate” rarely tells the whole story. Total cost depends on the base fee, how long the invoice remains unpaid, and any additional charges layered on top.
| Cost Component | Typical Range | Notes |
|---|---|---|
| Base factoring fee | 1%–5% of invoice value per 30 days | The longer your customer takes to pay, the more this compounds |
| Advance rate | 70%–90% of invoice value upfront | Higher-risk industries or customers may see lower advance rates |
| Origination/setup fee | $150–$500, sometimes up to 1% of the advance | One-time cost with some providers |
| Monthly minimum fee | Varies by provider | Applies if factored volume falls below a contractual threshold |
| Wire/ACH transfer fee | Typically small, flat fee | Charged per advance in some agreements |
Expert insight: Some fast factoring providers structure fees on 30-day payment terms but charge additional increments for every extra 10–15 days the invoice remains outstanding — meaning a slow-paying customer can quietly turn a 2% fee into an effective 6% or more over 90 days. Always ask for the total cost at 30, 60, and 90 days before signing.
Why Speed Comes at a Premium
Fast invoice factoring providers that promise same-day or next-day funding typically charge toward the higher end of the fee range in exchange for expedited underwriting and same-day wire transfers. Businesses with predictable, high-volume invoicing can often negotiate meaningfully better rates than the advertised “starting at” figures by committing to a longer-term contract or higher monthly volume.
Industry Adoption Remains Relatively Niche — By Design
Invoice factoring isn’t the default financing choice for most small businesses, and that’s informative in itself: according to the 2023 Small Business Credit Survey, only about 2% of employer-based businesses used factoring on a regular basis. It tends to concentrate in industries with structurally long payment cycles — trucking, staffing, government contracting, and manufacturing — rather than serving as general-purpose working capital for every small business.
How to Choose the Right Fast Invoice Factoring Company
- Confirm the true total cost, not just the headline factor rate — request a full fee schedule including origination, monthly minimums, and long-payment-term increments.
- Ask whether the arrangement is recourse or non-recourse, and understand what happens if a factored customer fails to pay.
- Check for contract length and volume commitments — some providers require minimum monthly factoring volume or long-term contracts with early termination fees.
- Evaluate customer-facing collection practices — since the factoring company will contact your customers directly, an aggressive or unprofessional collections approach can damage your client relationships.
- Compare industry specialization — providers focused on your specific industry (trucking, staffing, manufacturing) often better understand typical payment cycles and price accordingly.
- Confirm actual funding speed with references, not just marketing claims, since “fast” funding timelines vary meaningfully between providers.
Key takeaway: The real cost comparison isn’t factoring versus a bank loan in the abstract — it’s the factoring fee versus the actual cost of the cash-flow gap it closes, whether that’s a missed early-payment discount from your own suppliers, a payroll shortfall, or a lost growth opportunity.
Future Outlook: Invoice Factoring Trends Through 2027
- Software-integrated factoring is expanding rapidly. More providers now sync directly with accounting platforms like QuickBooks, letting businesses select and factor individual invoices without manual paperwork, meaningfully compressing approval timelines.
- Rate compression continues among direct lenders. As more specialized, technology-driven factoring companies enter the market, some providers now advertise factoring fees starting as low as 0.8%, pressuring legacy factoring firms to become more competitive.
- Sector specialization is deepening. Trucking- and staffing-specific factoring providers continue to build out fuel-card integrations, payroll-funding add-ons, and other vertical-specific services beyond basic invoice advances.
- Non-recourse factoring demand is rising amid economic uncertainty, as businesses increasingly value shifting customer-default risk to the factoring company even at a higher fee, particularly when working with newer or less-established customers.
Frequently Asked Questions
How fast can I actually get funded through invoice factoring?
Many fast factoring providers advance funds within 24 to 48 hours of approving an invoice, though first-time setup with a new provider typically takes longer due to initial underwriting.
Does invoice factoring hurt my credit like a loan would?
Generally no. Because factoring is a sale of an asset rather than a loan, it typically doesn’t appear on your business credit report the way a traditional loan would, though this can vary by provider and structure.
What percentage of my invoice will I actually receive?
Most factoring companies advance 70% to 90% of the invoice value upfront, releasing the remaining balance — minus fees — once your customer pays.
Is invoice factoring based on my credit or my customer’s credit?
Primarily your customer’s. Because the factoring company is ultimately relying on your customer to pay the invoice, your customer’s creditworthiness matters more than your own business credit history.
What happens if my customer never pays the invoice?
It depends on whether your agreement is recourse or non-recourse. Under recourse factoring, your business remains responsible for the unpaid amount; under non-recourse factoring, the factoring company generally absorbs that risk.
Discover more from The Economy
Subscribe to get the latest posts sent to your email.



DoorDash posted $4.45B Q2 revenue on 970M orders, but net income fell 30%. Inside Dasher costs, the new fee model and the autonomy bet.
Executive Summary / Key Takeaways
- Q2 2026 results: revenue up 36% year-on-year to $4.45 billion, Marketplace GOV up 36% to $33.1 billion, total orders up 27% to 970 million.
- Excluding the Deliveroo acquisition, the underlying growth rates are materially lower: orders up 17%, GOV up 23%, revenue up 24%.
- Adjusted EBITDA was $914 million, up 40% year-on-year, but GAAP net income fell 30% to $200 million on higher legal and regulatory expenses.
- Management guided take rate to stay flattish in Q3 and decline in Q4 due to seasonal Dasher cost increases, insurance step-up and higher delivery complexity in winter.
- A California Employment Development Department audit over payroll-tax liabilities tied to Dasher classification remains unresolved, with an amount accrued and outcome uncertain.
1. Introduction & Immediate Context
DoorDash’s quarterly numbers look uniformly strong until you separate what the company bought from what it built — and until you read what management said about the fourth quarter.
In Q2 2026 the company grew total orders 27% year-on-year, Marketplace GOV 36% and revenue 36%. Excluding the impact of Deliveroo, those figures were 17%, 23% and 24% respectively, per the company’s own disclosure. Net income attributable to common stockholders was $200 million and Adjusted EBITDA was $914 million, described by management as well above expectation.
The acquisition closed on 2 October 2025, with consideration of $3.72 billion and acquisition-related costs of $58 million recorded as general and administrative expenses, according to the quarterly filing. Roughly a third of headline growth is therefore purchased rather than organic — which does not make it bad growth, but does change what the multiple is paying for.
2. Core Financial and Unit Economics Analysis
2.1 Q2 2026 at a glance
| Metric | Q2 2026 | Year-on-year | Ex-Deliveroo | Source |
|---|---|---|---|---|
| Revenue | $4,454m | +36% | +24% | DoorDash IR |
| Marketplace GOV | $33,078m | +36% | +23% | 10-Q |
| Total orders | 970m | +27% | +17% | DoorDash IR |
| Adjusted EBITDA | $914m (2.8% of GOV) | +40% (from $655m) | — | 10-Q |
| GAAP net income | $200m | -30% (from $285m) | — | 10-Q |
| Gross margin | 49.9% (adj. 54.2%) | — | — | Quartr / company data |
| Operating cash flow | $944m | from $504m | — | 10-Q |
| Q3 GOV guidance | $33.0–34.0bn | — | — | Company guidance |
| Q3 Adj. EBITDA guidance | $950–1,100m | — | — | Company guidance |
2.2 What “seasonal Dasher cost increases” actually means
The most informative line in the quarter is a guidance caveat. Take rates are expected to remain flattish in Q3 before declining in Q4 due to seasonal increases in Dasher costs, an insurance step-up and higher delivery complexity during winter months, per the earnings call summary.
Translated: in winter, DoorDash must pay more per delivery to keep enough Dashers on the road, and it does not fully pass that cost to consumers. Courier supply is price-elastic and weather-sensitive, and the platform absorbs the gap. That is a structural feature of the model, not a one-off — which is why Q4 margin compression recurs annually and why courier earnings and platform take rate are directly linked rather than independently set.
The company also took an explicit cost hit on fuel. For Q2 2026, DoorDash anticipated the gross cost of its Dasher gas relief programme at over $50 million, expecting to fund it at least partly by adjusting investment elsewhere, per its Q1 disclosure. With national pump prices above $4 per gallon through 2026, that is a direct transfer from platform margin to courier economics driven by macro energy conditions.
2.3 The fee restructure
DoorDash introduced a new fee structure for larger delivery radiuses. Management characterised it as a realignment of what consumers pay relative to the time and effort Dashers put in, noting that for the vast majority of orders the fee is similar or slightly less and that no substantial P&L impact is expected, though it could affect consumer behaviour in certain markets.
The framing is worth parsing. A distance-indexed fee acknowledges that flat pricing systematically underpays long-haul deliveries — a persistent complaint among couriers. Whether it raises courier earnings depends on how much of the incremental fee reaches the Dasher rather than the platform, which the company has not broken out.
3. Structural Drivers and Competitor Gaps
The classification question is a live liability, not a settled one. The 10-Q names an unresolved California Employment Development Department audit concerning payroll-tax liabilities tied to Dasher classification, with an amount accrued and ultimate resolution uncertain. GAAP net income fell 30% partly on higher legal and regulatory expenses. Most coverage of DoorDash’s profitability improvement omits this entirely, and it is the single largest tail risk to the cost structure.
Membership is doing the retention work. US paid DashPass members increased more in the twelve months through Q2 2026 than in the previous twenty-four months combined. Management’s stated logic is that membership reduces transactional friction through affordability, which drives retention, engagement and merchant sales. For equity analysts, subscription penetration is a better forward indicator than order growth.
Autonomy is a cost-structure bet on the courier line. DoorDash Dot, the company’s autonomous delivery effort, is expected to reach high single-digit penetration in test markets by year-end, with a Phoenix-first rollout. CEO Tony Xu has framed the difficulty as marrying operations with technology rather than as a pure technical problem. The strategic logic is straightforward: if seasonal Dasher cost increases are the recurring drag on Q4 take rate, autonomous capacity attacks that line directly. That is a multi-year thesis, not a 2027 one.
Grocery is the margin frontier and the operational problem. Management has flagged inventory accuracy as a structural challenge, addressed through DashMart Fulfillment Services — capital-intensive physical infrastructure that is complicated to roll out. Global tech-stack unification is projected fully online by early 2027.
4. Key Implications for Stakeholders
Delivery gig workers. Courier earnings are tightest exactly when the platform’s costs are highest — winter, when demand and pay both rise but so does delivery difficulty. The distance-based fee change is worth monitoring on individual earnings statements rather than taking on the company’s characterisation, since management stated most orders see a similar or slightly lower fee.
Tech sector equity analysts. Strip Deliveroo before modelling. Organic revenue growth of 24% against headline 36% is the number that should drive the multiple. Watch Q4 take rate against guidance as the cleanest test of whether courier cost inflation is cyclical or structural.
Consumer analysts. DashPass growth outpacing the prior two years combined during a period of elevated food and fuel inflation suggests the subscription is functioning as a hedge for households, not a discretionary add-on. That is a meaningfully different consumer behaviour signal than order volume alone.
Risk and compliance teams. The California audit sets a template. Any resolution establishing payroll-tax liability for classified-as-independent couriers would reprice unit economics across the entire sector, not just DoorDash.
5. Frequently Asked Questions
Q1: How much does DoorDash make per order?
Adjusted EBITDA was $914 million in Q2 2026 on $33.1 billion of Marketplace GOV — roughly 2.8% of gross order value, up from a lower share a year earlier. That margin is expected to compress in Q4 on seasonal Dasher costs.
Q2: Why is DoorDash’s net income falling while revenue rises?
GAAP net income fell 30% year-on-year to $200 million despite 36% revenue growth, driven largely by higher legal and regulatory expenses, alongside heavy investment in autonomy, AI and technology-stack unification.
Q3: Is DoorDash changing how Dashers are paid?
The company introduced a new fee structure for larger delivery radiuses, described by management as realigning consumer fees with the time and effort involved. It also ran a Dasher gas relief programme costing over $50 million gross in Q2 2026.
Q4: What is DoorDash Dot?
DoorDash’s autonomous delivery programme, expected to reach high single-digit penetration in test markets by the end of 2026, with initial scaling from Phoenix.
Discover more from The Economy
Subscribe to get the latest posts sent to your email.

International trade in 2026 is undergoing its most radical transformation in a century. Driven by BRICS de-dollarization initiatives, multi-currency CBDCs, and tokenized cross-border settlement rails, enterprise sales cycles no longer end with a traditional wire transfer. Global Customer Relationship Management (CRM) platforms have evolved into full-scale transaction engines capable of managing multi-jurisdictional compliance, smart contracts, and instant stablecoin settlements.
Selecting the right CRM is no longer just about pipeline tracking; it is about operationalizing international trade frictionlessly across fragmented currency corridors.
Key Capabilities of 2026 Global Trade CRMs
Automated Compliance and Sanctions Screening
With trade sanctions shifting dynamically, modern CRMs integrate real-time API checks against global watchlists. Every lead and transaction is vetted automatically before a sales contract is generated, protecting enterprises from severe regulatory penalties.
Tokenized Smart Contract Invoicing
Top-tier SaaS solutions now feature native Web3 invoicing tools. Sales reps can generate multi-currency or tokenized payment links directly within the CRM deal stage, reducing settlement times from days to seconds while eliminating foreign exchange volatility risk.
| CRM Platform | Tokenized Payment Support | Compliance & Sanctions Engine | Starting Enterprise Cost |
| Salesforce Global Trade | Native Stablecoin & CBDC APIs | Advanced AI Watchlist Screening | $300 / user / mo |
| HubSpot Enterprise Int. | Third-party Web3 Gateway Integration | Automated KYC / AML Tracking | $150 / user / mo |
| Zoho CRM Plus Global | Multi-currency Smart Contracts | Basic Regional Compliance Filters | $100 / user / mo |
How to Evaluate Trade CRM Solutions
When upgrading your enterprise tech stack for cross-border commerce, evaluate vendors against specific international readiness criteria.
API Extensibility: Ensure the CRM connects smoothly with your existing treasury management systems and decentralized liquidity pools.
Data Sovereignty: Verify that customer data storage complies with localized data residency laws across all operating regions.
Transaction Latency: Test settlement speeds for tokenized invoicing during live demo phases to prevent checkout bottlenecks.
“Tech Analyst View: The winning B2B companies of 2026 are those whose sales CRMs double as financial settlement engines, collapsing the distance between a closed deal and cleared capital.”
Investing in an advanced global trade CRM ensures your enterprise remains agile, compliant, and positioned to capture high-margin international markets without banking friction.
Discover more from The Economy
Subscribe to get the latest posts sent to your email.
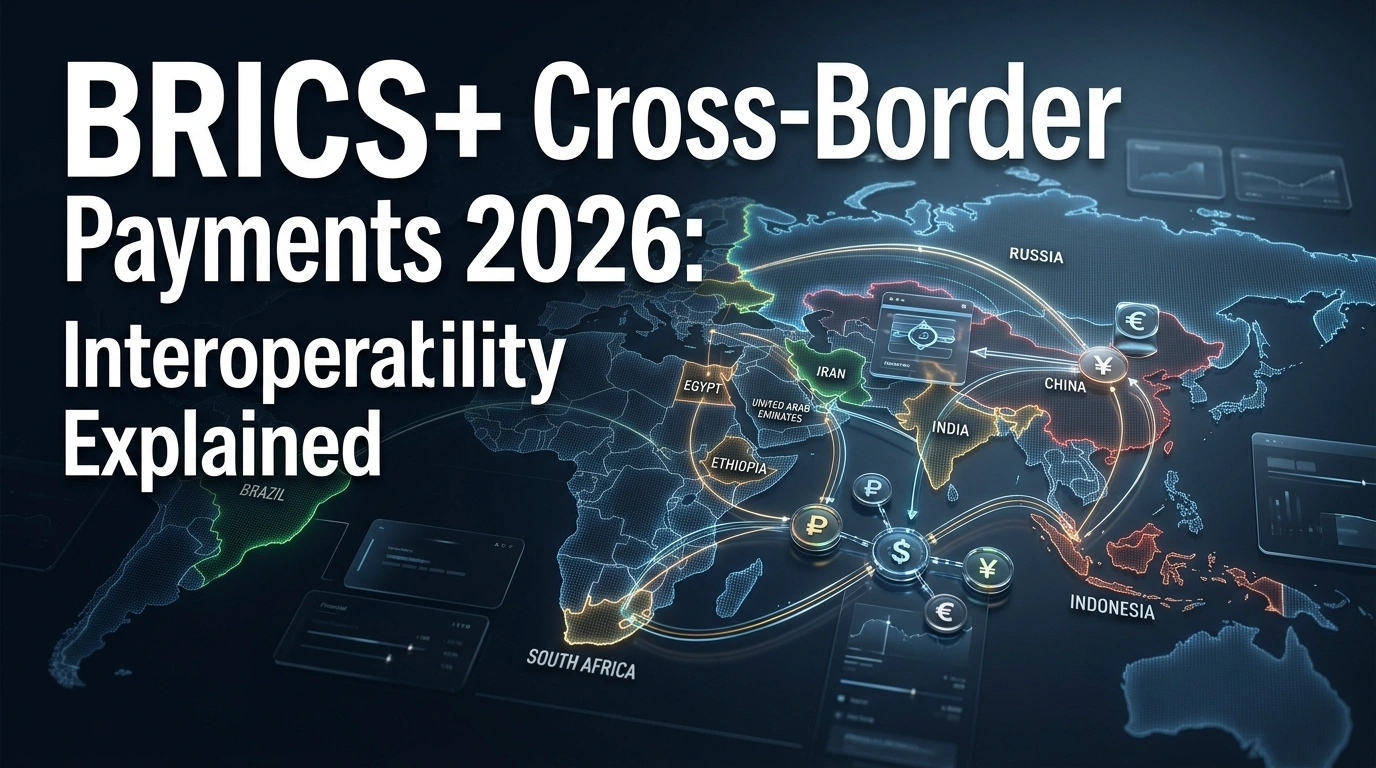
For two decades, the debate around BRICS and the US dollar centered on a single, headline-friendly but ultimately unrealistic question: would the bloc launch a common currency to rival the dollar? By 2026, that question has been decisively answered — India, holding the bloc’s 2026 chairship, has explicitly rejected a shared BRICS currency. But a quieter, more technically consequential shift has taken its place: the operational push toward interoperable national payment rails that let money move across borders in local currencies, without routing through the dollar or SWIFT.
Key Takeaways
- India’s 2026 BRICS chairship has formally ruled out a shared BRICS currency, with Commerce Minister Piyush Goyal and RBI Governor Sanjay Malhotra confirming the bloc’s focus has shifted to linking existing fast-payment systems and CBDCs instead.
- BRICS Pay began operational deployment in 2026, working to integrate China’s CIPS, India’s UPI, Brazil’s Pix, and Russia’s SPFS, with full implementation targeted around the BRICS summit in New Delhi.
- The dollar’s share of global reserves has fallen below 57%, though it still dominates foreign exchange turnover at roughly 88% — illustrating that de-dollarization is a gradual reserve-composition shift, not a currency collapse.
- UnionPay card transactions in Brazil rose more than 30% in the first half of 2026, and Argentina extended its currency swap line with China by five years, covering 130 billion yuan (~$19.1 billion) — the longest renewal in the swap’s history.
- A gold-backed settlement token — “The Unit,” 40% backed by physical gold and 60% by a basket of BRICS currencies — has moved from an October 2025 pilot into implementation-architecture and sandbox-testing phases in 2026, according to central bank officials involved in the project.
From Currency Union to Payment Interoperability: The 2026 Pivot
Earlier BRICS currency proposals failed for structural reasons that a shared payments approach elegantly sidesteps: member states operate under different inflation regimes, maintain incompatible capital controls, and pursue divergent monetary policies, making true monetary union politically and technically implausible. The 2026 approach instead prioritizes linking national digital infrastructure — China’s digital yuan, India’s digital rupee (e-rupi), and Russia’s digital ruble — through shared technical standards, while each currency remains under full domestic control.
RBI Governor Sanjay Malhotra has described the goal as connecting two types of infrastructure: central bank digital currencies (CBDCs) and fast payment systems (FPS) such as India’s UPI, Brazil’s Pix, and China’s digital yuan platform. The practical effect, if achieved, is that a payment initiated in one member country could settle almost instantly in another using local currencies — bypassing correspondent banking chains and the dollar-centered SWIFT messaging network entirely.
BRICS Pay: Architecture and Current Status
BRICS Pay is the operational umbrella for this integration effort, designed to link:
- China’s CIPS (Cross-Border Interbank Payment System)
- India’s UPI (Unified Payments Interface)
- Brazil’s Pix (the world’s most widely cited public real-time payment system)
- Russia’s SPFS (System for Transfer of Financial Messages, Russia’s SWIFT alternative)
According to reporting on the system’s 2026 rollout, BRICS Pay began operational deployment during the year, with full implementation targeted around the BRICS summit hosted by India. Reporting on this topic varies significantly in authority and should be read with appropriate skepticism: higher-authority sources (GIS Reports Online, the BRICS Council’s own analytical arm) describe integration efforts as progressing carefully and incrementally, while several lower-authority financial commentary sites describe more sweeping claims about the system’s completeness. The more conservative reading, consistent with the higher-authority sourcing, is that BRICS Pay in 2026 represents a genuine and accelerating technical integration effort that remains short of full multilateral deployment.
The Gold-Backed “Unit”: A Parallel Settlement Layer
Alongside BRICS Pay, central banks within the bloc have been developing a blockchain-based settlement token — commonly referred to as “The Unit” — structured with 40% backing in physical gold and 60% in a basket of BRICS member currencies. Officials involved in the project have described a completed pilot and a draft implementation framework moving toward wider sandbox testing, with the initiative explicitly designed to bridge currencies rather than replace them: an Indian bank could, in principle, convert rupees into the Unit and transmit value to a Brazilian counterparty, which would convert it back into reais without a dollar intermediary at any stage.
This structure matters for the interoperability thesis specifically because it solves a problem that a shared fiat currency cannot: it allows settlement without requiring any member state to cede monetary sovereignty, while still providing a common unit of account for cross-border netting.
The Numbers Behind the Shift
| Indicator | 2026 Data Point |
|---|---|
| Dollar share of global reserves | Below 57% |
| Dollar share of FX turnover | ~88% (still dominant) |
| UnionPay transaction growth in Brazil (H1 2026) | +30%+ |
| Argentina–China currency swap renewal | 5 years, 130 billion yuan (~$19.1B) |
| Gold backing of “The Unit” settlement token | 40% gold / 60% BRICS currency basket |
| Combined BRICS+ population share represented | ~45% of global population |
The gap between the reserve-share figure (below 57%) and the FX-turnover figure (88%) is the single most important number in this analysis: it demonstrates that de-dollarization in 2026 is proceeding meaningfully at the level of central bank reserve allocation, while the dollar retains overwhelming dominance in the actual mechanics of day-to-day currency trading. Businesses planning for “the end of dollar hegemony” in the near term are working from a mischaracterized premise; businesses planning for “gradually increasing local-currency settlement optionality” are working from the data.
Why This Forces Interoperability — Not Replacement
The 2025 Rio declaration formally advanced the BRICS Cross-Border Payments Initiative and payment-system interoperability specifically — not a euro-style monetary union — a framing that India’s 2026 chairship has reinforced. The practical driver is straightforward: the freezing of Russian foreign reserves following 2022 sanctions demonstrated to Global Majority countries the concentrated risk of dependence on dollar-based settlement infrastructure that a small number of Western institutions can restrict. Interoperability among existing national systems — rather than a new currency — offers a path to reducing that specific exposure without requiring any country to abandon monetary sovereignty or predictable domestic policy tools.
Implications for Businesses and Investors
- Trade finance desks serving BRICS-adjacent markets should begin tracking CIPS, UPI, Pix, and SPFS interoperability milestones directly, since settlement-corridor changes could shift the relative cost and speed of cross-border trade finance well before any headline “BRICS currency” event occurs.
- Multinational treasury functions operating in Brazil, India, Russia, or China should monitor local-currency settlement options as a genuine, if still developing, alternative to dollar-denominated trade finance — particularly for intra-bloc trade.
- Currency risk models should distinguish reserve-composition shifts from FX-turnover dominance. The 57%/88% gap above is the clearest evidence that dollar dominance in transactional finance is far stickier than dollar dominance in reserve holdings.
Frequently Asked Questions
Is BRICS launching a new currency to replace the US dollar?
No. India, holding the 2026 BRICS chairship, has explicitly rejected a shared BRICS currency; the bloc’s actual 2026 focus is on linking existing national payment systems and CBDCs for interoperability, not creating a common currency.
What is BRICS Pay?
BRICS Pay is a cross-border payment integration effort linking China’s CIPS, India’s UPI, Brazil’s Pix, and Russia’s SPFS, designed to allow local-currency settlement between member states without routing through SWIFT or the US dollar.
Is the US dollar losing its global dominance in 2026?
Partially and unevenly. The dollar’s share of global reserves has fallen below 57%, but it still accounts for roughly 88% of foreign exchange turnover, indicating a gradual shift in reserve composition rather than a collapse in transactional dominance.
Conclusion
The 2026 BRICS+ story is not the dramatic currency-replacement narrative that circulates in less rigorous financial commentary — it is a more consequential, if less headline-grabbing, infrastructure story. By prioritizing interoperability among existing national payment systems over a politically and technically implausible common currency, the bloc representing roughly $30 trillion in combined economic output and 45% of the global population is building the plumbing for a genuinely multipolar payments architecture — one that will reshape trade finance and settlement costs gradually, corridor by corridor, well before it meaningfully challenges the dollar’s transactional dominance.
Discover more from The Economy
Subscribe to get the latest posts sent to your email.

World’s Largest Economies: Ranking the Top Global Powers

Business Loan: A Complete 2026 Guide to Rates, Types, and Qualifying

Fast Invoice Factoring: How to Turn Unpaid Invoices Into Cash Within 24 Hours

Investment Banking Services: What They Cost and How to Choose the Right Firm in 2026

Structured Settlement Loan: What “Cash Now” Offers Actually Cost You

DUI Attorney: Why Your First Call After an Arrest Should Never Be to the Court

Personal Injury Lawyer: A Complete Guide to Filing Your Claim in 2026

Commercial Vehicle Accident Lawyer: Holding Companies Accountable Beyond the Driver

Inside the White House Feud: How Trump’s Allies Are Painting Anthropic’s Dario Amodei as the Face of ‘AI Doomerism’

Truck Collision Attorney: What Your Case Is Really Worth After a Semi-Truck Crash

Beyond Petrochemicals: How Indonesia’s Chandra Asri is Constructing an Integrated ASEAN Mobility Powerhouse

Pakistan Moves From Stabilization to Recovery as IMF Review Puts Reform Momentum in Focus

Mesothelioma Attorney: How to Choose the Right Lawyer to Maximize Your 2026 Asbestos Settlement

SpaceX IPO 2026: History’s Biggest Stock Debut?

Top 30 Stocks for Investment in PSX for Massive ROI in 2026

SpaceX Starship Flight 14: First Orbital Attempt & Starlink V3 Launch Explained

Oil Prices Break $100 in 2026: Middle East Conflict & Energy Markets

Fidelity Investments Review 2026: SPAXX Yields & Zero-Fee Funds

AI Chip Stocks 2026: The Best Semiconductor Investments Beyond Marvell

Tween Back-to-School Trends 2026: What’s Driving the $85B Season

BRICS+ Cross-Border Payments 2026: Interoperability Explained

10-Year Treasury Yield Hits 4.80%: What It Means for Rates & Portfolios

Shein Clothes Quality & Safety in 2026: What Lab Tests Show

China’s US$10.8 Billion Trade Shortcut: Why the Pinglu Canal Matters

MRVL Earnings 2026: Why Marvell Sank Despite Beating Estimates

IMF & World Bank 2026 Global Economic Outlook: Growth, Inflation, Debt

Middle East War Economics 2026: Oil Prices & Energy Markets

High-CPM Finance Niches 2026: Publisher Monetization Blueprint
-

 Markets & Finance9 months ago
Top 15 Stocks for Investment in 2026 in PSX: Your Complete Guide to Pakistan’s Best Investment Opportunities
-

 Analysis7 months ago
Johor’s Investment Boom: The Hidden Costs Behind Malaysia’s Most Ambitious Economic Surge
-

 Analysis7 months ago
Top 10 Stocks for Investment in PSX for Quick Returns in 2026
-

 Banks8 months ago
Best Investments in Pakistan 2026: Top 10 Low-Price Shares and Long-Term Picks for the PSX
-

 Analysis8 months ago
Brazil’s Rare Earth Race: US, EU, and China Compete for Critical Minerals as Tensions Rise
-

 Investment9 months ago
Top 10 Mutual Fund Managers in Pakistan for Investment in 2026: A Comprehensive Guide for Optimal Returns
-

 Global Economy9 months ago
15 Most Lucrative Sectors for Investment in Pakistan: A 2025 Data-Driven Analysis
-

 Global Economy9 months ago
Pakistan’s Export Goldmine: 10 Game-Changing Markets Where Pakistani Businesses Are Winning Big in 2025