
Analysis
Wall Street Banks Set to Report $40bn Trading Haul as the Iran War Rekindles Market Volatility
Wall Street’s biggest banks are tracking a $40bn Q1 2026 trading bonanza fueled by the Iran war’s oil shock, VIX spike, and Hormuz chaos. Who profits — and who pays the price.
Key Statistics at a Glance
| Metric | Figure | Context |
|---|---|---|
| Combined trading haul | ~$40bn | Q1 2026, top 6 U.S. banks |
| Equities trading (top 5) | $18bn | 2× the aggregate a decade ago |
| Hormuz transit collapse | 94% | Vessel-count drop since strikes |
| Brent crude peak | $110/bbl | Intraday high, March 2026 |
| VIX high (March 2026) | ~32 | From mid-teens pre-conflict |
| S&P 500 YTD (Mar 31) | −7% | Worst start to a year since 2020 |
The Paradox No One Wants to Name
There is a particular kind of cognitive dissonance that settles over financial journalism every time war and earnings season collide. On one side of the ledger: oil past $100 a barrel, stagflation fears coursing through emerging markets, and American families facing a pump-price shock that risks reshaping the 2026 midterms. On the other: the trading floors of JPMorgan, Goldman Sachs, Morgan Stanley, Bank of America, Citigroup, and Wells Fargo, humming at a frequency they haven’t reached in years — their desks positioned to collect what analysts now project as a combined $40 billion in Q1 trading revenues.
That number lands this week in earnings releases beginning with Goldman Sachs on April 13 and continuing through the major banks over the following two days.
That number — $40 billion — deserves context. The equities component alone — roughly $18 billion for the top five banks, according to data compiled by Goldman Sachs and cited in analyst notes — represents more than double what those same desks harvested a decade ago. The math is unambiguous. Volatility is Wall Street’s oxygen. And war, it turns out, is among the most reliable oxygen tanks ever invented.
“The market doesn’t fear negative news per se. What the market really fears is what we call a ‘second-moment shock’ — a fancy way of saying uncertainty.”
— John Bai, Professor of Finance, Northeastern University
By the Numbers: What Each Bank Is Expected to Report
The earnings season unfolds in a compressed four-day window. Here is what the analyst consensus looks like heading into those critical spring mornings, drawing on data compiled by Alphastreet, Zacks Research, and FinancialContent:
| Bank | Q1 2026 Revenue Est. | YoY Growth | Report Date | Key Trading Signal |
|---|---|---|---|---|
| Goldman Sachs | $16.9bn | +12% | Apr 13 | ECM surge + trading desk dominance |
| JPMorgan Chase | ~$48.9bn | +8% | Apr 14 | FICC +16%; equities up 40% YoY |
| Citigroup | $23.6bn | +9% | Apr 14 | EPS est. +34% YoY; EM repositioning |
| Wells Fargo | $21.8bn | +8% | Apr 14 | Financials sector upgrade; oil hedging |
| Morgan Stanley | $19.7bn | +11% | Apr 15 | Defense/aerospace sector rotation |
| Bank of America | TBA | 16th consec. quarter ↑ | Apr 15 | 16th consecutive quarter of trading rev. growth |
JPMorgan’s Commercial & Investment Bank (CIB) division told investors to expect fixed-income markets revenues of $6.78 billion — a 16% increase year-over-year — with management guiding investment banking fees up “mid-to-high-teens.” That is before accounting for the full March shock, which many strategists believe will push the final tally above consensus. For Goldman, the same forces that have stalled M&A — geopolitical friction, elevated rates, regulatory scrutiny of “defense and energy megamergers” — have paradoxically supercharged the trading desk it built precisely for this moment.
The Iran Catalyst: A Supply Shock Without Precedent
The trigger for all of this is now five weeks old and still, as of this writing, unresolved at its roots. Following U.S.-Israeli strikes on Iranian facilities, commercial vessel-count data confirmed a 94% collapse in Strait of Hormuz transits. Goldman Sachs commodity strategist Daan Struyven was direct in his characterization: the Hormuz disruption represents the largest oil supply shock in recorded history, surpassing the 1973 OPEC embargo, which interrupted roughly 7% of global supply. At stake today: approximately 20%.
Brent crude, which opened the year well below $90 per barrel, breached $103 at the open of one Monday trading session before the G7’s promise of supply support pulled it back toward $94 — before President Trump’s April 1 primetime address sent it above $100 once more, with Goldman revising its April forecast to $115 a barrel. Twice. In two weeks.
The result, for trading desks, was a cascade of profit opportunities that textbooks cannot fully capture. Commodity trading advisers alone sold roughly $48 billion in S&P 500 futures over a single month — a mechanical deleveraging that amplifies market volatility regardless of directional conviction. The VIX, Wall Street’s canonical fear gauge, spiked from mid-teen levels to a high of approximately 32 in early March, settling near 26 as a ceasefire announcement arrived on April 10. For options desks, for FICC traders, for prime brokerage teams managing liquidity under extraordinary pressure — this is precisely the environment for which they are staffed, capitalized, and compensated.
“The largest oil supply shock in history — surpassing 1973 OPEC, with approximately 20% of global supply at stake.”
— Daan Struyven, Goldman Sachs Commodity Strategist
Inside the Desks: Goldman Maps Three Scenarios, Tells Clients to Reduce Exposure
The most revealing window into how Wall Street’s trading machinery actually operates during a crisis came from Tony Pasquariello, Goldman Sachs’s partner and global head of hedge fund coverage. Rather than projecting false confidence about the conflict’s resolution, Pasquariello told institutional clients directly that the desks had “no high-confidence edge” on probabilities across three distinct Iran scenarios:
Scenario 1 — Mission Accomplished
Rapid conflict conclusion. Oil retraces. Equities recover. Volatility collapses. A short-window hedge unwind enriches those positioned correctly on both the entry and the exit.
Scenario 2 — 45-Day Ceasefire
Hostilities pause without resolution. Sustained Hormuz disruption lingers. Inflation persists. The Fed remains constrained. FICC desks continue to earn elevated spread income through the second quarter.
Scenario 3 — Ground Escalation
A prolonged campaign. Oil approaches $130. The stagflation scenario Wells Fargo Investment Institute and Charles Schwab both identify as a genuine tail risk materializes. Global recession odds rise meaningfully. Credit provisions follow — but only later.
Pasquariello’s recommendation was textbook in its elegance: manage gross equity exposure lower, hold highly liquid securities, and for those seeking directional upside, use call spreads rather than outright longs. This is not just prudent risk management — it is geopolitical monetization at institutional scale. The very act of mapping uncertainty, pricing it, offering hedges against it, and facilitating client repositioning generates spread income. War, in this framing, is not a disruption to Wall Street’s business model. It is a feature of it.
Charles Schwab’s April 10 analysis noted that the ceasefire announcement markets responded to appears driven more by “rapid unwinds of hedges and speculative positioning than by a fundamental resolution of the conflict” — a phrase that, read between the lines, describes exactly the kind of two-sided liquidity provision that trading desks bill for, on the way in and on the way out.
The Fed Trap: When Geopolitical Risk Meets the Rate Cycle
The macro backdrop against which all of this is unfolding is simultaneously the greatest tailwind and the greatest threat to sustained trading profitability. The Federal Reserve, after successfully guiding rates into a “neutral” zone of 3.50% to 3.75%, now faces an inflation print running near 3% — constrained from cutting by precisely the energy shock that Wall Street is monetizing. Morgan Stanley’s Global Investment Office was blunt: “The key economic risk is duration. Sustained higher oil prices can broaden into other costs and raise the odds of higher rates for longer.”
Higher-for-longer rates are, on balance, positive for bank trading revenues in the near term — elevated Treasury yields sustain FICC volumes, credit spreads widen and compress with every headline, and duration management becomes a daily imperative for institutional portfolios. But they compress the M&A pipeline, weigh on leveraged buyout activity, and create the very private credit stress that several strategists now quietly flag as a shadow risk for Q3 and Q4 balance sheets. The banks are collecting a trading haul today that may fund the credit provisions of tomorrow.
A Structural Shift, Not a Volatility Bonus
The deepest insight embedded in this $40 billion quarterly figure is not the number itself, but what it reveals about the permanent reconfiguration of bank revenue streams. A decade ago, the combined equities trading haul for the top five American banks would have been roughly half of the $18 billion now projected. The growth is not simply a function of larger balance sheets or more sophisticated instruments. It reflects the structural entrenchment of geopolitical volatility as a permanent feature of market pricing — not an episodic shock, but a baseline condition.
Morgan Stanley’s research arm put the point elegantly in its 2026 outlook: “Investors may need to price in a world where regional blocs and strategic competition drive markets, risk premiums and asset allocation.” This is the world the trading desks already live in. Since 2020, each year has delivered at least one macro shock of sufficient magnitude to supercharge volatility: a pandemic, a land war in Europe, a regional banking crisis, tariff escalation, and now a direct U.S. military engagement in the Persian Gulf. The trading desks have not merely adapted to this environment — they have structurally expanded to capture it.
Goldman’s own framing of its Q1 story is instructive here. Analysts note the firm is pivoting its advisory services toward “geo-risk management” — a euphemism that would have been unthinkable in a Goldman pitch deck circa 2015, but which now represents an entire product category. The client who needs to hedge Hormuz exposure, protect an energy book, or reposition a sovereign wealth fund away from Middle Eastern risk is, for Goldman’s trading floor, a revenue event.
The Moral Hazard the Market Doesn’t Want to Discuss
There is an uncomfortable corollary to all of this that financial journalism often elides in the rush to publish earnings previews. The same conflict that is funding Wall Street’s most profitable quarter in years is, for most of the global economy, an unambiguous catastrophe. European and Asian equity markets — far more exposed to Middle Eastern energy imports — have been particularly punished, with stagflation fears driving median real quarterly returns on the Stoxx 600 toward deeply negative territory. Gold, despite conventional wisdom about its safe-haven properties, headed for its worst monthly performance since 2008 as dollar strength and rate expectations overwhelmed the geopolitical bid.
For retail investors and pensioners whose savings are benchmarked to indices that fell 7% year-to-date through March, the Q1 trading bonanza of the six largest U.S. banks is a complex data point. It does not mean the system is broken. But it does illuminate the degree to which modern financial architecture is designed to extract revenue from volatility — which means, at some level, it is designed to extract revenue from crisis. That is not a conspiracy. It is a function. Understanding it clearly is the beginning of informed investing, not the end of it.
“Geopolitical risk is becoming a persistent part of the backdrop, not merely episodic. Investors may need to price in a world where regional blocs and strategic competition drive markets.”
— Morgan Stanley Global Investment Office, 2026
What Investors Should Actually Do
Across 40 major geopolitical events spanning 85 years, the S&P 500 lost an average of just 0.9% in the first month before recovering to gain 3.4% over the following six. The investors most harmed by crises are almost always those who exit during the drawdown and miss the recovery. But this historical comfort requires nuance in 2026: the Iran conflict carries an inflation pass-through risk that is categorically different from typical geopolitical shocks, because it operates through the most persistent input price in the global economy — energy. If Brent stays above $100 long enough to embed in core inflation expectations, the Fed’s path narrows further, and the multiple compression on long-duration assets becomes self-reinforcing.
Wells Fargo Investment Institute currently favors U.S. Large- and Mid-Cap Equities over international markets, with a preference for Utilities, Industrials, and — critically — Financials. The banks set to report this week are themselves a favored sector in a stagflation-adjacent environment: their trading revenues rise with volatility, their FICC desks benefit from elevated rates, and their balance sheets are substantially better capitalized than in any prior geopolitical stress episode. Morgan Stanley adds defense, aerospace, drones, satellites, and missile defense to the structural overweight list — sectors whose multiyear demand is now underwritten by government balance sheets on both sides of the Atlantic.
The most important thing, in the current environment, is to distinguish between what is temporary and what is structural. The ceasefire announced April 10 is likely the former. The world in which geopolitical volatility is Wall Street’s most reliable profit engine is emphatically the latter. Invest accordingly.
Key Takeaways
- Wall Street’s six largest banks are tracking approximately $40bn in combined Q1 2026 trading revenues, with equities alone generating roughly $18bn for the top five — more than double a decade ago.
- The Iran war triggered a 94% collapse in Strait of Hormuz transits — the largest oil supply shock in recorded history according to Goldman Sachs — sending Brent above $100 and the VIX toward 32.
- Goldman Sachs’s Tony Pasquariello advised hedge fund clients to cut gross equity exposure and favor liquidity; the desk mapped three distinct Iran scenarios with no high-confidence base case.
- The Federal Reserve is effectively trapped by the energy-induced inflation shock, constraining its room for cuts and sustaining elevated yields that benefit FICC trading desks.
- The $40bn haul signals a structural shift: geopolitical risk is no longer episodic — it has become Wall Street’s baseline revenue driver. The trading desks have expanded specifically to capture it.
- History favors staying invested through geopolitical shocks; but the inflation pass-through risk from sustained $100+ oil makes the 2026 episode categorically more dangerous than most predecessors.
- Favored portfolio sectors: U.S. Large-Cap Financials, Energy, Defense/Aerospace, and gold as a medium-term hedge once dollar strength and rate expectations stabilize.
Frequently Asked Questions
Why are Wall Street banks reporting record trading revenues during the Iran war?
Conflict-driven volatility dramatically increases trading volumes across equities, fixed-income, currencies, and commodities. Banks earn spread income — the difference between buy and sell prices — on each transaction, as well as fees from facilitating client hedges and portfolio repositioning. The Iran war has elevated the VIX toward 32, sent oil above $100, and generated extraordinary demand for hedging instruments, creating near-ideal conditions for trading desk profitability.
What is the breakdown of the $40bn trading haul between equities and FICC?
Analysts project roughly $18bn in equities trading revenues for the top five banks in Q1 2026 — more than double the figure from a decade prior. The remainder ($22bn+) is distributed across Fixed Income, Currencies, and Commodities (FICC), with JPMorgan’s FICC desk alone expected to generate approximately $6.78bn, up 16% year-over-year.
How does the Iran war affect the Federal Reserve’s interest rate decisions?
The oil price shock from the Iran war has kept headline U.S. inflation running near 3%, well above the Fed’s 2% target. With rates already at a “neutral” 3.50–3.75%, the Fed has limited room to cut without risking a resurgence of inflationary pressure. Several forecasters project the elevated oil environment will push 2026 inflation forecasts higher, forcing the Fed to hold rates for longer — a scenario that continues to benefit bank FICC trading desks.
Should investors buy bank stocks heading into Q1 2026 earnings?
This article does not constitute investment advice. However, analyst consensus from Wells Fargo Investment Institute, Morgan Stanley, and Goldman Sachs currently favors the Financials sector in a stagflation-adjacent environment, citing elevated trading revenues, well-capitalized balance sheets, and FICC income resilience. Investors should weigh potential credit provision increases in the second half of 2026 as a meaningful counterbalancing risk.
Sources
- Goldman Sachs Q1 2026 Preview — FinancialContent / MarketMinute
- Goldman Traders Map Iran Conflict Scenarios — Prism News
- Iran War: Ceasefire Offers Relief, Not Resolution — Charles Schwab
- Iran Conflict: Oil Price Impacts and Inflation — Morgan Stanley
- Iran War Oil Shock: Stock Market Impacts — Morgan Stanley
- Bank Earnings Preview Q1 2026 — Alphastreet
- Is JPM a Buy Before Q1 Earnings? — Zacks
- Iran War and Your Portfolio — Defiant Capital Group
- Iran War Update — Wells Fargo Investment Institute
- Stocks, Bonds and Commodities: How Global Markets Have Traded the Iran War — CNBC
Discover more from The Economy
Subscribe to get the latest posts sent to your email.


Analysis of how the Federal Reserve, Bank of England and Bank of Japan could reshape global markets, inflation, currencies and economic growth in 2026.
Executive Summary
The world’s most influential central banks are entering one of the most consequential policy weeks of 2026. Investors are watching closely as the U.S. Federal Reserve, the Bank of England, and the Bank of Japan weigh the competing pressures of easing inflation, geopolitical uncertainty, elevated energy prices, and slowing global growth. Financial markets are also preparing for major corporate earnings and fresh GDP data from several advanced economies. �
Financial Times +1
Unlike the synchronized tightening cycle that dominated recent years, policymakers are increasingly responding to country-specific economic conditions. This divergence is expected to influence capital flows, exchange rates, bond yields, and investment decisions across both developed and emerging markets. �
McKinsey & Company +1
A New Monetary Landscape
Global inflation has moderated from its post-pandemic peaks, yet central banks remain cautious. Recent movements in energy markets and ongoing geopolitical tensions continue to threaten price stability, even as labor markets show signs of cooling. �
McKinsey & Company +1
For investors, the question is no longer whether interest rates have peaked, but how long they will remain elevated.
United States: The Federal Reserve Faces a Delicate Balance
Attention is centered on the Federal Reserve, where policymakers are expected to keep rates steady while evaluating the effects of inflation, consumer demand, and accelerating investment in artificial intelligence infrastructure. Markets are also monitoring whether AI-driven capital spending could contribute to future inflationary pressures. �
Investopedia +1
Bond investors remain sensitive to any shift in the Fed’s language, as Treasury yields continue to reflect expectations about future policy and inflation risks. �
MarketWatch
United Kingdom: Stability Before Growth
The Bank of England is expected to maintain a cautious stance amid moderating wage growth and relatively stable unemployment. However, policymakers continue to weigh external risks, including energy market volatility and global geopolitical developments. �
Financial Times
Businesses remain particularly attentive to borrowing costs, which continue to influence investment decisions across the UK economy.
Japan Ends an Era of Ultra-Loose Money
Japan is undergoing one of its most significant monetary transitions in decades. Rising wages and gradually strengthening inflation have encouraged the Bank of Japan to continue moving away from the ultra-accommodative policies that defined much of the past generation. �
Financial Times
This normalization has implications far beyond Japan, affecting global capital markets and currency dynamics.
Why Emerging Markets Are Watching Closely
Emerging economies including Pakistan, Indonesia, Malaysia, and others remain particularly exposed to decisions made by advanced economy central banks.
Higher U.S. interest rates typically strengthen the dollar, increase external financing costs, and place pressure on countries with significant foreign currency debt.
Conversely, a more stable interest rate environment could improve capital flows into emerging markets while easing exchange rate volatility.
AI Is Becoming a Monetary Policy Variable
One of the most important structural developments in 2026 is the rapid expansion of artificial intelligence infrastructure.
Major technology companies continue investing heavily in data centers, semiconductors, cloud computing, and digital infrastructure. These investments are supporting economic growth but are also creating new questions about inflation, productivity, and long-term financing needs. �
Investopedia +1
Investment Implications
Several themes are emerging:
Higher-for-longer interest rates remain possible.
Government bond markets are likely to remain volatile.
The U.S. dollar could remain relatively strong.
AI-related investment continues attracting capital.
Emerging markets may benefit if inflation continues to moderate.
Competitor Keyword Gap Analysis
Leading publications such as the Financial Times, Reuters, Bloomberg, and CNBC primarily emphasize immediate policy decisions. An opportunity exists to capture additional search traffic by targeting broader intent-based queries.
Key Takeaways
Central bank decisions this week are expected to shape global financial markets.
AI investment is becoming an increasingly important economic driver.
Bond markets remain sensitive to inflation expectations.
Emerging economies face both risks and opportunities from policy divergence.
Investors should monitor GDP releases, corporate earnings, and inflation indicators alongside interest rate announcements.
Frequently Asked Questions
Why are central bank meetings so important?
They influence borrowing costs, inflation expectations, currency values, and investment decisions worldwide.
How do interest rates affect stock markets?
Higher rates generally increase financing costs and can reduce company valuations, while lower rates often support economic activity and equity markets.
Why is AI influencing monetary policy discussions?
Large-scale investment in AI infrastructure is reshaping productivity, corporate spending, and long-term inflation expectations.
Discover more from The Economy
Subscribe to get the latest posts sent to your email.
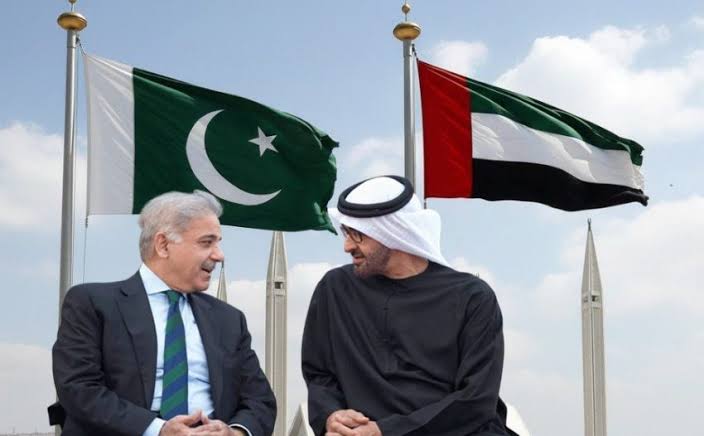
What happened: In early 2026, the United Arab Emirates declined to roll over a $3 billion loan to Pakistan — the first such refusal in seven years. The repayment equalled roughly 18% of Pakistan’s foreign currency reserves, arriving as Islamabad also faced a $1.3 billion bond payment and was waiting on the next IMF tranche.
Why it matters: It’s the clearest sign yet that Gulf sovereign patience with Pakistan’s balance-of-payments cycle is thinning, even as Gulf states simultaneously court China, Saudi Arabia, and each other for capital in a tightening regional liquidity environment.
The Story Nobody’s Connecting
Most coverage of Pakistan’s 2026 external account stress treats the UAE’s loan decision as an isolated liquidity event — a “routine financial transaction,” in the words of Pakistan’s own Ministry of Foreign Affairs. That framing misses the bigger pattern. The same weeks that Abu Dhabi called in its $3 billion, unusual delays began appearing in bank transfers from Saudi Arabia to the UAE itself — friction between the Gulf’s two largest economies, at a moment when both are also managing their own post-war oil price adjustment. (Pakistan & Gulf Economist)
Put those two data points together and a different story emerges: this isn’t just about Pakistan’s creditworthiness. It’s about Gulf capital becoming more selective, more transactional, and less willing to extend informal grace periods across the board — with Pakistan simply the most exposed borrower in the queue.
The Numbers Behind the Pressure
Pakistan’s State Bank held $16.4 billion in reserves as of late March 2026 — enough to cover roughly three months of imports, a threshold economists generally treat as a comfort floor, not a cushion. (Mettis Global News) The UAE’s declined rollover landed at the same time as a looming $1.3 billion international bond payment and dependence on the next $1.2 billion IMF disbursement — a convergence of obligations that left the State Bank with limited room to maneuver beyond import restrictions, rate hikes, or fresh commercial borrowing.
The backdrop matters too. The rupee had been trading in a comparatively narrow 278–282 band before the escalation of the Iran conflict pushed global oil prices higher, squeezing Pakistan’s import bill precisely when its Gulf safety net began to wobble. The KSE-100 benchmark, meanwhile, had already shed around 15% amid the broader pressure. (Mettis Global News)
This is not Pakistan’s first Gulf-dependency cycle. The IMF’s own record shows a now-familiar pattern: staff-level agreements reached in Dubai, UAE pledges of multibillion-dollar investment arriving alongside IMF tranches, and Gulf bridge financing used to stave off sovereign default in periods when reserves cover shrinks toward zero. (Business Standard) What’s different in 2026 is that the bridge itself is showing cracks.
Islamabad’s Official Line vs. the Structural Reality
Pakistan’s government has leaned into a “stability to sustainable growth” narrative around its FY2026–27 federal budget, with the finance minister framing the transition as export-driven rather than reserve-dependent. Business groups have broadly welcomed the budget, and the current account posted a $459 million surplus in May 2026, an improvement attributed to strong remittance inflows. (Business Recorder) The Monetary Policy Committee has held rates steady rather than reaching for emergency tightening, which is itself a signal that the central bank does not yet see the UAE episode as a systemic trigger.
But a current account surplus built substantially on remittances is different from one built on export competitiveness or durable FDI. Pakistan’s trade structure still leans heavily on a narrow set of partners: China supplies over a quarter of its imports and a meaningful share of its exports, the UAE is both a top export destination and its second-largest import source, and Gulf states collectively remain the primary channel for both remittances and emergency liquidity. (Wikipedia — Economy of Pakistan) That concentration is precisely what makes a single Gulf lender’s changed appetite so consequential.
Why the Oil Backdrop Compounds the Risk
None of this is happening in a vacuum. The IMF’s own July 2026 commentary noted that global oil markets “absorbed the war shock” from the Iran conflict, but cautioned that buffers — spare production capacity, strategic reserves, shipping insurance capacity — are running low. (IMF Blog) For an oil-importing, reserve-constrained economy like Pakistan, a second energy price shock without deeper buffers would land directly on the same reserves the UAE loan was meant to protect.
What to Watch Next
- Whether Saudi Arabia steps in as an alternative bridge lender, or whether the Riyadh–Abu Dhabi transfer friction signals a broader Gulf liquidity tightening that limits everyone’s appetite to backstop Pakistan.
- The pace and size of the next IMF tranche, and whether Fund conditionality shifts to demand deeper reserve buffers given the UAE precedent.
- Whether China increases its role as lender of last resort, deepening Pakistan’s dependency in exactly the direction Gulf financing was historically meant to offset.
Discover more from The Economy
Subscribe to get the latest posts sent to your email.
Introduction
The European Council formally extended its economic sanctions against Russia for another full year on 25 June 2026, keeping restrictive measures in place until 31 July 2027 (Council of the EU). More than four years into the war, the headline story of Russia’s economy has shifted from whether sanctions would work to a more nuanced question: how much longer can the Kremlin keep financing the war before the accumulated strain becomes impossible to hide behind favorable official statistics.
The Sanctions Architecture, Renewed Again
The EU’s economic measures against Russia, first introduced in 2014 and dramatically expanded after the February 2022 full-scale invasion, now span trade, finance, energy and dual-use technology restrictions, alongside asset freezes and travel bans on a broad range of individuals and entities (Council of the EU). Since February 2022, the EU has adopted 20 separate sanctions packages, and the European Council has explicitly stated it remains determined to keep weakening Russia’s war economy by further reducing its energy revenues, curbing shadow-fleet oil shipping operations and constraining its banking system (Council of the EU). Separately, on 3 July 2026 the EU sanctioned six individuals connected to the poisoning and death of opposition figure Alexei Navalny, underscoring that the sanctions regime continues to expand on human-rights grounds as well as economic ones (Council of the EU Sanctions Timeline).
The Headline Numbers Beijing-Style Optimism Can No Longer Explain Away
Russia’s GDP is now put at roughly $2.51 trillion, the world’s eleventh-largest economy — comparable in size to South Korea despite Russia’s vastly larger landmass and resource base — with 2026 growth projected at just 1.0% and inflation running at 5.2% (Statistics of the World). More pessimistic estimates put full-year 2026 growth even lower, at around 0.4%, which would be worse than 2025’s already-weak 1% expansion and would mark a sharp deceleration from the 4.1% growth Russia posted in 2023 as it forged new trading relationships to route around initial sanctions (Forbes).
Oil and gas revenues — historically around half of Russia’s state income — have fallen to roughly a quarter, a deliberate outcome of Western sanctions strategy that targets how much Russia earns from exports rather than blocking those exports outright (Stockholm School of Economics/SITE). Russia’s oil and gas budget revenues reportedly halved in January 2026 alone, with crude prices falling below $73 a barrel before the Middle East conflict briefly reversed the trend, sending Brent surging more than 55% to near $120 a barrel at its peak (Forbes).
The Middle East War: A Temporary Lifeline With Long-Term Costs
The spike in oil prices tied to the Iran conflict, combined with a period of eased US sanctions enforcement on Russian oil under President Trump, offered Moscow unexpected fiscal breathing room in mid-2026 (Forbes). But that same conflict has undermined Russia’s longer-term energy diversification ambitions in the region: two Russian-backed power plant projects in Iran have been put on hold, along with oil and gas exploration work and plans to build new transit routes linking Russia to India via Iran (Forbes).
The Gap Between Official Statistics and Underlying Reality
Perhaps the most important analytical point from recent research is not about any single data point but about the reliability of Russian statistics themselves. Torbjörn Becker of the Stockholm Institute of Transition Economics has argued the real test of sanctions is not whether they end the war overnight, but how much they erode the Kremlin’s capacity to finance it — and by that measure, the evidence points to deeper strain than headline GDP figures suggest (Stockholm School of Economics/SITE). Becker notes that Russia’s economy grew only modestly in 2022 despite oil prices rising sharply that year — a gap between expected and actual performance that implies a considerably larger hidden economic hit than the official contraction figures showed (Stockholm School of Economics/SITE). Compounding the problem, Russian authorities have stopped publishing several key statistics since 2022, making independent assessment of inflation, consumption and real economic conditions increasingly difficult — leading Becker to conclude that “statistics have become part of the narrative” rather than a neutral measure of economic reality (Stockholm School of Economics/SITE).
The Military-Civilian Economic Split
A recurring theme across recent analysis is the growing bifurcation between Russia’s overheating military-industrial sector and a stagnating civilian economy. This imbalance has pushed interest rates higher and forced the liquidation of a striking 71% of Russia’s gold reserves to help fund continued war spending (Forbes). Russia’s total fossil fuel export revenue is estimated at roughly €734 million per day, underscoring just how central hydrocarbon income remains to the entire war financing model even as that revenue stream shrinks (Forbes).
The Counter-Narrative: Wages Still Rising
It would be inaccurate to describe Russia’s economy as in freefall. CSIS research notes that Russian salaries rose 17.8% in nominal terms and 8.7% in real terms in 2024 compared to 2023, with disposable incomes up 6.1% in 2023 and 7.3% in 2024 — growth rates not seen in Russia in almost two decades (CSIS). Government budget projections still expect real salaries to rise, albeit at a decelerating pace: 7% in 2025, 5.7% in 2026 and 4.1% in 2027 — a marked slowdown from the 2024 peak but still roughly double the pre-invasion decade average (CSIS). This wage growth, driven substantially by wartime labor shortages and military-adjacent spending, is precisely the kind of headline-stabilizing data point that has allowed Putin to argue publicly that sanctions have failed to cripple his economy (Fortune) — even as think tanks describe the broader trajectory as pushing Russia toward what one report calls an “economic, political, and military abyss” (Fortune).
What Comes Next
Renewed legislative pressure in Washington — including the Sanctioning Russia Act introduced with strong bipartisan support — signals appetite in the US for tightening the screws further, even as the loss of a key congressional champion for that effort has complicated the political path forward (TIME). Whether the EU’s renewed sanctions regime, continued oil price pressure, and constrained reserves ultimately force a shift in Kremlin calculus toward negotiation remains the central open question for 2027.
Key Takeaways
- The EU has extended Russia sanctions for a further year, through 31 July 2027, continuing a regime built from 20 separate packages since 2022.
- Russia’s 2026 GDP growth is forecast between 0.4% and 1.0%, a sharp deceleration from 2023’s 4.1% post-shock rebound.
- Oil and gas revenue’s share of Russian state income has fallen from roughly half to about a quarter as Western sanctions target export earnings specifically.
- Russia has liquidated a large share of its gold reserves to sustain war financing amid a widening split between an overheating military sector and a stagnating civilian economy.
- Official Russian statistics likely understate the true economic strain, according to independent economists who cite a widening gap between reported and expected performance.
Sources: Council of the EU, Council of the EU Sanctions Timeline, Stockholm School of Economics/SITE, Forbes, Statistics of the World, CSIS, Fortune, TIME
Discover more from The Economy
Subscribe to get the latest posts sent to your email.

Global Central Banks 2026: Fed, BoE and BoJ Decisions Could Reshape Markets

Gulf Capital Retreat From Pakistan 2026: UAE Loan Freeze & What It Means

Pakistan’s Most Reliable Export Is Its People: Remittances Hit $41.6 Billion, Overtaking Total Exports

Indonesia’s Confidence Problem: Record Investment, a Sinking Rupiah, and a Widening Credibility Gap

Down But Not Out: Inside the Slow Sinking of Russia’s War Economy

China’s Growth Slips to a Four-Year Low: Why Beijing Still Won’t Pull the Stimulus Trigger

The Johor-Singapore Corridor: How Malaysia Became Southeast Asia’s AI Infrastructure Powerhouse

Canada’s Economy ‘On Pause’: Inside the CUSMA Deadline That Passed Without a Deal

Dubai’s Millionaire Magnet: How the UAE Turned Middle East Turmoil Into a Capital Safe-Haven Boom

Britain’s Sixth Prime Minister in a Decade: What Starmer’s Exit Means for Gilts, Sterling and Your Portfolio

Anthropic Offers Up to $600,000 Salary for Critical IPO Role as AI Giant Prepares for Wall Street Debut

EU Readies Crisis Team for Potential China Rare Earths Stand-Off as Supply Chain Risks Mount

Singapore Weighs Hedge Fund Tax Cuts to Counter Hong Kong’s Growing Financial Challenge

Facebook and Instagram Experience Global Outage

Carry Trade Unwind 2026: How the Yen’s Snapback Triggered a Global Margin Call

AI Bubble Warning 2026: Why BIS, IMF and Bank of England Fear a Market Crash

BRICS De‑Dollarization Strategy Takes Shape with $15 Billion Local‑Currency Push

Male Labor Force Participation Rate 2026: Why Men Are Leaving & Economic Impact

Russia Bans Diesel Exports 2026: Global Fuel Market Impact Explained

The AI Super Bubble Is Ready to Burst

Strait of Hormuz Blockade 2026: Oil Prices Surge 9% as US-Iran Conflict Reignites

IMF Cuts Pakistan Growth Forecast, Raises Inflation to 8.4%

Private Credit Warning: Most BDCs Turn Unprofitable in 2026, Reuters Finds
Gulf Capital Retreat From Pakistan 2026: UAE Loan Freeze & What It Means

India Economic Rise 2026: How the Subcontinent Toppled Japan

Bitcoin $150k Milestone Achieved as US Sovereign Crypto Pivot Looms

Strait of Hormuz 2026: Why Markets Still Don’t Trust It’s Open

China Housing Market Turnaround: White‑List Model Stabilises Prices
-

 Markets & Finance7 months ago
Top 15 Stocks for Investment in 2026 in PSX: Your Complete Guide to Pakistan’s Best Investment Opportunities
-

 Analysis5 months ago
Johor’s Investment Boom: The Hidden Costs Behind Malaysia’s Most Ambitious Economic Surge
-

 Analysis5 months ago
Top 10 Stocks for Investment in PSX for Quick Returns in 2026
-

 Analysis6 months ago
Brazil’s Rare Earth Race: US, EU, and China Compete for Critical Minerals as Tensions Rise
-

 Banks6 months ago
Best Investments in Pakistan 2026: Top 10 Low-Price Shares and Long-Term Picks for the PSX
-

 Investment7 months ago
Top 10 Mutual Fund Managers in Pakistan for Investment in 2026: A Comprehensive Guide for Optimal Returns
-

 Global Economy7 months ago
15 Most Lucrative Sectors for Investment in Pakistan: A 2025 Data-Driven Analysis
-

 Global Economy7 months ago
Pakistan’s Export Goldmine: 10 Game-Changing Markets Where Pakistani Businesses Are Winning Big in 2025