
Analysis
KOSPI Record Crash: South Korea’s Stock Market Suffers Its Worst Day in History as the US-Iran War Detonates a Global Sell-Off
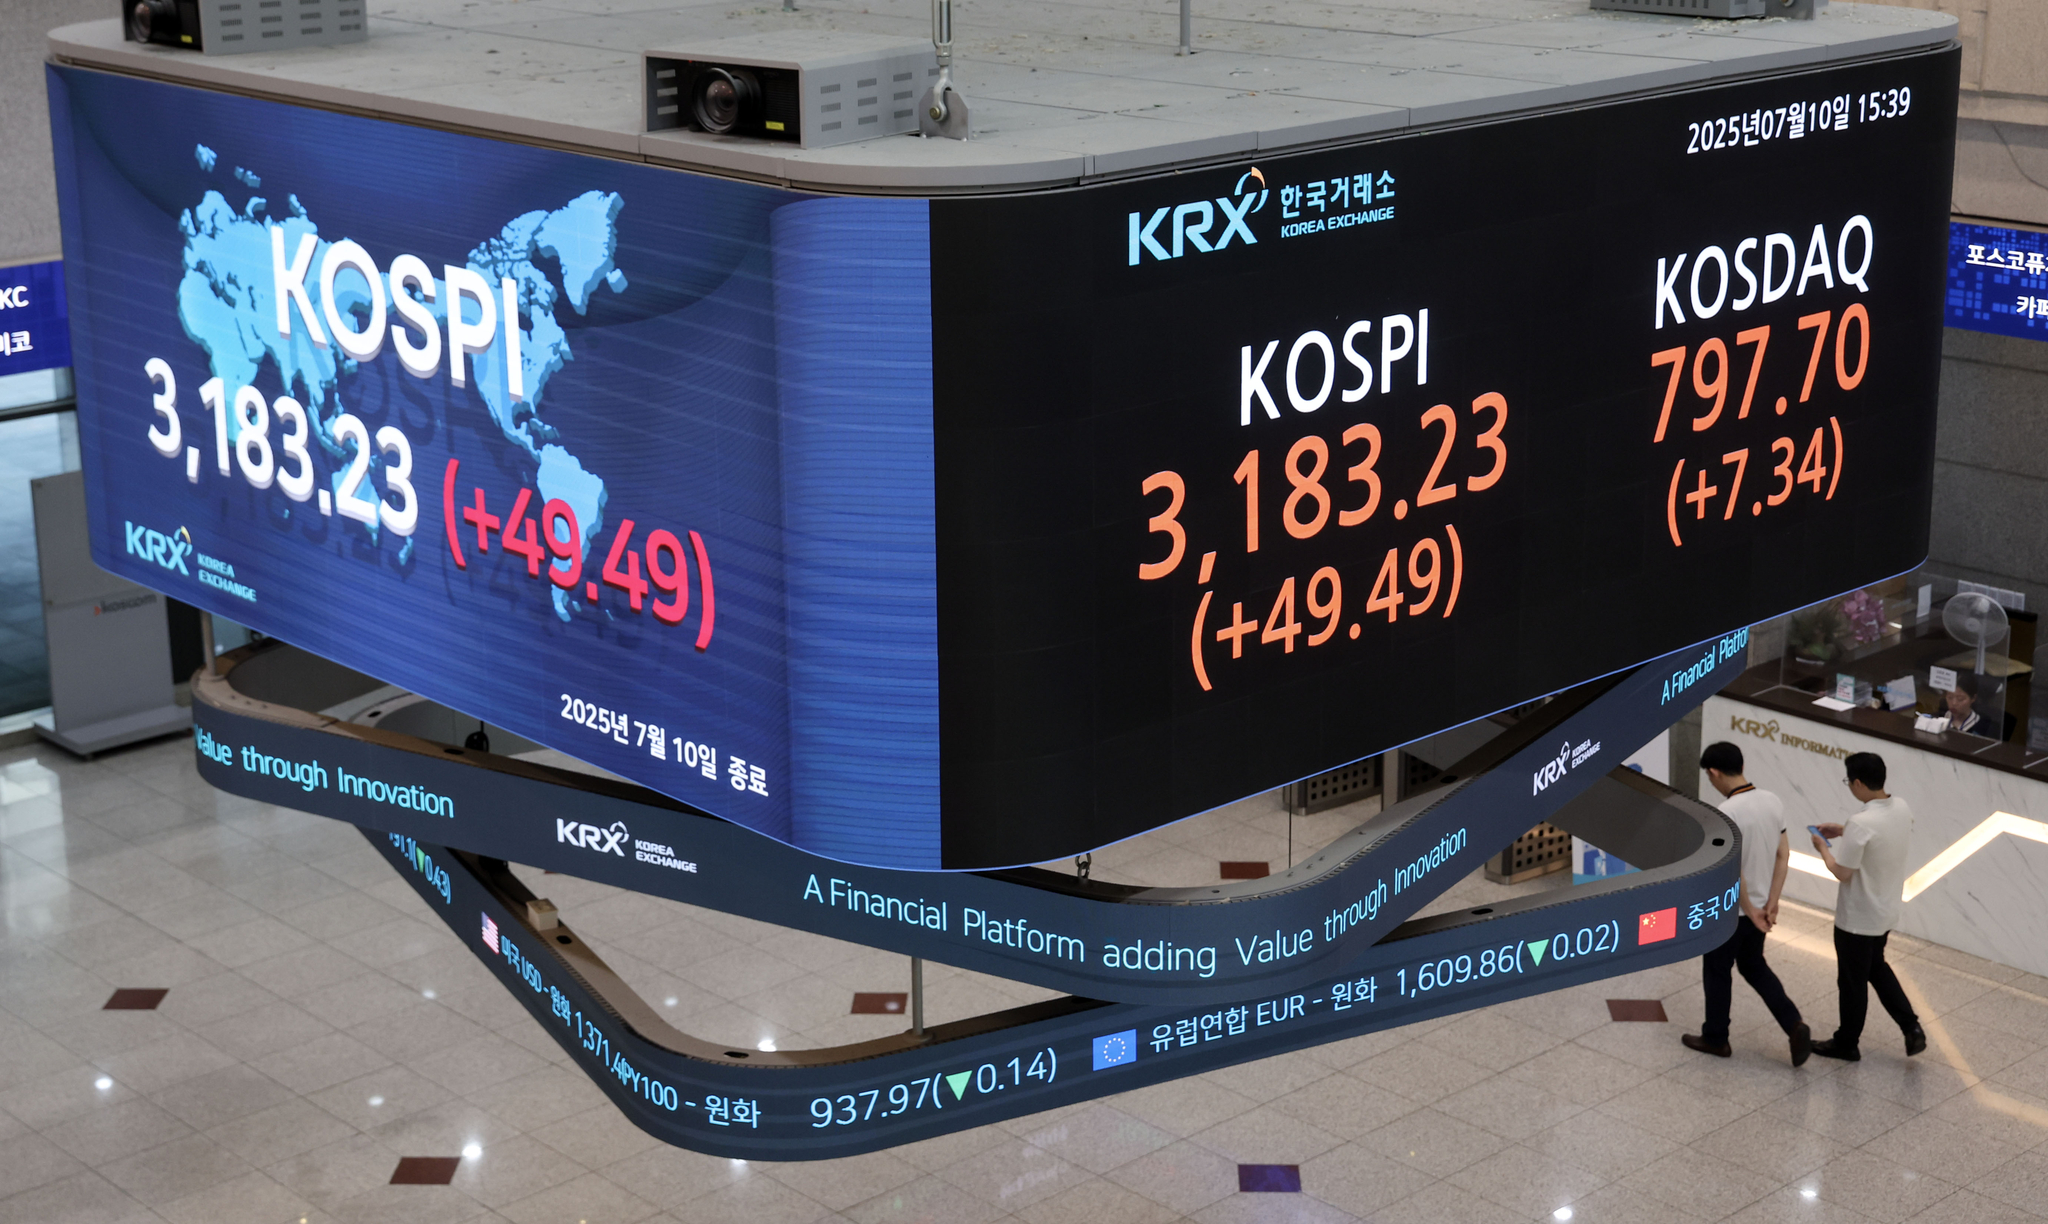
At 9:03 a.m. Korean Standard Time, the screens inside the Korea Exchange trading hall in Yeouido, Seoul, turned a uniform, searing red. Within minutes, the sell orders were not arriving in waves — they were arriving like a flood breaking through a dam. Algorithms fired. Margin calls cascaded. Retail investors, who only weeks ago were borrowing money to buy Samsung Electronics at record highs, watched years of gains dissolve in real time. By 9:17 a.m., trading had been suspended for twenty minutes: the circuit breaker, a mechanism designed for exactly this kind of controlled catastrophe, had triggered for just the seventh time in the KOSPI’s 43-year history.
By the closing bell, South Korea’s benchmark index had shed 12.06 percent — 698.37 points — to close at 5,093.54. It was the worst single day in the KOSPI’s recorded history, surpassing even the paralysing shock of September 11, 2001. The world’s hottest major stock market, up more than 40 percent in just two months, had just been broken — not by a domestic crisis, not by a company scandal, but by missiles fired 6,000 kilometres away in the Persian Gulf.
What Happened: A Minute-by-Minute Collapse
The trigger was a week in the making. On the morning of February 28, 2026, US and Israeli forces launched a coordinated series of airstrikes against Iran, an operation that reportedly included the assassination of Supreme Leader Ali Khamenei. Iran’s response was swift and economically calculated: the Islamic Revolutionary Guard Corps announced a closure of the Strait of Hormuz, the narrow chokepoint through which roughly 20 million barrels of crude oil transit daily — accounting for approximately 20 percent of global supply.
South Korean markets were closed on Monday, March 2, for Independence Movement Day. When trading reopened Tuesday morning, the pent-up global selling pressure — two full days of deteriorating sentiment compressed into a single session — hit simultaneously. The KOSPI fell 7.24 percent on Tuesday, closing at 5,791.91, its largest single-session point drop on record at that time.
Wednesday brought something far worse.
The timeline:
- 09:00 KST — KOSPI opens at 5,592.29, already down sharply from Tuesday’s close.
- 09:08 KST — Circuit breaker triggered on the KOSDAQ after losses exceed 8 percent; trading suspended 20 minutes.
- 09:14 KST — KRX activates sidecar mechanism on the KOSPI as sell orders overwhelm buy-side liquidity.
- 09:17 KST — KOSPI circuit breaker fires. At the time of the halt, the index is down 469.75 points — 8.11 percent — to 5,322.16.
- 09:37 KST — Trading resumes. Selling immediately intensifies.
- 11:20 KST — KOSPI reaches intraday low of 5,059.45, down 12.65 percent — the worst intraday reading in 25 years and 11 months.
- 15:30 KST — Official close: 5,093.54, down 12.06 percent. Of the more than 800 stocks on the benchmark, just 10 finish in the green.
The KOSDAQ, South Korea’s technology-heavy secondary index, fared even worse, closing down 14 percent at 978.44 — its largest single-day decline since its founding in January 1997. The combined two-day equity wipeout erased an estimated $430 billion in market value.
Why South Korea Was Hit Hardest: The Anatomy of a Perfect Storm
Every major economy felt the tremor of the Iran conflict on March 4. But none — not Japan, not Taiwan, not China — fell anything close to what Seoul experienced. The gap is not coincidental. It is structural.
Energy dependence, extreme and existential. South Korea imports approximately 98 percent of its fossil fuels, with around 70 percent of its crude oil sourced from the Middle East, much of it transiting the Strait of Hormuz. According to the US Energy Information Administration, South Korea ranks among the top importers of Hormuz-transit crude globally. When Iran threatened to close — and partially did close — that chokepoint, the calculus for Korean manufacturers and energy utilities changed instantly. Higher oil does not merely raise input costs; it compresses margins across the entire export-driven economy, stokes inflation, and pressures the current account. Nomura estimates that South Korea’s net oil imports represent 2.7 percent of GDP — among the highest of any major economy and a stark vulnerability flag in any energy shock scenario.
Semiconductor concentration, a double-edged sword. The KOSPI’s extraordinary 2026 rally — up more than 40 percent in the first two months of the year, touching an all-time high above 6,347 in late February — was almost entirely the story of two companies: Samsung Electronics and SK Hynix. Together, the two memory chip giants account for close to 50 percent of the index by market capitalisation, according to Morningstar equity research. When sentiment turned, that concentration did not merely reflect the market’s decline — it amplified it. Samsung Electronics fell 11.74 percent to 172,200 won. SK Hynix dropped 9.58 percent to 849,000 won. Hyundai Motor collapsed 15.80 percent. Kia Corp shed 13.82 percent. Shipping stocks Pan Ocean, HMM, and KSS Line — directly exposed to Hormuz route disruption — plunged between 16 and 19 percent.
As Lorraine Tan, Asia director of equity research at Morningstar, noted, “The decline in the KOSPI can broadly be attributable to the single-name concentration that we see in Korean markets.” She added that the drop also implied growing concern that AI data-centre adoption could slow due to significantly higher energy costs — a double hit for chips stocks caught between geopolitical risk and demand uncertainty.
Margin debt: the accelerant. Before the conflict erupted, South Korean retail investors had borrowed heavily to ride the bull market. Margin debt and broker deposits had surged to record highs. When prices began to fall, those leveraged positions triggered forced liquidations, turning an orderly retreat into a rout. “There’s been a lot of buying on credit, especially in the heavyweight stocks,” Kim Dojoon, chief executive of Zian Investment Management, told Bloomberg. “If there’s another drop on Thursday, nobody will catch a falling knife.”
The holiday amplifier. Monday’s market closure meant that South Korean markets absorbed two full days of global deterioration in a single session on Tuesday — and then suffered a second cascading wave on Wednesday, with no circuit of relief between them.
Historical Benchmark: Into Uncharted Territory
To understand the magnitude of what happened in Seoul on March 4, 2026, consider the events it eclipses.
The KOSPI has recorded a decline of 10 percent or more in a single session on only four occasions in its 43-year history. According to the Korea Herald and historical KRX data, those occasions are:
| Date | Event | KOSPI Decline |
|---|---|---|
| April 17, 2000 | Dot-com bubble peak | -11.63% |
| September 12, 2001 | Post-9/11 shock | -12.02% |
| October 24, 2008 | Global Financial Crisis | -10.57% |
| March 4, 2026 | US-Iran War | -12.06% |
The September 12, 2001 session had stood for nearly 25 years as the single worst day in South Korean market history — a day when global commerce froze and the world reoriented around fear. Wednesday’s close eclipsed it by a margin of 0.04 percentage points. The intraday low — 12.65 percent — was the deepest since April 17, 2000.
The KOSDAQ’s 14 percent plunge, meanwhile, surpassed its previous worst session: the 11.71 percent rout of March 19, 2020, at the nadir of the COVID-19 pandemic panic. What happened this week in Seoul did not merely set a record. It rewrote the category entirely.
What makes the comparison to 2001 particularly sobering is context. On September 12, 2001, markets around the world fell together. In 2026, Wall Street is barely flinching: the S&P 500 fell approximately 1 percent overnight. The KOSPI’s collapse is not a global synchronised shock — it is something more targeted, and in some ways more alarming: a geopolitical vulnerability unique to South Korea’s economic structure being stress-tested in real time.
Global Contagion: Oil, Currencies, and the Hormuz Premium
Seoul was the epicentre, but the aftershocks radiated across the region and beyond.
Oil. Brent crude surged 10–13 percent in the days following the initial strikes, trading around $80–82 per barrel by March 2–4, according to energy analysts cited by Reuters. Analysts warned that if the Hormuz disruption proves sustained, prices could breach $100 per barrel — a level that would add an estimated 0.8 percentage points to global inflation, according to projections cited in the economic impact assessment published by Wikipedia. Natural gas prices in Europe surged 38 percent following reported attacks on Qatari LNG export facilities.
The Korean won. The currency markets told the same story in different decimal places. The won briefly pierced 1,500 per dollar on Wednesday — a level not seen since March 10, 2009, at the nadir of the global financial crisis. It was, psychologically, an enormous threshold. Yan Wang, chief of emerging markets at Alpine Macro, told the Korea Herald that the Korean won is historically “one of the most sensitive emerging market currencies to global risk sentiment,” while cautioning that fundamentals do not justify such weakness unless the conflict drags on significantly.
Asian markets. The contagion spread, though nowhere matched Seoul’s severity:
- Japan Nikkei 225: -3.61% to 54,245.54
- Taiwan TAIEX: -4.40% to 32,829
- Hong Kong Hang Seng: -2.00% to 25,249.48
- Shanghai Composite: -1.00% to 4,082.47
The asymmetry is instructive. China, a major oil importer, absorbed the shock with relative composure — partly due to its diversified energy sourcing and partially because domestic policy responses appeared pre-positioned. Japan and Taiwan, similarly dependent on Middle East energy, fell meaningfully but remained far above Korean levels, their indices lacking the same speculative leverage overhang.
Travel and supply chains. Iran’s airspace was closed to civilian aircraft following the initial strikes on February 28. Multiple carriers suspended Middle East routes, with knock-on effects for travel and tourism across the Gulf. Shipping insurance costs for Hormuz-transit tankers surged, with analysts suggesting the “war premium” could add $5–15 per barrel to delivered oil costs regardless of military escort arrangements — a persistent, structural cost increase for energy importers like South Korea.
Three Scenarios: What Comes Next
The trajectory of South Korea’s markets now depends almost entirely on one variable: how long the conflict lasts, and whether the Strait of Hormuz reopens to normal commercial traffic.
Scenario 1 — Rapid Resolution (probability: 30%) The US achieves its stated military objectives within four to five weeks, as President Trump publicly signalled. Iranian counter-retaliation is contained. Oil retreats to sub-$80. In this scenario, the structural case for Korean equities reasserts itself quickly — AI memory demand remains intact, Samsung and SK Hynix resume margin expansion, and the KOSPI, still up approximately 21 percent year-to-date even after the crash, stages a sharp technical rebound. Forced liquidations reverse. Analysts at Seoul-based brokerages place a 10 percent rebound in the first week post-ceasefire as the base case for this outcome.
Scenario 2 — Prolonged Stalemate (probability: 50%) The conflict extends beyond one month. The Strait of Hormuz remains partially disrupted. Oil stabilises in the $85–95 range. South Korea’s current account balance deteriorates. The Bank of Korea is forced to weigh currency intervention against inflation pressures — a familiar but painful dilemma for an open economy. The KOSPI finds a floor in the 4,800–5,000 range as earnings revisions bite. Recovery is slow, uneven, and dependent on semiconductor demand holding firm even as energy costs rise. Foreign investors remain cautious.
Scenario 3 — Full Energy Shock (probability: 20%) The conflict escalates into a sustained regional war. Hormuz closes effectively for multiple months. Crude reaches $100 or beyond. In this scenario, Hyundai Research Institute’s earlier estimate — that sustained $100 crude could shave 0.3 percentage points from South Korea’s 2026 GDP growth — becomes conservative. The KOSPI potentially tests 4,000. The Bank of Korea is forced into emergency rate decisions. The IMF revises Asian growth projections downward across the board. Global stagflation risks — higher energy prices coinciding with slower growth — re-enter the policy conversation for the first time since 2022.
Investor Playbook and Policy Response
What regulators and institutions are doing. The Bank of Korea issued a statement vowing to “respond to herd-like behaviour” in financial markets and pledged liquidity support measures if volatility persisted. The Korea Exchange activated circuit breakers and sidecar mechanisms as designed, but market participants noted that the tools slowed rather than stopped the cascade. Foreign investors, after dumping more than 12 trillion won in equities over the two-session period, ended Wednesday as modest net buyers — 231.2 billion won in net purchases — a tentative signal that some institutional money saw the dislocation as an entry point.
BofA’s take. “The sharp decline reflects the outsized leverage in long positions heading into February 28, 2026, when market sentiment was highly bullish on Korean tech due to the aggressive shortage of memory chips used in AI server production,” BofA strategist Chun Him Cheung told Investing.com. The implication: this was not a fundamental repricing of Korea’s economic future — it was a positioning purge, painful but potentially creating opportunity.
Where rational capital might look. For investors with a six-to-twelve-month horizon, the crash has produced a rare dislocation between price and fundamental value in high-quality names. Samsung Electronics and SK Hynix — despite their catastrophic session — retain structural leadership positions in AI-grade memory chips, a market with no near-term substitute suppliers. Analysts at IM Securities and Renaissance Asset Management both noted that if the conflict resolves within one month, a rebound toward 5,500–5,800 on the KOSPI is plausible. Defensive plays in South Korean energy utilities, domestic-demand retailers, and defence contractors — which have benefited from the same geopolitical tension that crushed the broader market — offer asymmetric positioning.
For retail investors caught in forced liquidations, the message is sobering but familiar: leverage borrowed at the peak of euphoria is the most reliable way to transform a geopolitical shock into a personal financial crisis.
Conclusion: The Price of Being the World’s Hottest Market
There is a painful irony at the heart of what happened to South Korea’s stock market this week. The KOSPI was, by virtually every measure, the world’s best-performing major equity index in early 2026. It rose on the back of genuine structural tailwinds — AI memory demand, corporate governance reforms, a re-rating of Korea’s innovation economy by global fund managers. The 40-percent rally in two months was not pure speculation; it was grounded in earnings.
But markets running that fast accumulate fragility. Leverage builds. Concentration intensifies. The margin for error narrows. When an external shock arrives — not a Korean shock, not a chip-sector shock, but a missile fired in the Persian Gulf — there is no buffer. The circuit breakers fired at 9:17 a.m. and could not stop what came afterward.
The KOSPI’s record-breaking crash is not, in isolation, a verdict on South Korea’s economic future. The structural case for its semiconductor giants remains intact. The reforms that re-rated the market over the past year have not been reversed. What has changed is the risk premium: an economy that earns its export surplus in silicon must pay for its energy in oil, and oil now carries a war premium that markets cannot price with confidence.
The Strait of Hormuz is 39 kilometres wide at its narrowest point. For South Korea, that passage has never felt smaller.
FAQs (FREQUENTLY ASKED QUESTIONS)
Q1: Why did South Korea’s stock market fall more than any other country’s during the US-Iran war? South Korea’s extreme vulnerability stems from three intersecting factors: it imports approximately 98 percent of its fossil fuels, with around 70 percent sourced from the Middle East via the Strait of Hormuz; its benchmark KOSPI index is heavily concentrated in semiconductor stocks (Samsung and SK Hynix account for close to half the index’s market cap) that had rallied more than 40 percent in early 2026 on margin debt; and a public holiday on Monday March 2 compressed two days of global selling into a single catastrophic Tuesday session.
Q2: How does the March 4, 2026 KOSPI crash compare to the September 11, 2001 drop? The KOSPI fell 12.06 percent on March 4, 2026, narrowly eclipsing the 12.02 percent decline recorded on September 12, 2001, the day after the 9/11 attacks. The intraday low of 12.65 percent was the deepest since April 17, 2000. It is now the worst single-day session in the KOSPI’s 43-year recorded history, surpassing four prior instances of 10-percent-plus declines including those during the dot-com bubble, 9/11, and the 2008 global financial crisis.
Q3: What happened to the Korean won during the KOSPI crash? The Korean won fell sharply during the two-day rout, briefly breaching 1,500 per dollar on Wednesday March 4 — a level not seen since March 2009 at the depth of the global financial crisis — before closing around 1,466 per dollar. The Bank of Korea vowed to respond to “herd-like behaviour” in currency markets and signalled readiness for intervention if volatility persisted.
Q4: Will South Korea’s stock market recover from the US-Iran war selloff? The outlook depends heavily on the duration of the conflict and whether the Strait of Hormuz reopens to normal commercial shipping. Most Seoul-based analysts see two primary scenarios: a quick resolution (within four to five weeks) that triggers a sharp technical rebound toward 5,500–5,800 on the KOSPI, or a prolonged stalemate that sees the index finding a floor near 4,800–5,000 as earnings are revised downward. The structural bull case — driven by AI memory chip demand and corporate governance improvements — has not been invalidated, but the energy-price risk premium has risen substantially.
Discover more from The Economy
Subscribe to get the latest posts sent to your email.


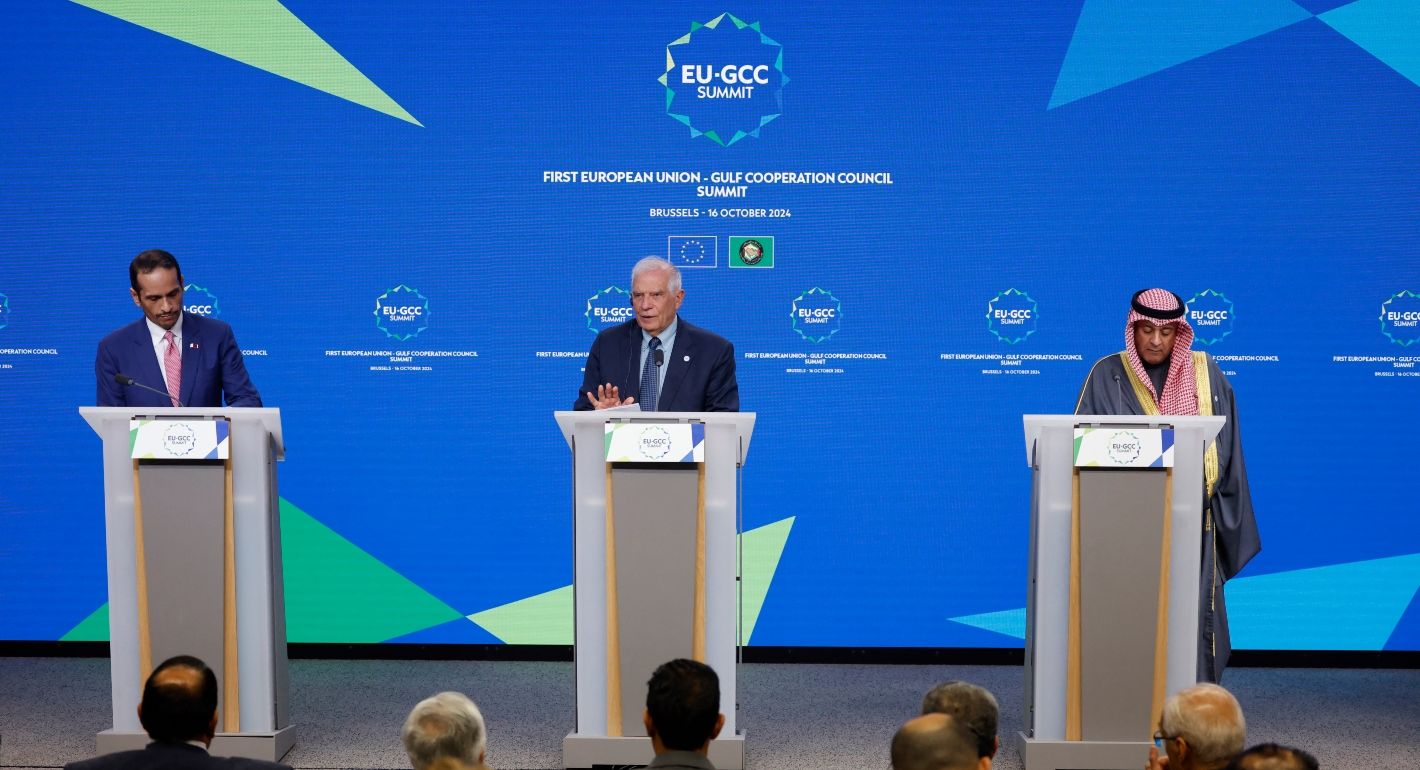
Gulf investors pulled over $1 billion from Pakistan’s bonds and equities in FY26. Here’s why the Gulf peace deal matters more than headlines suggest.
Pakistan’s economic commentary this year has largely stayed domestic — inflation, IMF reviews, remittances. The more revealing story sits in the balance-of-payments data: Gulf capital, historically one of Pakistan’s most reliable sources of portfolio investment, has gone into reverse at precisely the moment Islamabad is leaning on its Gulf relationships diplomatically.
The numbers
State Bank of Pakistan data show that from July 1, 2025 to June 19, 2026, equity market inflows totalled just $308 million while outflows exceeded $1 billion. Foreign direct investment declined by 28% over the first 11 months of FY26, domestic bonds saw a net outflow of $550 million, and total bond outflows for the year topped $2 billion. Pakistan’s external financing needs are steep: the country must pay over $26 billion in 2026–27, against an $35 billion trade deficit in the first 11 months of FY26.
Between July 2025 and June 2026, foreign outflows from Pakistan’s domestic bonds exceeded $2 billion, while equity market outflows topped $1 billion against just $308 million in inflows. Gulf states have been net sellers, with Bahrain withdrawing $30 million from Pakistani bonds in early FY27 alone, as the US-Israeli war with Iran raised regional risk premiums.
The pattern has continued into the new fiscal year. In the first ten days of FY27, Bahrain withdrew $30 million from Pakistan’s domestic bonds — $21 million from treasury bills and $9 million from Pakistan Investment Bonds — with no Gulf country recording any inflow during the period. Luxembourg was the only recorded foreign buyer, investing $4 million.
Why the peace deal matters disproportionately to Pakistan
Analysts quoted in Pakistani financial press note that Pakistan is not a party to the Gulf war but is now part of the peace framework, which raises the stakes for Islamabad if the deal collapses. Remittances from Gulf countries have so far held up, but bankers warn a prolonged conflict could eventually disrupt what remains the country’s largest source of foreign exchange, alongside stagnant exports and growth capped below 4%.
This sits against a wider regional backdrop: a new UNCTAD World Investment Report finds Gulf outbound investment grew through 2025, but warns that a prolonged conflict could redirect Gulf capital toward domestic reconstruction and strategic infrastructure, reducing the pool available for developing economies in Asia and Africa that increasingly depend on GCC financing — a dynamic that directly implicates Pakistan’s financing model.
The underserved angle
Most Pakistani business coverage frames this as an IMF-and-remittances story. The more precise framing is a capital-substitution risk: Pakistan has structurally relied on Gulf sovereign and institutional capital to plug its external financing gap, and that capital source is now competing for the same money regional reconstruction and Gulf domestic strategic infrastructure would need in a prolonged-conflict scenario. There is a live, underreported counter-current too — SBP data show net FDI actually rose from $54.46 million in April 2026 to $214.29 million in May, suggesting the bond-market flight and the FDI picture are not moving in lockstep.
Discover more from The Economy
Subscribe to get the latest posts sent to your email.
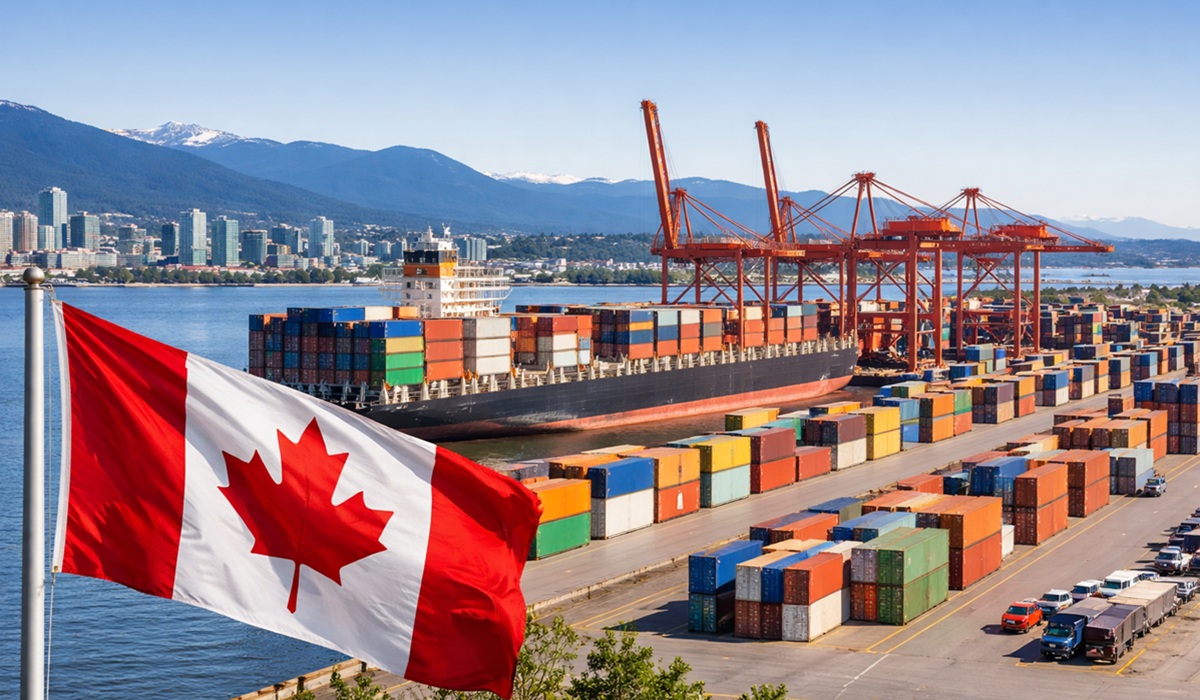
As US tariffs strain CUSMA, Canada is striking deals with China, Indonesia and the UAE. Here’s how Ottawa’s pivot away from the US is actually unfolding.
Every Canadian trade story in 2026 tends to lead with the same character: Washington. But the more consequential story may be what Ottawa is doing everywhere else. Facing sustained US tariff pressure and uncertainty over the CUSMA review, the Carney government has initiated a strategy to diversify Canada’s international trade, with a specific target of doubling exports to non-US markets by 2035.
Canada’s trade diversification strategy aims to double exports to non-US markets by 2035. In 2025–26 it produced a stabilisation deal with China on EVs and canola, a new trade agreement with Indonesia, a Foreign Investment Promotion and Protection Agreement with the UAE, and consultations with India, Thailand and Mercosur.
The deals nobody outside trade-law circles is tracking
Three moves stand out as substantively new rather than aspirational:
- China: during a visit to Beijing, Canada’s prime minister struck a deal establishing a tariff-rate quota for a set number of Chinese EVs — reverting to pre-2024 tariff levels — in exchange for reduced Chinese tariffs on Canadian canola, lobster and peas. This is a live trade-off between EV protectionism and agricultural market access.
- Indonesia: Canada signed a new trade agreement with Indonesia in 2025, opening a Southeast Asian market largely absent from Canadian export strategy until now.
- UAE: Ottawa launched trade-agreement negotiations and signed a new Foreign Investment Promotion and Protection Agreement with the United Arab Emirates, positioning the Gulf as a capital and market-access partner rather than just an energy counterpart.
Meanwhile, exporter confidence has ticked up but remains below its historical average, and diversification remains concentrated in a narrow set of commodities rather than being broad-based.
Why the gravity model is the real obstacle
Trade economists point to the Gravity Model of trade to explain why diversification is structurally hard: the US economy’s size, physical proximity, regulatory similarity and deeply integrated supply chains with Canada make full substitution unrealistic in the near term, even as China and India are flagged as the two most promising long-term markets given they will account for roughly 45% of global economic growth.
The underserved angle
Most coverage treats “Canada diversifying away from the US” as a single narrative. It is actually three distinct, sometimes contradictory tracks: a commodity-for-EV-tariff trade with China, a market-opening play in Southeast Asia via Indonesia, and a capital-and-investment play with the Gulf via the UAE. Each carries different risk profiles — geopolitical risk with China, execution risk with a new Indonesian relationship, and Gulf capital that is itself increasingly redirected toward domestic reconstruction needs amid regional conflict.
Discover more from The Economy
Subscribe to get the latest posts sent to your email.
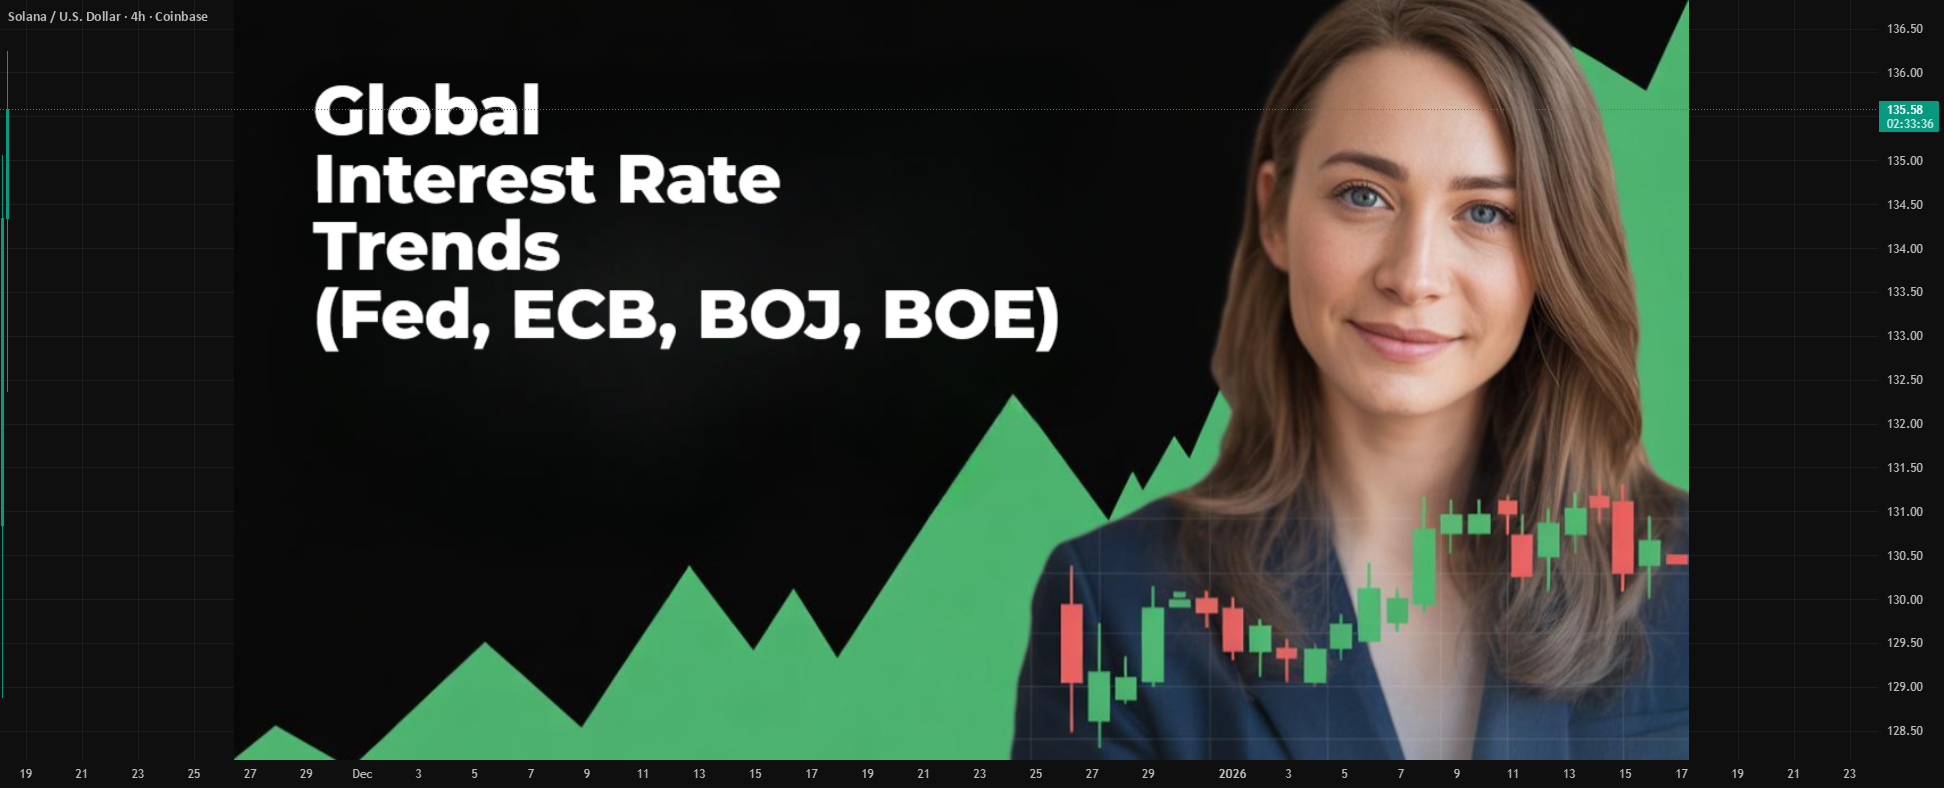
Analysis of how the Federal Reserve, Bank of England and Bank of Japan could reshape global markets, inflation, currencies and economic growth in 2026.
Executive Summary
The world’s most influential central banks are entering one of the most consequential policy weeks of 2026. Investors are watching closely as the U.S. Federal Reserve, the Bank of England, and the Bank of Japan weigh the competing pressures of easing inflation, geopolitical uncertainty, elevated energy prices, and slowing global growth. Financial markets are also preparing for major corporate earnings and fresh GDP data from several advanced economies. �
Financial Times +1
Unlike the synchronized tightening cycle that dominated recent years, policymakers are increasingly responding to country-specific economic conditions. This divergence is expected to influence capital flows, exchange rates, bond yields, and investment decisions across both developed and emerging markets. �
McKinsey & Company +1
A New Monetary Landscape
Global inflation has moderated from its post-pandemic peaks, yet central banks remain cautious. Recent movements in energy markets and ongoing geopolitical tensions continue to threaten price stability, even as labor markets show signs of cooling. �
McKinsey & Company +1
For investors, the question is no longer whether interest rates have peaked, but how long they will remain elevated.
United States: The Federal Reserve Faces a Delicate Balance
Attention is centered on the Federal Reserve, where policymakers are expected to keep rates steady while evaluating the effects of inflation, consumer demand, and accelerating investment in artificial intelligence infrastructure. Markets are also monitoring whether AI-driven capital spending could contribute to future inflationary pressures. �
Investopedia +1
Bond investors remain sensitive to any shift in the Fed’s language, as Treasury yields continue to reflect expectations about future policy and inflation risks. �
MarketWatch
United Kingdom: Stability Before Growth
The Bank of England is expected to maintain a cautious stance amid moderating wage growth and relatively stable unemployment. However, policymakers continue to weigh external risks, including energy market volatility and global geopolitical developments. �
Financial Times
Businesses remain particularly attentive to borrowing costs, which continue to influence investment decisions across the UK economy.
Japan Ends an Era of Ultra-Loose Money
Japan is undergoing one of its most significant monetary transitions in decades. Rising wages and gradually strengthening inflation have encouraged the Bank of Japan to continue moving away from the ultra-accommodative policies that defined much of the past generation. �
Financial Times
This normalization has implications far beyond Japan, affecting global capital markets and currency dynamics.
Why Emerging Markets Are Watching Closely
Emerging economies including Pakistan, Indonesia, Malaysia, and others remain particularly exposed to decisions made by advanced economy central banks.
Higher U.S. interest rates typically strengthen the dollar, increase external financing costs, and place pressure on countries with significant foreign currency debt.
Conversely, a more stable interest rate environment could improve capital flows into emerging markets while easing exchange rate volatility.
AI Is Becoming a Monetary Policy Variable
One of the most important structural developments in 2026 is the rapid expansion of artificial intelligence infrastructure.
Major technology companies continue investing heavily in data centers, semiconductors, cloud computing, and digital infrastructure. These investments are supporting economic growth but are also creating new questions about inflation, productivity, and long-term financing needs. �
Investopedia +1
Investment Implications
Several themes are emerging:
Higher-for-longer interest rates remain possible.
Government bond markets are likely to remain volatile.
The U.S. dollar could remain relatively strong.
AI-related investment continues attracting capital.
Emerging markets may benefit if inflation continues to moderate.
Competitor Keyword Gap Analysis
Leading publications such as the Financial Times, Reuters, Bloomberg, and CNBC primarily emphasize immediate policy decisions. An opportunity exists to capture additional search traffic by targeting broader intent-based queries.
Key Takeaways
Central bank decisions this week are expected to shape global financial markets.
AI investment is becoming an increasingly important economic driver.
Bond markets remain sensitive to inflation expectations.
Emerging economies face both risks and opportunities from policy divergence.
Investors should monitor GDP releases, corporate earnings, and inflation indicators alongside interest rate announcements.
Frequently Asked Questions
Why are central bank meetings so important?
They influence borrowing costs, inflation expectations, currency values, and investment decisions worldwide.
How do interest rates affect stock markets?
Higher rates generally increase financing costs and can reduce company valuations, while lower rates often support economic activity and equity markets.
Why is AI influencing monetary policy discussions?
Large-scale investment in AI infrastructure is reshaping productivity, corporate spending, and long-term inflation expectations.
Discover more from The Economy
Subscribe to get the latest posts sent to your email.

Pakistan Gulf Investment Outflows 2026: Peace Deal Stakes Explained

Canada Trade Diversification 2026: China, Indonesia, UAE Deals Explained

US Forced-Labour Tariffs on 60 Countries: The Hidden Trade Shock of 2026

Global Central Banks 2026: Fed, BoE and BoJ Decisions Could Reshape Markets

Gulf Capital Retreat From Pakistan 2026: UAE Loan Freeze & What It Means

Pakistan’s Most Reliable Export Is Its People: Remittances Hit $41.6 Billion, Overtaking Total Exports

Indonesia’s Confidence Problem: Record Investment, a Sinking Rupiah, and a Widening Credibility Gap

Down But Not Out: Inside the Slow Sinking of Russia’s War Economy

China’s Growth Slips to a Four-Year Low: Why Beijing Still Won’t Pull the Stimulus Trigger

The Johor-Singapore Corridor: How Malaysia Became Southeast Asia’s AI Infrastructure Powerhouse

Canada’s Economy ‘On Pause’: Inside the CUSMA Deadline That Passed Without a Deal

Dubai’s Millionaire Magnet: How the UAE Turned Middle East Turmoil Into a Capital Safe-Haven Boom

Britain’s Sixth Prime Minister in a Decade: What Starmer’s Exit Means for Gilts, Sterling and Your Portfolio

Anthropic Offers Up to $600,000 Salary for Critical IPO Role as AI Giant Prepares for Wall Street Debut

Carry Trade Unwind 2026: How the Yen’s Snapback Triggered a Global Margin Call

AI Bubble Warning 2026: Why BIS, IMF and Bank of England Fear a Market Crash

BRICS De‑Dollarization Strategy Takes Shape with $15 Billion Local‑Currency Push

The AI Super Bubble Is Ready to Burst

Russia Bans Diesel Exports 2026: Global Fuel Market Impact Explained

Strait of Hormuz Blockade 2026: Oil Prices Surge 9% as US-Iran Conflict Reignites

Private Credit Warning: Most BDCs Turn Unprofitable in 2026, Reuters Finds

IMF Cuts Pakistan Growth Forecast, Raises Inflation to 8.4%

Bitcoin $150k Milestone Achieved as US Sovereign Crypto Pivot Looms
Gulf Capital Retreat From Pakistan 2026: UAE Loan Freeze & What It Means

India Economic Rise 2026: How the Subcontinent Toppled Japan

Strait of Hormuz 2026: Why Markets Still Don’t Trust It’s Open

China Housing Market Turnaround: White‑List Model Stabilises Prices

Chipmakers Just Lost 6.7% in Two Days: Inside the Great AI Trade Rotation
-

 Markets & Finance7 months ago
Top 15 Stocks for Investment in 2026 in PSX: Your Complete Guide to Pakistan’s Best Investment Opportunities
-

 Analysis5 months ago
Johor’s Investment Boom: The Hidden Costs Behind Malaysia’s Most Ambitious Economic Surge
-

 Analysis5 months ago
Top 10 Stocks for Investment in PSX for Quick Returns in 2026
-

 Analysis6 months ago
Brazil’s Rare Earth Race: US, EU, and China Compete for Critical Minerals as Tensions Rise
-

 Banks6 months ago
Best Investments in Pakistan 2026: Top 10 Low-Price Shares and Long-Term Picks for the PSX
-

 Investment7 months ago
Top 10 Mutual Fund Managers in Pakistan for Investment in 2026: A Comprehensive Guide for Optimal Returns
-

 Global Economy7 months ago
15 Most Lucrative Sectors for Investment in Pakistan: A 2025 Data-Driven Analysis
-

 Global Economy7 months ago
Pakistan’s Export Goldmine: 10 Game-Changing Markets Where Pakistani Businesses Are Winning Big in 2025