
Analysis
Oil Prices Surge 10% Amid Iran Conflict: Could Brent Hit $100 as Strait of Hormuz Closure Looms?
Analysts warn of escalating geopolitical risks driving energy markets into turmoil, with key chokepoint disruptions threatening global supply chains and stoking inflation fears worldwide.
The oil market woke to a seismic jolt this weekend. Within hours of U.S. and Israeli strikes on Iranian military infrastructure, Brent crude surged roughly 10% to approximately $80 a barrel in over-the-counter trading on Sunday — a visceral reminder that in the modern energy economy, geopolitical shockwaves travel faster than any tanker on the high seas. For energy analysts who had spent weeks tracking the slow build of military tension in the Middle East, the price spike was not a surprise. What concerns them far more is what could come next.
“While the military attacks are themselves supportive for oil prices, the key factor here is the closing of the Strait of Hormuz,” said Ajay Parmar, director of energy and refining at ICIS. That single sentence captures the existential anxiety now gripping global energy markets. The Strait of Hormuz — the narrow waterway separating Iran from the Arabian Peninsula — is the single most consequential chokepoint in the world’s oil supply chain, and the possibility of its closure has transformed a market event into a potential global economic crisis.
Real-Time Market Reaction: A Benchmark in Motion
Brent crude had already been climbing before the strikes landed. The global benchmark reached $73 a barrel on Friday — its highest level since July — as traders priced in a growing probability of military confrontation. When futures markets reopen Monday, analysts broadly expect the rally to hold and potentially accelerate.
West Texas Intermediate (WTI), the U.S. benchmark, was trading near $67 a barrel ahead of the weekend, reflecting slightly softer domestic demand signals but tracking the broader geopolitical premium being baked into global crude. The spread between Brent and WTI has widened as Middle Eastern supply-route risk commands a higher premium in internationally traded barrels.
Adding complexity to the supply picture, OPEC+ had only recently agreed to modest output increases of approximately 206,000 barrels per day as part of its phased unwinding of voluntary cuts — a move designed to recapture market share in a period of relative stability. That calculus has now changed overnight. With Iranian production — currently running at roughly 3.2 million barrels per day — suddenly under threat of disruption, and with the group’s Gulf members facing their own strategic calculations, OPEC+’s next emergency meeting could prove pivotal.
| Indicator | Pre-Strike (Friday) | Post-Strike (Sunday OTC) |
|---|---|---|
| Brent Crude | ~$73/bbl | ~$80/bbl |
| WTI | ~$67/bbl | Est. $73–75/bbl |
| Projected Range (90-day) | $73–$78 | $85–$100+ |
| OPEC+ Planned Output Hike | +206,000 bpd | Under review |
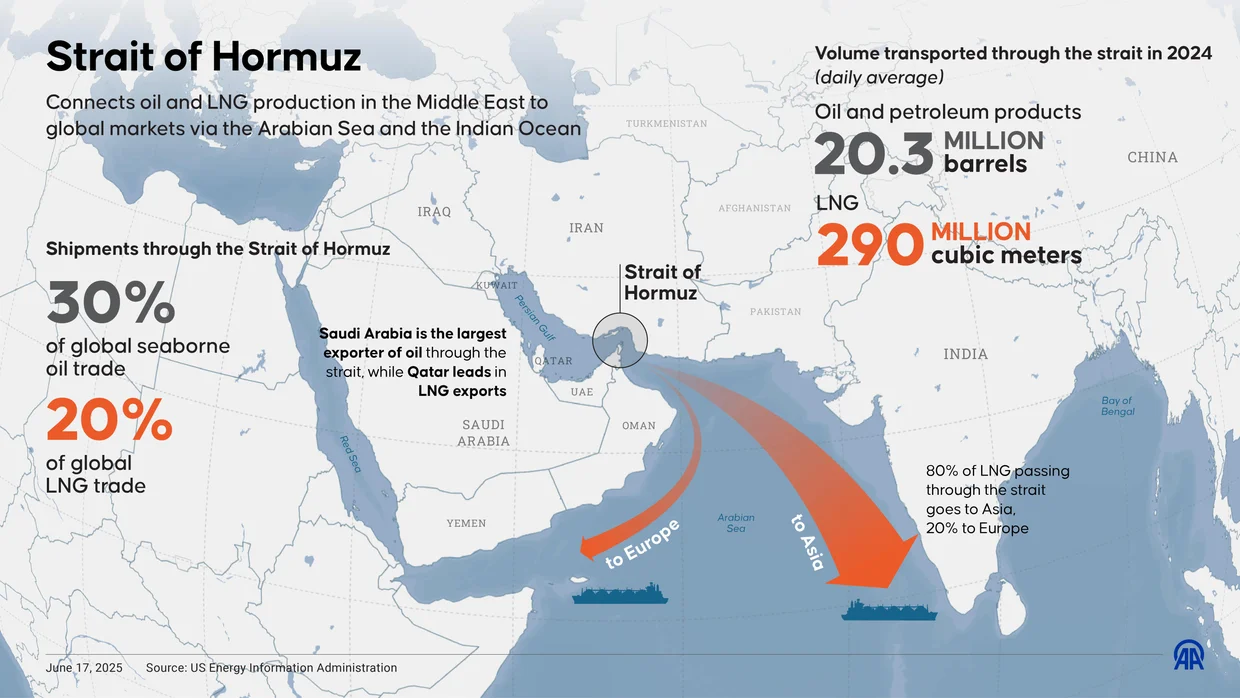
The Chokepoint That Could Change Everything
To understand why analysts are invoking $100 oil, one must understand the Strait of Hormuz’s unique position in global energy architecture. According to the U.S. Energy Information Administration, approximately 20 to 21 million barrels of oil pass through the strait daily — representing somewhere between 20% and 30% of all seaborne oil trade globally. Liquefied natural gas flows add another layer of vulnerability: roughly 20% of the world’s LNG supply also transits the strait, with major importers in Asia — Japan, South Korea, China, and India — critically exposed.
Iran has threatened on multiple occasions to close the Strait of Hormuz in response to military pressure. While analysts have historically viewed such threats as largely rhetorical, the current escalation — involving direct U.S. and Israeli strikes on Iranian soil — represents a qualitatively different provocation. Tehran’s calculus on retaliation has shifted. “The risk of even a partial disruption to Hormuz flows is now being priced in ways we haven’t seen since 2019,” one senior energy trader told Bloomberg over the weekend.
Iran possesses a range of asymmetric tools short of an outright blockade: mine-laying, attacks on tanker traffic, and harassment of vessels using its naval assets and proxy forces throughout the region. Any of these actions would trigger insurance market seizures, rerouting costs, and supply delays severe enough to rattle prices without a single barrel being physically withheld.
What Analysts Are Forecasting
The forecasting community has moved rapidly to revise upward its price targets in the wake of Sunday’s developments. The divergence between bull and base cases is wide — reflecting genuine uncertainty about Iran’s response and the duration of any disruption.
Helima Croft, head of global commodity strategy at RBC Capital Markets and one of the most closely watched voices in geopolitical energy analysis, has long warned that Middle East risk was being systematically underpriced by markets. In recent notes, RBC analysts flagged the $90–$95 range as achievable under a moderate disruption scenario, with $100 possible if Hormuz flows are materially curtailed.
Goldman Sachs, whose commodity desk has been tracking the Iran-Israel tension since late 2024, has outlined scenarios in which sustained supply disruption pushes Brent to $95–$100 by Q2 2026 — contingent on whether OPEC+ Gulf members, particularly Saudi Arabia and the UAE, step in with compensatory output.
Rystad Energy’s Jorge León, vice president of oil market research, has previously estimated that a full Strait of Hormuz closure lasting 30 days could remove 15–17 million barrels of daily supply from the market — a shock that dwarfs anything seen since the 1973 Arab oil embargo. Even a partial, weeks-long disruption affecting 30–40% of normal flows could push prices into triple digits.
Capital Economics has taken a more measured line, arguing that OPEC+ spare capacity — estimated at roughly 5–6 million bpd, predominantly held by Saudi Arabia — provides a meaningful buffer. However, their analysts acknowledge that tapping that capacity while simultaneously managing alliance cohesion and navigating U.S. pressure will require careful political choreography.
Global Economic Fallout: From Petrol Pumps to Supply Chains
The consequences of an oil price spike to $100 would reverberate well beyond energy trading floors. Consumer inflation, which central banks in the U.S., EU, and UK have spent two years painstakingly subduing, would face a significant new headwind. Energy costs feed into virtually every sector of the global economy — from petrochemicals and plastics to food production, shipping, and manufacturing.
In the United States, a sustained move to $100 Brent would likely push gasoline prices back above $4 per gallon nationally — a politically toxic level that the Biden and Trump administrations alike have treated as a red line. In Europe, still navigating energy price volatility following the Russia-Ukraine conflict, the impact on household energy bills and industrial competitiveness could be severe.
Emerging market economies face a particularly acute risk. Countries in South and Southeast Asia that import large shares of their energy needs — India, Pakistan, Indonesia, the Philippines — would see their current account deficits worsen sharply, currency pressures intensify, and inflationary spirals become harder to contain. For the world’s most financially vulnerable nations, a prolonged oil shock could tip fragile fiscal positions into crisis.
Global shipping and supply chain disruption extends beyond oil. The Strait of Hormuz is also critical for dry bulk cargo, container traffic, and chemical shipments. Rerouting vessels around the Cape of Good Hope adds weeks to transit times and thousands of dollars per voyage in fuel and operating costs — a friction that cascades through global trade.
Historical Context and the Limits of Alternatives
This is not the first time the world has stared down a Hormuz closure scenario. During the 1980–1988 Iran-Iraq War — the so-called “Tanker War” — over 400 ships were attacked in the Gulf, yet full closure was never achieved, partly because Iran and Iraq both needed oil revenues to fund their war efforts. Tehran today faces a different strategic calculus.
Two pipeline alternatives exist that partially mitigate Hormuz risk. Saudi Arabia’s East-West Pipeline can transport up to approximately 5 million bpd from the Eastern Province to the Red Sea port of Yanbu, bypassing the strait entirely. The UAE’s Abu Dhabi Crude Oil Pipeline can move around 1.5 million bpd to the port of Fujairah on the Gulf of Oman. Together, these routes could offset perhaps 6–7 million bpd — significant, but far short of the 20+ million that currently flows through Hormuz daily.
Conclusion: Between De-Escalation and a Prolonged Crisis
The next 72 hours are likely to be defining. Iran’s formal response to the U.S.-Israeli strikes — whether diplomatic signaling, proportional military retaliation, or an asymmetric escalation campaign targeting Gulf shipping — will determine whether the current oil spike is a spike or the beginning of a sustained re-pricing of global energy risk.
Markets are, at this moment, pricing probability rather than certainty. The $80 Brent level reflects elevated fear; $100 reflects a world in which Hormuz flows are genuinely, materially disrupted. Between those two numbers lies an enormous range of human, diplomatic, and military contingency.
What is not contingent is the underlying vulnerability the current crisis has exposed: a global energy system that, despite years of diversification rhetoric, remains structurally dependent on a waterway 33 kilometers wide at its narrowest point. As Ajay Parmar’s warning makes clear, the military strikes may have lit the match — but the Strait of Hormuz is the powder keg that the world’s economies cannot afford to see ignite.
Discover more from The Economy
Subscribe to get the latest posts sent to your email.


The industrial parks of southern Germany are rarely the backdrop for Silicon Valley-style capital frenzies. Yet inside a sprawling facility near Stuttgart, a quiet revolution in synthetic labor has just secured an unprecedented war chest. Neura, a four-year-old cognitive robotics venture, has shattered European deep-tech records by closing a $1.4 billion Series C funding round. The mandate is brutally simple: build, scale, and deploy autonomous humanoid robots before American or Chinese rivals permanently corner the market. This isn’t just another hardware iteration. It is a high-stakes, nation-state-level gamble on the future of the physical economy.
The continent’s manufacturing engine is stalling. Across Europe, an aging workforce and chronically low birth rates have created a structural labor deficit that temporary immigration policies have failed to plug. The World Bank tracks a steep, continuous decline in the working-age population across advanced economies, a trend hitting the German industrial heartland particularly hard.
For years, the proposed solution was software automation. That calculus has shifted entirely. We are moving from digitising back-office workflows to automating physical space. Capital markets are reacting accordingly. Over the past twelve months, investors have poured billions into companies like Figure AI and 1X, seeking the holy grail of automation: a general-purpose machine capable of operating in environments designed for humans. What makes this particular transaction stand out is the geography. Europe has historically lost the digital platform wars. With this massive injection of capital, the continent’s industrial base is fighting back on the hardware front.
The Scale of the Capital Injection
The sheer scale of the Neura humanoid robot funding signals a decisive shift in how European institutional investors view capital-intensive deep tech. Historically, European founders have hit a funding wall at the growth stage, forcing them to cross the Atlantic for nine-figure checks. This $1.4 billion round, reportedly oversubscribed within three weeks, rewrites that narrative. It drew heavy participation from a consortium of state-backed entities, sovereign wealth, and the venture arms of German automotive titans desperate to future-proof their assembly lines. As Bloomberg’s technology desk reported, the syndicate structure reflects a coordinated industrial strategy rather than a standard venture capital play.
At the center of this capital vortex is Neura’s flagship humanoid prototype. Unlike traditional industrial robots that operate blindly behind heavy steel cages, executing rigid, pre-programmed routines, Neura’s architecture is fundamentally cognitive. The machines are equipped with advanced spatial computing, tactile feedback sensors, and onboard neural networks that allow them to “see” and interpret unstructured environments. If a human worker leaves a tool in the wrong place, a traditional robotic arm will crash into it. A Neura unit will identify the anomaly, pick up the tool, and adjust its trajectory in real-time.
This capability requires staggering computational power and hardware sophistication. A single unit contains dozens of high-torque, custom-designed actuators, mimicking the complexity of human musculature. Developing these components in-house, rather than relying on brittle off-the-shelf parts, burns cash at an extraordinary rate. The $1.4 billion will primarily fund the transition from prototype to mass production, establishing a dedicated manufacturing facility capable of producing tens of thousands of units annually by the end of the decade. Securing the supply chain for rare earth metals, custom silicon, and precision-milled joints represents the bulk of this capital expenditure.
The Shift to Synthetic Labor Economics
Why are investors funding humanoid robots? Investors are pouring capital into humanoid robots to solve chronic labor shortages in manufacturing and logistics. Unlike single-purpose machines, AI-driven humanoids can adapt to varied tasks, operating safely alongside human workers while drastically reducing long-term operational costs.
The analytical framework for understanding this European cognitive robotics push requires looking past the hardware itself. The real breakthrough driving these valuations is software—specifically, the application of large language models and vision-language-action (VLA) models to physical space. For decades, roboticists struggled with Moravec’s paradox: high-level reasoning requires very little computation, but low-level sensorimotor skills require enormous computational resources. Teaching a computer to play grandmaster-level chess was achieved in the 1990s. Teaching a robot to fold a shirt or walk up a flight of stairs has taken thirty more years.
That bottleneck has suddenly cracked. By feeding millions of hours of human motion data into advanced neural networks, engineers are now training robots end-to-end. Instead of writing millions of lines of code to dictate exactly how a mechanical hand should grip a fragile object, the AI infers the correct pressure and angle through trial and error in simulated environments, transferring that learning to the physical world. This is the iPhone moment for industrial automation.
The unit economics of this transition are compelling to the point of inevitability. A human worker on a German assembly line costs upwards of €35 an hour, factoring in wages, benefits, and insurance. They work eight-hour shifts, require breaks, and are prone to fatigue-induced errors. An industrial automation investment of this scale targets a future where a generalized robot, amortized over a five-year lifespan, operates at an effective cost of $10 to $15 an hour. It works constantly, in the dark, without heating or air conditioning. According to the Bank for International Settlements, the widespread adoption of AI-driven physical automation could trigger a massive deflationary wave in manufactured goods, permanently altering global trade balances.
Rebuilding the Industrial Base
The downstream consequences of deploying general-purpose AI machines across Europe will reshape the global supply chain. For the past forty years, Western companies chased cheap labor by offshoring production to Southeast Asia. That arbitrage opportunity is closing as wages in developing nations rise and geopolitical tensions threaten trans-Pacific shipping routes. Humanoid robots offer a different kind of arbitrage: the ability to nearshore manufacturing without incurring the catastrophic labor costs that typically doom domestic production.
Germany’s famed Mittelstand—the thousands of highly specialized, mid-sized manufacturing firms that form the backbone of Europe’s largest economy—stands to be the primary beneficiary. These companies produce high-margin components but often lack the capital to build fully automated, custom-designed production lines from scratch. A humanoid robot solves this seamlessly. Because humanoids are built to operate in environments designed for humans, they can be dropped onto an existing factory floor without requiring a multimillion-dollar structural redesign. They use the same tools, walk the same aisles, and reach the same shelves as their biological counterparts.
This flexibility is essential for supply chain resilience. During a product changeover, a traditional automated factory might sit idle for weeks while engineers physically retool the machinery. A cognitive robot simply downloads a new software update and begins the new task the next morning. The Economist Intelligence Unit projects that economies leading the deployment of flexible synthetic labor will command a structural export advantage well into the 2040s.
Policymakers in Brussels are watching this space acutely. The European Union has positioned itself as the world’s premier technology regulator, recently passing the sweeping AI Act. Yet the geopolitical reality of the robotics race may force a lighter regulatory touch. If Europe hamstrings its native champions with preemptive legislation, American firms backed by endless Silicon Valley capital will inevitably flood the European market with their own synthetic workers. The $1.4 billion backing Neura is a clear signal that European capital intends to retain sovereignty over the physical layer of its economy.
The Friction of the Physical World
The picture is more complicated than the triumphant press releases suggest. Building a sophisticated AI model on a server farm is an exercise in pure mathematics. Building a robot that operates in the chaotic, unforgiving physical world is a nightmare of physics, material science, and thermodynamics. Dissenting voices within the engineering community point out that capital cannot suspend the laws of physics.
The primary constraint is power density. The human body is an incredibly efficient machine, running on roughly 100 watts of power—equivalent to a standard incandescent light bulb. Replicating that efficiency with lithium-ion batteries and electric motors remains an unsolved engineering challenge. Current humanoid prototypes struggle to operate for more than three or four hours before requiring a recharge. In a factory environment where uptime is the ultimate metric, a robot that spends a quarter of its shift tethered to a wall socket destroys the underlying unit economics.
Furthermore, edge cases in the physical world are infinite and dangerous. A hallucinating software model generates a strange paragraph of text. A hallucinating 80-kilogram industrial robot moving at high speed can maim or kill a factory worker. A recent analysis in the Financial Times noted that the gap between a highly edited demonstration video and consistent, safe operation in a bustling logistics hub is vast. Previous hardware startups have burned through billions of dollars trying to cross that exact chasm, only to declare bankruptcy when the mechanical reality failed to match the software hype.
Still, betting against the trajectory of compute and engineering has historically been a losing proposition. The rapid commoditisation of sensors, driven by the smartphone and autonomous vehicle industries, has drastically lowered the bill of materials for roboticists. While early deployments will undoubtedly be clumsy, restricted to highly structured tasks like moving boxes in a warehouse, the software governing these machines improves exponentially with every hour of real-world data collected.
What follows, however, is a fundamental restructuring of the social contract. We have engineered our societies around the assumption that human labor is the indispensable input for economic output. The rise of companies like Neura challenges that premise directly. The race playing out between Stuttgart, Silicon Valley, and Shenzhen is no longer about proving the technology works in a laboratory. It is a race to claim ownership of the new means of physical production. Capital has made its choice; the human workforce must now prepare for the arrival of its synthetic peers.
Discover more from The Economy
Subscribe to get the latest posts sent to your email.

For a century, the rhythm of the American economy was dictated by the turning of coal turbines. That rhythm just broke. Over a sweltering stretch this year, the United States grid drew more of its power from the sun than from the combustible black rock that built the industrial age. It is a quiet threshold, crossed not with a ribbon-cutting ceremony but with a steady, silent surge of electrons flowing across transmission lines from the Mojave Desert to the Texas panhandle. The transition happened faster than almost anyone predicted, upending decades of conventional wisdom about the physical limits of renewable generation.
This inversion has been a decade in the making, but the velocity of the final convergence surprised even seasoned energy analysts. Just 15 years ago, coal generated nearly half of all American electricity. Today, it struggles to maintain a 15 percent share across the national grid. The collapse was initially driven by cheap hydraulic fracturing, which flooded the wholesale market with natural gas. But the ultimate death blow is increasingly structural. It is driven by a deluge of tax equities unleashed by the Inflation Reduction Act, coupled with a precipitous drop in global photovoltaic manufacturing costs.
According to the US Energy Information Administration (EIA), utility-scale solar capacity expanded by a staggering 36 gigawatts last year alone, fundamentally rewriting the economics of American baseload power. The global capital markets have acted as the great accelerant here. Investors are no longer waiting for legislative mandates; they are pricing in the physical risks of climate change and the inevitability of carbon pricing, driving a massive reallocation of portfolio weighting away from thermal coal extraction. The cost of capital for new coal projects has effectively reached infinity, while renewable portfolios continue to attract over $100 billion in institutional capital despite a high interest rate environment.
The Tipping Point: How US Solar Energy Surpasses Coal
When US solar energy surpasses coal on a monthly generation basis, it serves as a brutal, unyielding verdict from the bond market as much as a triumph of engineering. The data reveals a stark trajectory. During the lengthening days of late spring and early summer, the combined output of utility-scale solar farms and millions of distributed rooftop panels eclipsed coal-fired generation for the first time in American history. This wasn’t a momentary blip caused by an offline thermal plant; it was a sustained structural victory.
To understand the sheer scale of this displacement, look at the physical transformation of the landscape. On May 8, a record-breaking 31.4 percent of the electricity on the Texas ERCOT grid—the very belly of the American fossil fuel beast—was generated by solar power. Texas alone added more solar capacity in the last 24 months than the entire country of France possesses in total. The speed of deployment is staggering. Solar developers are currently installing roughly one megawatt of new capacity every 10 minutes across the United States.
The Inflation Reduction Act fundamentally altered the capital stack for renewable developers. By allowing companies to choose between the Investment Tax Credit (ITC) for upfront capital expenditure or the Production Tax Credit (PTC) for ongoing generation, federal policy de-risked the two largest hurdles in infrastructure deployment. Consequently, the development pipeline swelled. Wall Street’s tax equity markets—the complex financial mechanisms used to monetize these federal credits—are currently processing over $20 billion in solar transactions annually.
Corporate power purchase agreements have injected further massive liquidity into the sector. Tech giants desperate to power their ballooning artificial intelligence data centers are underwriting massive solar installations. On July 12, Microsoft finalized an agreement for 500 megawatts of solar capacity, a transaction that effectively guarantees the retirement of an equivalent amount of fossil generation.
Data compiled by Bloomberg New Energy Finance indicates that the levelized cost of electricity from new solar projects now sits comfortably below the marginal operating cost of existing, fully depreciated coal plants.
This is the financial tipping point.
A utility executive looking at a spreadsheet no longer needs an ideological reason to retire a coal facility; keeping it open is simply fiduciary negligence. The coal fleet is old, tired, and increasingly expensive to maintain. The average American coal plant is over 45 years old, requiring constant capital expenditure just to remain compliant with federal emissions standards. The milestone of out-generating coal is merely the most visible symptom of a total system rewiring, one where capital violently deserts legacy assets in favor of zero-marginal-cost generation.
Structural Realignment in the US Electricity Generation Mix
The broader US electricity generation mix is undergoing a permanent, irreversible realignment. To grasp why this matters, one must look past the headline capacity figures and examine the underlying mechanics of wholesale electricity markets. Power grids operate on a strict merit order: grid operators dispatch the cheapest available electricity first, moving up the cost curve only as demand rises. Because sunlight is free, solar bids into the market at zero—and sometimes negative—marginal cost.
Why is coal declining in the US? Coal is collapsing because it can no longer compete on marginal cost. Once a solar farm is built, the fuel is free, allowing solar operators to bid power into wholesale markets at near-zero prices. Coal plants, burdened by continuous mining, transport, and environmental compliance costs, simply cannot match these economics.
This dynamic systematically destroys the profitability of legacy fossil generators. Historically, coal plants operated as baseload power, running continuously day and night to guarantee a steady revenue stream that covered their massive fixed costs. Today, the midday surge of solar generation violently depresses wholesale power prices precisely when demand is highest. Coal operators are forced to either cycle their massive, inflexible thermal plants up and down—which damages the physical machinery—or pay the grid to take their power during peak solar hours. Neither option is financially sustainable.
The physical topography of the American grid exacerbates these pricing dynamics. The United States does not possess a single, unified electrical system; it operates three largely independent networks—the Eastern Interconnection, the Western Interconnection, and the Texas grid. Power cannot easily flow between these massive regional silos. Therefore, when California produces a massive surplus of midday solar, it cannot sell those zero-cost electrons to grid operators in Ohio or Pennsylvania. The localized oversupply violently depresses regional pricing, forcing local coal units to either absorb steep financial losses or shut down entirely.
Consequently, the capacity factor of the American coal fleet—the percentage of its maximum potential output that it actually generates—has plummeted. A plant built to run 85 percent of the time is now lucky to operate at 40 percent. This creates a financial death spiral. Fixed costs must be spread over fewer megawatt-hours, making the plant’s electricity even more expensive and less competitive the following year.
What follows, however, is a mutation of the grid architecture itself. The legendary “duck curve” of California—where daytime net demand drops to near zero before spiking violently at sunset—is no longer a localized phenomenon. It has migrated to Texas, to the Midwest, and up the Eastern Seaboard. Grid operators are no longer solving for mere total capacity; they are solving for flexibility. The premium is no longer placed on a spinning mass of steel that runs all day, but on resources that can ramp up instantly when the sun dips below the horizon.
Downstream Shockwaves and Grid Capacity Expansion
The downstream consequences of this inversion ripple outward, altering everything from local tax bases in Appalachia to global copper demand. For policymakers, the immediate challenge is managing the economic fallout in communities that have mined and burned coal for a century. When a 1,000-megawatt thermal plant shutters, it takes hundreds of high-paying, unionized jobs with it, devastating the municipal budgets of surrounding counties.
The energy transition is not a frictionless macroeconomic adjustment; it is a profound geographic disruption.
Yet, the capital flowing out of coal is creating hyper-growth elsewhere, most notably in grid-scale battery storage. Solar’s greatest liability has always been its temporal mismatch with evening demand. Now, the market is aggressively pricing in a solution. An analysis published by the Financial Times demonstrates that utility-scale battery deployments in the United States grew by an astonishing 90 percent year-over-year. Developers are increasingly co-locating massive lithium-ion battery banks directly adjacent to new solar fields, allowing them to soak up zero-cost midday electrons and discharge them profitably into the evening peak.
This hybridization of solar fundamentally alters its value proposition. It transforms a variable, intermittent resource into something resembling dispatchable firm power. In places like California’s CAISO market, batteries are now regularly the largest single source of electricity on the grid between seven and nine in the evening. They are stepping into the exact temporal void left by retiring thermal plants.
That said, the bottleneck has now shifted from generation to transmission. The United States desperately needs thousands of miles of high-voltage direct-current lines to move cheap solar power from the sun-drenched Southwest to the demand centers of the Northeast. The interconnection queue—the waiting list for new power projects to plug into the grid—is currently backlogged with over two terawatts of proposed capacity, the vast majority of it solar and storage. Unlocking this backlog is the next great infrastructural imperative.
This shift also limits the future of natural gas. For a decade, gas has positioned itself as the necessary bridge fuel to a renewable future. But as solar and storage costs continue to plummet in tandem, the length of that bridge is rapidly shortening. Forward-looking utility commissions are increasingly rejecting long-term capital recovery plans for proposed natural gas plants, fearing they will become stranded assets long before their 30-year design life concludes. The window for fossil-fueled infrastructure to guarantee a regulated return is rapidly slamming shut.
The Physics of Fragility
Still, the autopsy of the American coal industry might be slightly premature, or at least, the coronation of solar masks a deeply fragile grid. It is dangerous to mistake generation capacity for grid resilience. The physical reality of electricity demands perfect, second-by-second balance between supply and demand, a feat that becomes infinitely more complex when the primary generation source vanishes behind a winter storm front.
Critics correctly point out that the rapid coal power plant retirements leave the system exposed during extreme weather events. The North American Electric Reliability Corporation (NERC) recently warned that vast swathes of the country face an elevated risk of capacity shortfalls during severe winter storms. When polar vortices plunge temperatures into the negative double digits, solar generation frequently drops near zero due to snow cover and shorter days, precisely when heating demand skyrockets.
“You cannot run a modern, industrialized economy on sunshine and lithium-ion batteries alone, at least not with current technology,” notes one prominent grid reliability engineer advising eastern markets. The dispatchable nature of coal—the fact that a pile of physical fuel sits on-site, immune to pipeline freezing or wind lulls—provides a crude but undeniable insurance policy against catastrophic grid failure. While battery storage can bridge a four-hour evening peak, it cannot sustain a multi-day winter freeze.
Until long-duration storage technologies like iron-air batteries or advanced geothermal reach commercial maturity, excising coal and gas entirely from the generation stack invites a systemic fragility that regulators may find politically unacceptable. Regulators in several states are already pushing back, authorizing utilities to keep certain legacy coal units on life support as emergency backup capacity, effectively paying them simply to exist. This reveals a harsh engineering truth: transitioning a grid is not just about building new things; it’s about carefully dismantling the old ones without turning out the lights.
The New Industrial Rhythm
The passing of the torch from coal to solar is not the end of the energy transition; it is merely the end of the beginning. The low-hanging fruit has been plucked. We have proven that we can build massive volumes of cheap, intermittent renewable power and force legacy fossil assets into early retirement. The next phase of this transformation will be drastically harder. It will require rewiring the nation’s archaic transmission network, scaling long-duration storage, and redesigning wholesale market structures to properly value reliability alongside raw generation.
There will undoubtedly be friction, price volatility, and political blowback as the old energy regime fights a desperate rear-guard action to preserve its relevance. The transition will not be linear. But the economic fundamentals are now locked in place, immune to shifting political winds or lobbying efforts in Washington. Coal’s dominance was forged over a century of industrial expansion, but its decline was cemented in less than a decade of technological disruption. The grid of the twentieth century was built on fire, friction, and mass; the grid of the twenty-first will be built on silicon, software, and weather.
Discover more from The Economy
Subscribe to get the latest posts sent to your email.

SoftBank Group dropped as much as 11% in Tokyo on Tuesday before closing down 8.3%, wiping roughly $8 billion off its market value in a single session. The trigger wasn’t earnings or guidance. It was a Bloomberg report, carried by Reuters, that the company’s talks to raise a SoftBank margin loan backed by its OpenAI stake have stalled.
What began as a $10 billion pitch to creditors has shrunk to $6 billion, and even that looks uncertain. For a firm that has bet its balance sheet on artificial intelligence, the market’s reaction was swift and unsentimental.
The fall lands in the middle of a broader technology sell-off, but SoftBank’s pain is specific. Since September 2024, founder Masayoshi Son has committed up to $30 billion to OpenAI, turning the Japanese conglomerate into the ChatGPT maker’s largest financial backer. To fund it, SoftBank secured a $40 billion loan through a bridge facility in March, arranged by JPMorgan Chase, Goldman Sachs, Mizuho, SMBC and MUFG, due in March 2027.
That bridge was always meant to be refinanced. The plan: borrow against the paper gains in OpenAI. With OpenAI’s March funding round valuing it at $852 billion, SoftBank’s 13% stake was marked near $110 billion on paper. Yet private-company collateral is a hard sell when lenders are already nervous about AI valuations and SoftBank’s history of concentrated bets.
1 — The Core Development: From $10 Billion to Stalled Talks
The SoftBank margin loan was pitched as a two-year facility, with an option to extend by one year, using OpenAI shares as collateral. Initial discussions in April targeted $10 billion. By early May, bankers were already telling Bloomberg that creditors balked at valuing an unlisted AI company, and the target was cut to $6 billion.
On June 10, the story broke that those talks have now stalled. SoftBank Group’s talks with potential creditors to raise at least $6 billion from a margin loan backed by its OpenAI stake have stalled, Bloomberg reported, citing people familiar with the matter. Reuters could not independently verify the report, and SoftBank declined to comment.
The market didn’t wait for confirmation. SoftBank shares, ticker 9984 in Tokyo, plummeted more than 11% at one stage in Tokyo, before recovering slightly to close down 8.3%. Seeking Alpha pegged the U.S.-listed ADR drop at 9.7% the same day. Over five trading sessions, the stock has fallen by more than a fifth, stripping SoftBank of its crown as Japan’s most valuable company.
Why the sensitivity? Because the loan isn’t optional. SoftBank is racing to close a $22.5 billion funding commitment to OpenAI by year-end. It has already sold its entire $5.8 billion Nvidia stake and offloaded $4.8 billion of T-Mobile US shares to raise cash. It has slowed Vision Fund dealmaking to a crawl — any deal above $50 million now requires Son’s explicit approval.
The margin loan was the cleanest way to bridge the gap without selling more crown jewels. Without it, SoftBank must choose between more asset sales, a dilutive equity raise, or leaning harder on its Arm Holdings collateral, where it already has $11.5 billion in undrawn capacity.
2 — Why SoftBank’s Margin Loan Concerns Spooked Markets
What is SoftBank’s margin loan for OpenAI?
A margin loan lets an investor borrow against securities it already owns. SoftBank wanted to pledge its private OpenAI shares to banks, receive cash, and use that cash to meet its remaining OpenAI funding promises. Lenders get interest and a claim on the shares if SoftBank defaults. The problem is pricing something that doesn’t trade.
Creditors worry about three things. First, valuation volatility. OpenAI was marked at $300 billion in April when SoftBank struck its deal. By late 2025, Reuters sources said Amazon was in talks to invest at close to $900 billion. That’s a threefold swing in months, not years.
Second, liquidity. If SoftBank couldn’t repay, banks would own a slice of a private company with no public market. Selling it quickly would mean a steep discount.
Third, concentration. SoftBank already has $40 billion in bridge debt maturing in March 2027. Adding another $6-10 billion secured by the same underlying asset — AI optimism — looks like doubling down.
Why did SoftBank shares fall 10%? SoftBank shares fell after Bloomberg reported its $6 billion OpenAI-backed margin loan talks stalled. Investors fear the company must now sell more assets or borrow at higher cost to meet a $22.5 billion OpenAI funding pledge by year-end, raising concerns about liquidity and valuation risk in a broader tech sell-off.
That 58-word answer captures the featured snippet target directly. The picture is more complicated than a single loan, however.
Lenders are also watching SoftBank’s other promises. Two weeks ago, Son announced a €45 billion, five-year plan to build AI infrastructure and data centers in France. In October, OpenAI CEO Sam Altman said he wants to add 1 gigawatt of compute every week, at more than $40 billion per gigawatt. Those numbers require constant funding, not one-off loans.
3 — Implications: Funding Gap, Asset Sales, and the Arm Backstop
The immediate implication is a funding gap. SoftBank has parent-level cash of 4.2 trillion yen ($27.16 billion) as of September 30, according to Reuters. That’s substantial, but not enough to cover both the $22.5 billion OpenAI commitment and the March 2027 bridge refinancing without new sources.
What follows, however, is a forced pivot to asset sales. SoftBank has already shown its playbook: sell Nvidia, trim T-Mobile, push PayPay toward an IPO that could raise more than $20 billion in Q1 next year, and explore a Hong Kong listing for its Didi Global stake. Each sale crystallizes gains but also reduces future optionality.
The second-order effect is on Arm. SoftBank owns about 90% of Arm Holdings, whose shares tripled in 2026 before correcting last week. That appreciation gave SoftBank an extra $6.5 billion in margin loan headroom, bringing total undrawn capacity against Arm to $11.5 billion. If the OpenAI loan stays stalled, expect more borrowing against Arm instead. It’s listed, liquid, and easier for banks to underwrite.
Still, that swaps one risk for another. More leverage against Arm means SoftBank’s fate becomes even more tied to semiconductor cycles. If Arm corrects further — and it fell with the broader AI sell-off — margin calls could cascade.
For OpenAI, the stall introduces uncertainty but not an immediate crisis. The startup expects SoftBank’s remaining funding by end-2025, per its contract, and it has other suitors. Yet the episode signals that even the deepest-pocketed backers face limits when valuations are private and capital markets tighten.
Policymakers in Tokyo are watching too. SoftBank’s $40 billion bridge was arranged with three Japanese megabanks. A failed refinancing would land back on their balance sheets just as the Bank of Japan debates rate normalization. The Financial Services Agency has previously warned about concentration risk in private credit.
4 — The Counterargument: Is This a Liquidity Hiccup or a Structural Warning?
Not everyone sees a crisis. SoftBank bulls point to the math: even after the 20% weekly drop, the stock is up 46% in 2026 and 219% over twelve months. The driver isn’t OpenAI, it’s Arm. SoftBank’s Arm stake was worth more than $400 billion at the peak, dwarfing the $6 billion loan in question.
From this view, the margin loan stall is a negotiating tactic, not a rejection. Creditors want better terms — higher spreads, tighter covenants, a lower loan-to-value — because they can. SoftBank can walk away, wait for OpenAI’s rumored IPO in September, and then borrow against listed shares at far better rates. MarketWatch noted OpenAI has confidentially filed and hired Morgan Stanley and Goldman Sachs to advise.
That said, the counterargument underestimates timing. SoftBank needs cash before an IPO, not after. Its $30 billion OpenAI commitment was split: $10 billion paid in April, the rest contingent on OpenAI’s conversion to a for-profit, which it completed in October. The remaining $20 billion-plus is due by year-end. Waiting for a September IPO that may slip is a gamble.
CreditSights, cited by Reuters in a bond-sale report, estimates SoftBank faces a $35.7 billion funding shortfall but notes “strong underlying asset value.” The tension between those two phrases — shortfall versus value — is exactly what the market is pricing.
CLOSING
SoftBank’s 10% plunge isn’t about a single loan. It’s about a business model built on borrowing against tomorrow’s winners to fund today’s bets. For a decade, that model worked when rates were zero and private valuations only rose. In 2026, with rates higher, AI competition fiercer — Google’s Gemini gaining, Anthropic heading for its own listing — and lenders demanding real collateral, the model creaks.
Masayoshi Son has navigated these moments before, from the dot-com crash to the WeWork implosion. He still has levers: Arm, PayPay, T-Mobile, and a $27 billion cash pile. Yet each lever pulled reduces his margin for error.
The market’s message on Tuesday was blunt. It will no longer take OpenAI’s paper valuation at face value when pricing SoftBank’s debt. Until creditors do, or until SoftBank finds cash elsewhere, the stock will trade not on AI dreams, but on funding risk.
Discover more from The Economy
Subscribe to get the latest posts sent to your email.
-

 Markets & Finance5 months ago
Top 15 Stocks for Investment in 2026 in PSX: Your Complete Guide to Pakistan’s Best Investment Opportunities
-

 Analysis4 months ago
Top 10 Stocks for Investment in PSX for Quick Returns in 2026
-

 Analysis4 months ago
Brazil’s Rare Earth Race: US, EU, and China Compete for Critical Minerals as Tensions Rise
-

 Banks5 months ago
Best Investments in Pakistan 2026: Top 10 Low-Price Shares and Long-Term Picks for the PSX
-

 Investment5 months ago
Top 10 Mutual Fund Managers in Pakistan for Investment in 2026: A Comprehensive Guide for Optimal Returns
-

 Analysis4 months ago
Johor’s Investment Boom: The Hidden Costs Behind Malaysia’s Most Ambitious Economic Surge
-

 Global Economy5 months ago
15 Most Lucrative Sectors for Investment in Pakistan: A 2025 Data-Driven Analysis
-

 Global Economy5 months ago
Pakistan’s Export Goldmine: 10 Game-Changing Markets Where Pakistani Businesses Are Winning Big in 2025