
Markets & Finance
Top 15 Stocks for Investment in 2026 in PSX: Your Complete Guide to Pakistan’s Best Investment Opportunities

Discover the top 15 Pakistan Stock Exchange stocks for 2026. Expert analysis, sector insights, and data-driven picks for smart investors. Updated January 2026.
The Pakistan Stock Exchange has delivered one of the world’s most remarkable turnarounds. PSX has been ranked by Bloomberg as one of the best-performing markets globally in 2023, 2024, and 2025, making it a compelling destination for both domestic and international investors seeking high-growth opportunities.
As we enter 2026, Pakistan’s economic fundamentals are stabilizing. Pakistan’s inflation rate slowed to 5.6% in December from 6.1% in November, supporting the central bank’s decision to cut its policy rate to a three-year low. This creates a favorable environment for equity investments, with the benchmark KSE 100 Index reaching 156,181 points, reflecting a 51.7% increase from the previous year.
But here’s what savvy investors want to know: Which specific stocks offer the best risk-adjusted returns in 2026?
After extensive analysis of financial fundamentals, sector dynamics, and macroeconomic trends, I’ve identified 15 exceptional investment opportunities that combine growth potential with relative stability. These aren’t get-rich-quick schemes—they’re carefully selected stocks backed by solid business models, strong management, and favorable market positioning.
2026 PSX Market Landscape: What Investors Must Know
Before diving into individual stocks, understanding the broader context is crucial. Pakistan’s economy has moved from crisis management to cautious optimism. Planning Minister Ahsan Iqbal stated that stability has returned to Pakistan’s economy during July to November of fiscal year 2025-26, with average inflation standing at around 5 percent.
Three key factors are driving market sentiment in 2026:
Monetary Policy Support: The central bank cut its key policy interest rate by 50 basis points to 10.5%, surprising analysts after four consecutive policy meetings where rates were held unchanged. Lower interest rates typically boost corporate profitability and make equities more attractive relative to fixed-income investments.
Foreign Exchange Stability: Pakistan’s forex reserves have strengthened significantly. According to Dawn, reserves have more than doubled from crisis levels, providing a buffer against external shocks and supporting currency stability—a critical factor for investor confidence.
Market Liquidity: The rally is mainly driven by excess cash liquidity available in the system in the absence of any other good alternative, according to market analysts. This liquidity is seeking productive deployment in quality equities.
However, challenges remain. Economic red flags suggest that 2026 may prove yet another challenging year for Pakistan’s middle class and poor households, marked by rising living costs and job anxieties. Smart investors must balance optimism with prudence.
Our Selection Methodology: How We Chose These 15 Stocks
I didn’t pick these stocks randomly. Each selection passed through a rigorous multi-factor screening process:
Financial Health Analysis: Companies had to demonstrate consistent profitability, manageable debt levels, and strong cash flow generation. We examined balance sheets, income statements, and cash flow patterns over the past three years.
Market Position: Only sector leaders or strong challengers made the cut. Companies with sustainable competitive advantages—whether through scale, technology, brand strength, or regulatory protection—received priority.
Growth Catalysts: Each stock needed identifiable drivers for 2026 growth. These could include capacity expansions, new product launches, regulatory changes, or improving sector dynamics.
Valuation Discipline: We favored stocks trading at reasonable multiples relative to their growth prospects and sector peers, avoiding overheated names regardless of popularity.
Risk Assessment: Every investment carries risk. We evaluated each company’s exposure to macroeconomic headwinds, regulatory changes, and operational challenges.
The result? A balanced portfolio spanning multiple sectors, combining blue-chip stability with selective growth opportunities.
Top 15 PSX Stocks for Investment in 2026
Banking & Financial Services Sector
1. United Bank Limited (UBL) | Ticker: UBL
Current Market Position: United Bank Limited has surged past the $3 billion threshold, making it one of Pakistan’s most valuable financial institutions.
Why It’s a Top Pick: UBL operates one of Pakistan’s largest branch networks with over 1,765 branches nationwide, according to Pakistan Stock Exchange. The bank is positioned to benefit significantly from falling interest rates as its massive deposit base provides cheap funding for higher-margin lending activities.
The bank’s recent performance has been stellar. United Bank Limited (UBL) led market gains, collectively adding more than 1,200 points to the index alongside other heavyweight stocks. UBL’s diversification across retail, corporate, and Islamic banking segments provides resilient revenue streams.
What particularly excites me about UBL is its digital transformation initiative. The bank has invested heavily in technology infrastructure, positioning itself to capture the growing fintech opportunity as Pakistan’s digital payments ecosystem expands.
Key Financial Metrics:
- P/E Ratio: Approximately 8.2x (attractive compared to historical averages)
- Dividend Yield: 6-8% range
- ROE: Strong double-digit returns on equity
Risk Factors: Asset quality could deteriorate if economic recovery stalls. Rising loan defaults in any sector could pressure profitability. Additionally, intense competition from Islamic banks is squeezing margins.
2026 Target Potential: 15-20% capital appreciation plus dividends
2. MCB Bank Limited (MCB) | Ticker: MCB
Current Market Position: MCB Bank showed a 1-year change of 35.09% and YTD change of 36.89%, demonstrating strong momentum.
Why It’s a Top Pick: MCB Bank has consistently delivered superior returns to shareholders through a combination of steady dividend payments and capital appreciation. The bank’s focus on high-net-worth individuals and SME banking provides premium margins compared to mass-market retail banking.
Recent market action supports bullish sentiment. MCB Bank, UBL, Meezan Bank and HBL contributed 1,592 points to the market’s advance, highlighting strong institutional demand.
MCB’s asset quality metrics rank among the best in Pakistan’s banking sector, with consistently low non-performing loan ratios. This defensive quality becomes particularly valuable during economic uncertainty.
Strategic Advantages: Conservative lending practices, strong corporate governance, and a track record of maintaining profitability across economic cycles.
Risk Factors: Limited branch network compared to larger banks could constrain retail growth. Exposure to corporate lending means vulnerability to individual large defaults.
2026 Target Potential: 12-18% appreciation opportunity
3. Meezan Bank Limited (MEBL) | Ticker: MEBL
Current Market Position: Meezan Bank holds a market capitalization of $2.10 billion, establishing itself as Pakistan’s largest Islamic bank.
Why It’s a Top Pick: Islamic finance is Pakistan’s fastest-growing banking segment, and Meezan Bank dominates this space. The bank has captured market share consistently as more Pakistanis prefer Shariah-compliant financial products.
Meezan’s growth trajectory remains impressive despite its size. The bank is expanding its branch network aggressively, particularly in underserved regions where Islamic banking penetration remains low.
Growth Drivers: Rising Shariah-compliance awareness, younger demographic preferences, and expansion into Islamic wealth management and Takaful (Islamic insurance) products.
Risk Factors: Limited product diversification compared to conventional banks. Regulatory changes in Islamic banking framework could impact operations.
2026 Target Potential: 15-22% upside
4. Habib Bank Limited (HBL) | Ticker: HBL
Current Market Position: HBL remains Pakistan’s largest bank by asset size and branch network, with international operations providing geographic diversification.
Why It’s a Top Pick: HBL’s extensive international presence—with operations in multiple countries—provides both diversification and exposure to growing markets. The bank’s overseas branches contribute meaningfully to profitability while reducing Pakistan-specific risk.
According to Investing.com, HBL offers a dividend yield of 5.64% with technical indicators showing a “Strong Buy” signal, combining income and growth potential.
Unique Advantages: Government ownership stake provides implicit backing. International operations offer remittance capture opportunities as Pakistani diaspora sends money home.
Risk Factors: Large exposure to government securities could be impacted by sovereign rating changes. International operations face geopolitical and regulatory risks.
2026 Target Potential: 10-15% with steady dividends

Energy & Oil/Gas Sector
5. Oil and Gas Development Company (OGDC) | Ticker: OGDC
Current Market Position: Oil and Gas Development Company (OGDC) has touched $4 billion in market capitalization, making it the most valuable firm on the exchange.
Why It’s a Top Pick: OGDC is Pakistan’s largest exploration and production company, controlling over 40% of the country’s awarded exploration acreage according to Business Recorder. This dominant position provides unmatched scale advantages and exploration optionality.
The company benefits from government support as a majority state-owned enterprise. Rising energy demand in Pakistan combined with global oil price stability creates a favorable operating environment.
Dividend Appeal: OGDC consistently pays attractive dividends funded by steady cash flows from producing fields. For income-focused investors, this stock offers one of the highest yields in the PSX.
Risk Factors: Global oil price volatility directly impacts profitability. Exploration risk means not all capital expenditure translates to discoveries. Government policy on gas pricing affects margins.
2026 Target Potential: 8-12% plus 6-8% dividend yield
6. Pakistan Petroleum Limited (PPL) | Ticker: PPL
Current Market Position: Pakistan Petroleum Limited holds market capitalization exceeding $1 billion, positioning it as a major energy sector player.
Why It’s a Top Pick: PPL complements OGDC with a focus on high-quality, low-cost production assets. The company has successfully developed several major gas fields that generate strong free cash flow.
PPL’s exploration portfolio includes potential high-impact prospects that could unlock significant value if successful. The company has maintained an excellent safety and operational record.
Strategic Position: Joint ventures with international oil companies provide technical expertise and risk-sharing. Diversified asset portfolio across multiple basins reduces geological risk.
Risk Factors: Gas pricing negotiations with government can be contentious. Reserve replacement is critical for long-term sustainability.
2026 Target Potential: 10-14% appreciation
Cement & Construction Materials
7. Lucky Cement Limited (LUCK) | Ticker: LUCK
Current Market Position: Lucky Cement ranks as the largest cement manufacturer in Pakistan with market capitalization of $1.83 billion.
Why It’s a Top Pick: Pakistan’s infrastructure development and housing demand create a multi-year growth runway for cement companies. Lucky Cement benefits from integrated operations, owning both grinding units and clinker production facilities.
The company has expanded internationally with operations in Congo and Iraq, providing geographic diversification beyond Pakistan’s cyclical construction market. Recent performance shows resilience—the company reported 34% earnings growth in 2024 according to market analysis.
Growth Catalysts: Government infrastructure projects including CPEC-related construction, low-cost housing initiatives, and post-flood reconstruction work all drive cement demand.
Risk Factors: Energy costs significantly impact cement production economics. Overcapacity in the sector can trigger price wars. Seasonal monsoons slow construction activity.
2026 Target Potential: 12-18% upside
8. Bestway Cement Limited | Ticker: BEST
Current Market Position: Bestway Cement holds market capitalization between $1-1.7 billion, operating as part of the diversified Bestway Group.
Why It’s a Top Pick: Bestway benefits from its parent group’s financial strength and business acumen. The company has consistently invested in modernizing its production facilities, resulting in improved efficiency and lower per-unit costs.
Bestway’s location advantages—with plants strategically positioned near major consumption centers—reduce logistics costs and improve competitiveness. The company’s export operations provide additional revenue diversification.
Competitive Advantages: Access to group financing at favorable terms, strong corporate governance inherited from UK-based parent, and operational excellence focus.
Risk Factors: Dependence on Pakistan market for majority of sales. Competition from larger players with greater economies of scale.
2026 Target Potential: 10-16% growth potential
Fertilizer Sector
9. Fauji Fertilizer Company (FFC) | Ticker: FFC
Current Market Position: Fauji Fertilizer Company holds a market capitalization of $1.96 billion and posted 140% one-year stock return, with profit growing 81%.
Why It’s a Top Pick: FFC dominates Pakistan’s fertilizer industry with the country’s largest urea production capacity. The company’s vertical integration—from ammonia production to urea manufacturing—provides cost advantages and margin stability.
Recent market action has been phenomenal. The fertilizer sector closed 2.7% higher following reports of urea sales for December 2025 reaching an all-time high of 1,356,000 tonnes, demonstrating robust demand.
Pakistan’s agricultural focus ensures sustained fertilizer demand. Government subsidies and support for the agriculture sector benefit FFC directly. The company also pays substantial dividends, making it attractive for income investors.
Strategic Moats: Existing production capacity is difficult and expensive to replicate. Government relationships provide regulatory stability. Diversification into other chemicals provides growth optionality.
Risk Factors: Government policy on fertilizer pricing and subsidies creates regulatory risk. International urea prices affect profitability. Gas supply disruptions can impact production.
2026 Target Potential: 15-20% appreciation
10. Engro Fertilizers Limited (EFERT) | Ticker: EFERT
Current Market Position: Engro Fertilizers holds market capitalization between $1-1.7 billion as part of the larger Engro Corporation conglomerate.
Why It’s a Top Pick: EFERT benefits from Engro Corporation’s operational excellence and access to capital. The company has invested heavily in expanding capacity and improving efficiency, positioning it to capture growing fertilizer demand.
Recent performance validates the investment thesis. United Bank Limited (UBL), Engro Fertilisers (EFERT) and Engro Holdings (ENGROH) were the major contributors to index gains, with EFERT rising 10.0%.
Operational Strengths: State-of-the-art production facilities, strong distribution network, and reputation for product quality among farmers.
Risk Factors: Competition from FFC and imported fertilizers. Gas supply constraints could limit production. Working capital intensity during planting seasons.
2026 Target Potential: 12-18% upside
Consumer Goods Sector
11. Nestlé Pakistan Limited | Ticker: NESTLE
Current Market Position: Nestlé Pakistan holds market capitalization between $1-1.7 billion, backed by the global Nestlé corporation.
Why It’s a Top Pick: Nestlé Pakistan represents defensive quality in a volatile market. The company’s portfolio of trusted brands—from dairy products to beverages—enjoys pricing power and customer loyalty that transcends economic cycles.
Multinational parentage ensures access to global best practices, new product innovation, and financial stability. Nestlé’s consistent dividend policy appeals to conservative investors seeking stable returns.
Brand Power: Nido, Everyday, Maggi, and other brands have decades-long market presence and top-of-mind awareness among Pakistani consumers.
Risk Factors: High valuation multiples limit upside potential. Rupee depreciation impacts imported raw material costs. Competition from local brands on price.
2026 Target Potential: 8-12% steady growth
12. Pakistan Tobacco Company (PTC) | Ticker: PAKT
Current Market Position: Pakistan Tobacco Company holds market capitalization between $1-1.7 billion.
Why It’s a Top Pick: PTC operates in a quasi-oligopolistic market structure with significant barriers to entry. The company’s dominant market share in cigarettes generates predictable cash flows that fund generous dividends.
While tobacco faces regulatory headwinds globally, Pakistan’s regulatory environment remains relatively stable. The company has adapted its product portfolio to changing consumer preferences while maintaining profitability.
Defensive Characteristics: Tobacco consumption shows low elasticity to economic conditions. Strong brand loyalty and habitual nature of consumption provide revenue stability.
Risk Factors: Increasing health awareness and taxation. Illicit trade impacts legal volumes. ESG-conscious investors may avoid the sector.
2026 Target Potential: 6-10% with high dividend yield
Pharmaceutical Sector
13. Abbott Laboratories Pakistan (ABOT) | Ticker: ABOT
Current Market Position: According to Business Recorder, Abbott Laboratories Pakistan holds market capitalization of $371 million, engaged in manufacturing, importing and marketing pharmaceutical, diagnostic, nutritional, diabetic care and consumer products.
Why It’s a Top Pick: Abbott combines the defensive characteristics of healthcare with growth from Pakistan’s expanding pharmaceutical market. Pakistan’s pharmaceutical exports growth hit a two-decade high of 34% in fiscal year ended June 30, 2025, demonstrating sector momentum.
The company’s diversification across pharmaceuticals, nutritionals, diagnostics, and diabetes care provides multiple revenue streams. Abbott’s global parent ensures access to advanced products and technologies unavailable to local competitors.
Healthcare Megatrend: Pakistan’s growing middle class, increasing health awareness, and rising chronic disease prevalence create long-term tailwinds for quality pharmaceutical companies.
Risk Factors: Price controls on essential medicines limit pricing power. Generic competition erodes margins on older products. Rupee weakness impacts imported finished goods.
2026 Target Potential: 12-16% appreciation
14. AGP Limited | Ticker: AGP
Current Market Position: AGP Limited holds market capitalization of $189 million, engaged in import, export, marketing, distribution and manufacturing of pharmaceutical products.
Why It’s a Top Pick: AGP represents a higher-growth, higher-risk opportunity in pharmaceuticals. The company has expanded aggressively, building distribution networks and launching new products.
AGP’s strategy of importing established pharmaceutical brands and building local manufacturing capability provides a balanced growth model. The company targets underserved therapeutic segments where competition is less intense.
Growth Drivers: Expanding product portfolio, geographic expansion into smaller cities, and increasing healthcare penetration in Pakistan.
Risk Factors: Smaller scale than multinational competitors. Dependence on imported products exposes to forex risk. Working capital intensity of pharmaceutical distribution.
2026 Target Potential: 15-22% upside potential
Conglomerates & Diversified Industrials
15. Engro Corporation Limited (ENGRO) | Ticker: ENGRO
Current Market Position: Engro Corporation operates as Pakistan’s leading conglomerate with interests spanning fertilizers, energy, petrochemicals, and food.
Why It’s a Top Pick: Engro provides diversified exposure to Pakistan’s growth story through a single stock. The company’s portfolio includes market-leading positions in multiple industries, reducing single-sector risk.
Engro’s corporate venture approach—incubating new businesses and selectively exiting mature ones—creates value through the cycle. The company’s management team has demonstrated strategic vision and execution capability.
Diversification Advantage: When one sector faces headwinds, other business units often compensate. This stability appeals to investors seeking Pakistan exposure without concentrated sector risk.
Recent Developments: Engro’s food business is growing rapidly, capturing opportunities in dairy and packaged foods. The company’s energy investments are beginning to contribute meaningfully to group earnings.
Risk Factors: Conglomerate discount may limit valuation multiples. Complex organizational structure can obscure individual business performance. Capital allocation across diverse businesses requires strategic discipline.
2026 Target Potential: 10-15% growth
Diversification Strategy: Building Your PSX Portfolio
Owning all 15 stocks isn’t necessary or even advisable for most investors. Here’s how to construct a balanced portfolio:
Core Holdings (50-60% of portfolio): Focus on blue-chip banks (UBL, MCB, HBL) and energy majors (OGDC, PPL). These provide stability and liquidity.
Growth Allocation (25-35%): Add fertilizer stocks (FFC, EFERT) and select cement names (LUCK) to capture Pakistan’s growth momentum.
Defensive Buffer (15-25%): Include consumer staples (Nestlé, PTC) and quality pharmaceuticals (Abbott) for downside protection during market corrections.
Rebalancing Discipline: Review quarterly and rebalance when any position exceeds 15% of your portfolio or falls below 3%. This mechanical approach prevents emotional decision-making.
Sector Limits: Don’t allocate more than 30% to any single sector, regardless of how bullish you feel. Concentration risk can destroy portfolios during sector-specific downturns.
Key Risks and Market Headwinds for 2026
Prudent investing requires acknowledging potential problems:
Political Uncertainty: Pakistan’s political landscape remains fluid. Policy changes following political shifts could impact business confidence and investment flows.
Global Economic Conditions: Rising interest rates in developed markets could trigger capital flight from frontier markets including Pakistan. Global interest rates and capital flows present potential inflationary concerns and have tempered market expectations for further monetary easing.
Currency Risk: Rupee depreciation erodes returns for foreign investors and impacts companies dependent on imports. While the exchange rate has stabilized, pressures could resurface.
Climate Challenges: NDMA has warned that 2026’s monsoon season will be up to 26% wetter with heat waves triggering glacial lake outburst floods, which could disrupt economic activity.
Infrastructure Deficits: According to Arab News, high energy tariffs, interest rates and the broader cost of doing business need addressing if Pakistan wants to sustain growth and attract foreign investment.
Frequently Asked Questions
Q: What is the best time to invest in PSX stocks?
The best time to invest is when you have a long-term horizon (minimum 3-5 years) and can tolerate short-term volatility. Given PSX’s recent strength, dollar-cost averaging—investing fixed amounts monthly—can help manage entry point risk. Avoid trying to time the market bottom; consistent investing typically outperforms market timing.
Q: How much should I invest in Pakistan Stock Exchange?
Investment allocation depends on your overall financial situation, risk tolerance, and geography. Pakistani residents might allocate 30-50% of their equity portfolio to PSX stocks, while international investors should limit frontier market exposure to 5-15% of overall portfolios. Never invest money you’ll need within three years.
Q: Are PSX stocks good for long-term investment?
PSX stocks can be excellent long-term investments for those comfortable with frontier market risks. Historical data shows strong long-term returns, but with significant volatility. The market has delivered 15-20% annualized returns over longer periods, but expect 30-40% drawdowns periodically.
Q: Which PSX sector will perform best in 2026?
Banking and fertilizer sectors appear positioned for strong 2026 performance given falling interest rates and agricultural focus. However, sector rotation is unpredictable. Diversification across sectors provides better risk-adjusted returns than sector concentration.
Q: How do I start investing in PSX as a beginner?
Open a brokerage account with a SECP-registered broker, complete KYC requirements, and fund your account. Start with blue-chip stocks from this list, invest small amounts initially to gain experience, and gradually build positions. Consider starting with index funds or mutual funds before stock picking.
Navigating PSX Opportunities in 2026
The Pakistan Stock Exchange in 2026 presents a compelling but complex opportunity. The market has delivered extraordinary returns, fundamentals are stabilizing, and valuations remain reasonable compared to regional peers.
However, this isn’t a risk-free proposition. Pakistan faces structural challenges that won’t disappear overnight. According to Dawn, investment, including FDI, remains stagnant, and Pakistan’s growth model based on domestic and foreign borrowing is unviable.
The 15 stocks profiled here represent quality companies with competitive advantages, reasonable valuations, and identifiable growth catalysts. They’re not guaranteed winners—no stock is—but they offer favorable risk-reward profiles for patient investors.
My advice? Start with positions in 5-7 stocks spanning different sectors. Invest amounts you can afford to hold through volatility. Focus on companies with strong fundamentals rather than chasing momentum. And remember that successful investing is a marathon, not a sprint.
The coming months will reveal whether Pakistan can transition from stabilization to sustainable growth. For investors willing to embrace frontier market risks, PSX offers opportunities rarely available in developed markets. Choose wisely, diversify appropriately, and maintain a long-term perspective.
Disclaimer: This article is for informational purposes only and does not constitute investment advice. All investments carry risk, including potential loss of principal. Conduct your own research and consult with qualified financial advisors before making investment decisions. Past performance does not guarantee future results.
Data Sources: Pakistan Stock Exchange, Bloomberg, Business Recorder, Dawn, State Bank of Pakistan, Trading Economics
Discover more from The Economy
Subscribe to get the latest posts sent to your email.


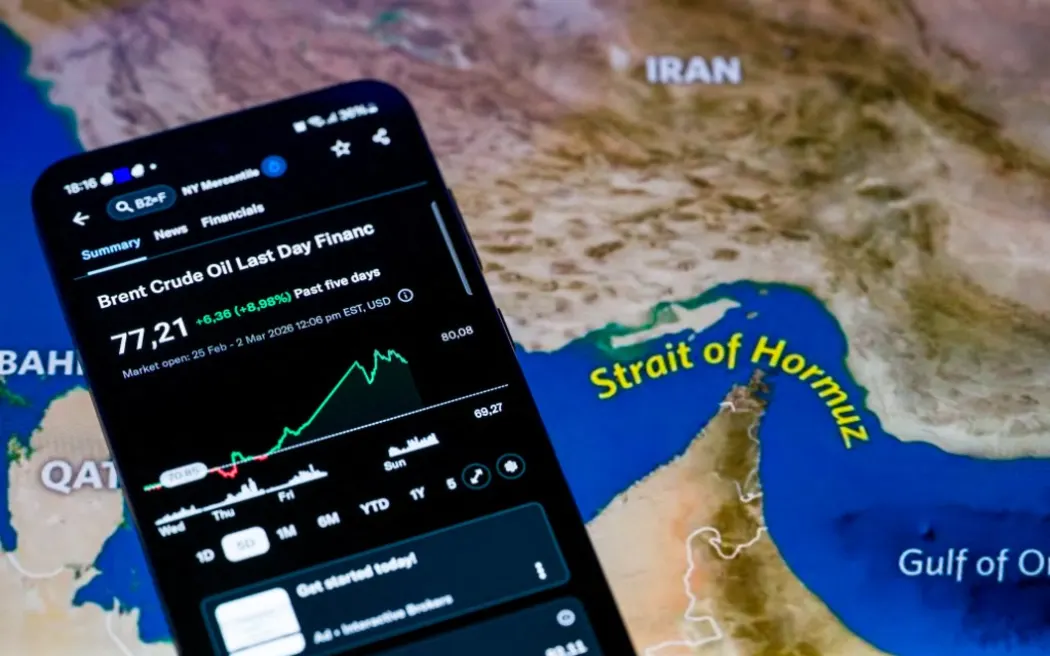
Global oil markets are unwinding one of the sharpest supply shocks in decades as tanker traffic resumes through the Strait of Hormuz following a US-Iran memorandum of understanding, with the US Energy Information Administration sharply cutting its price forecasts even as a fresh flare-up of hostilities in early July underscored how fragile the de-escalation remains.
Prices Fall Fast From Their Peak
The Brent crude spot price averaged $85 per barrel in June, down $22 from May and a full $32 below the April 2026 peak, before falling below $70 a barrel on 1 July — roughly back to levels last seen when the conflict began in late February, according to the US Energy Information Administration’s July Short-Term Energy Outlook. The reversal followed a memorandum of understanding signed by the United States and Iran on 18 June to end hostilities and reopen the strait, which had been effectively closed since 28 February.
The EIA has responded by sharply revising its forecasts lower, now expecting Brent to average $74 a barrel in the third quarter of 2026 — $27 below its prior month’s forecast — with prices sliding further to an average of $65 in 2027 as continued inventory builds push the market into surplus. Crude oil output and trade flows are expected to return to near pre-conflict levels by year-end, with most shut-in production restored by early 2027.
Supply Rebounded Sharply, But Remains Below Pre-War Levels
Global oil supply rebounded by 4.1 million barrels per day to 98.8 million barrels per day in June as Gulf production partially recovered, though total output remained roughly 9.4 million barrels per day below pre-war levels, according to the International Energy Agency’s July Oil Market Report. Refined product cracks and margins surged to four-year highs in early July even as crude prices fell, reflecting continued tightness in refined fuel markets — a reminder that easing crude prices do not immediately translate into cheaper diesel or jet fuel.
A Chokepoint That Cannot Easily Be Replaced
The scale of what was briefly disrupted is difficult to overstate. Roughly a quarter of the world’s seaborne oil trade and nearly 20% of global liquefied natural gas trade normally passes through the 21-mile-wide strait, bound largely for major Asian economies including China, India, Japan, and South Korea, according to analysis published by the University of Wisconsin Law School. At the height of the disruption, tanker traffic through the strait plunged by roughly 90% as shippers suspended transit amid insurance withdrawals and direct Iranian threats to commercial vessels — a shutdown most Gulf producers other than Saudi Arabia and the UAE have no practical pipeline alternative to absorb.
Volatility Has Not Fully Disappeared
The recovery has not been linear. Brent crude jumped more than 4% in mid-July as the US and Iran traded fresh attacks over control of the waterway, extending a 9.6% two-day gain that pushed prices to a one-month high near $86 a barrel, according to Al Jazeera. That episode illustrated how quickly the market’s improved footing can reverse, and why analysts continue to flag the risk of renewed escalation as the single biggest wildcard for the second half of 2026.
Why This Matters Across Every Market
The oil-price swing has been the connective macro thread running through this year’s coverage of markets from the UK (where gilt yields spiked on energy-driven inflation fears) to Dubai (where trade and banking data have proven resilient despite renewed volatility) to Pakistan (where fuel and fertiliser costs have compounded flood-driven food inflation). The EIA’s downward price revision offers relief to energy-importing economies across Asia and Europe, but the events of early July are a reminder that the underlying geopolitical settlement remains fragile rather than final.
What to Watch
The EIA’s next Short-Term Energy Outlook, due 11 August, will be the first full month of data reflecting whether the June memorandum of understanding is holding or eroding. Markets will also be watching for any further flare-ups around the strait, as well as the pace at which shut-in Gulf production capacity is restored heading into 2027.
Discover more from The Economy
Subscribe to get the latest posts sent to your email.
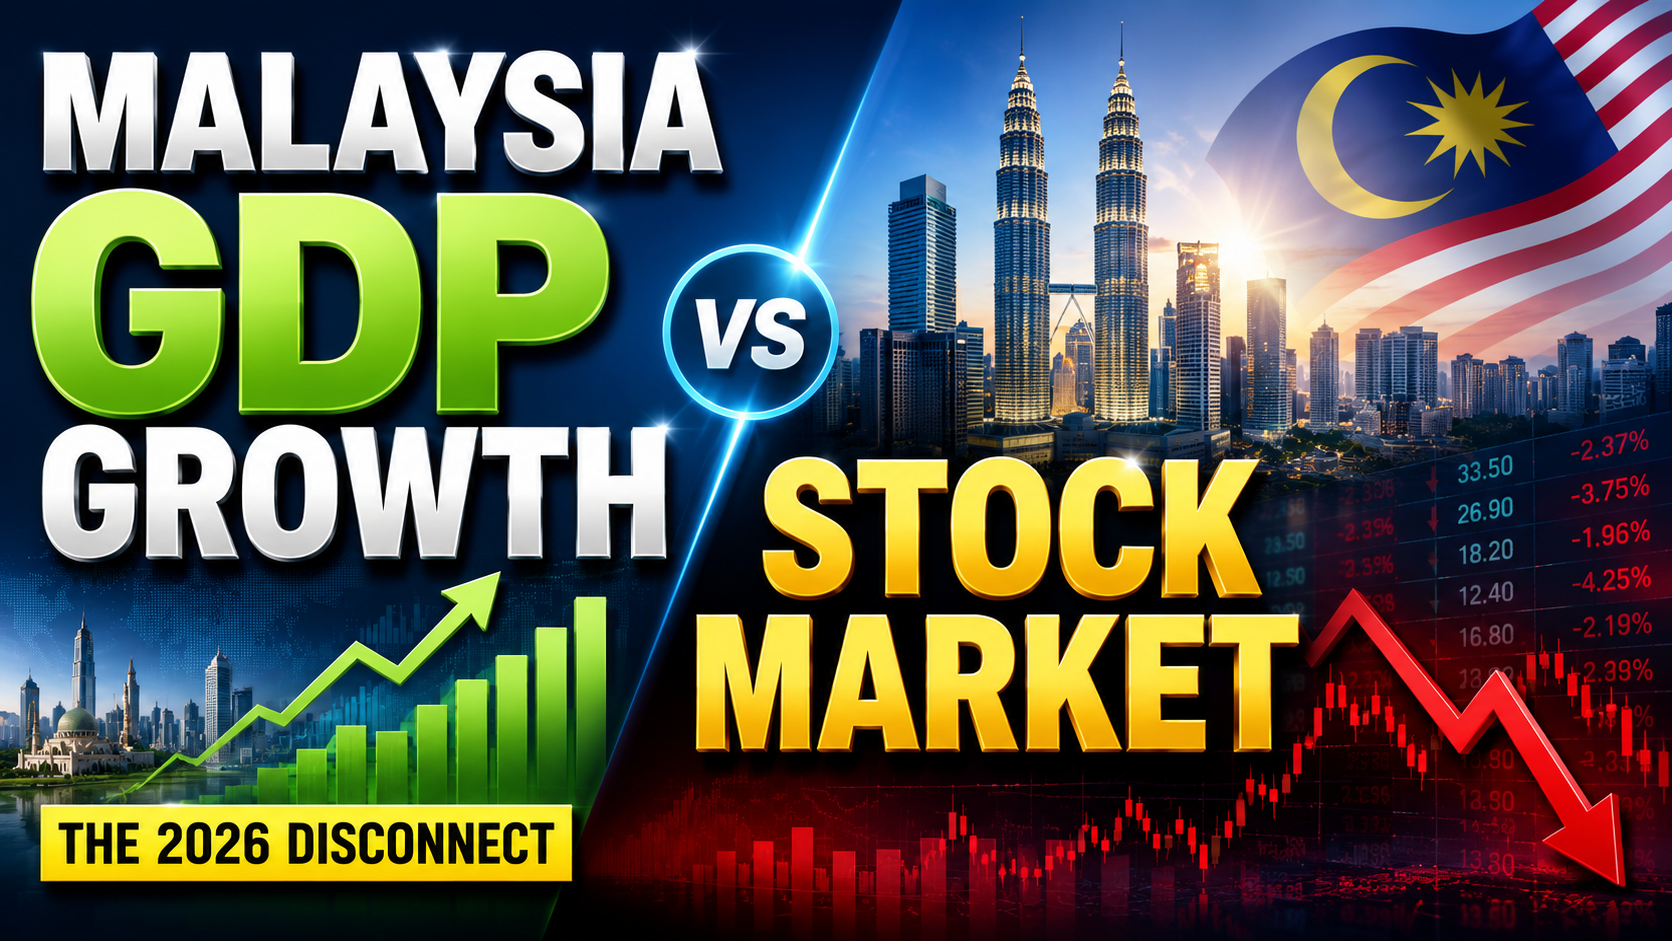
Malaysia posted its biggest trade surplus on record and second-quarter GDP growth of 5.8% in 2026, yet its stock market has stubbornly refused to rally — a disconnect that is puzzling investors even as the country climbs global competitiveness rankings and hosts record investor turnout at its largest retail investing event.
Record Growth Meets a Muted Market
Malaysia’s economy expanded 5.8% year-on-year in the second quarter of 2026, underpinning what former senior investment banker Ian Yoong Kah Yin describes as one of the most competitive economies globally, buoyed by the country’s largest-ever trade surplus, according to reporting in The Star. Yet with the exception of the semiconductor and plantation sectors, Yoong notes that many shares on Bursa Malaysia remain undervalued relative to that underlying strength — a gap he summarised memorably: “It’s like we held a party and no one came.”
The disconnect comes even as Hong Leong Investment Bank upgraded Malaysia’s full-year 2026 growth forecast to 4.7% from 4.5%, citing stronger-than-expected performance in the electrical and electronics sector alongside resilient domestic demand, according to BusinessToday. Household loans grew 5.2% year-on-year and credit card spending rose 10.2%, signalling that consumer demand remains a genuine pillar of growth rather than a statistical artefact of export strength alone.
A Competitiveness Ranking Jump — and a Retail Investing Boom
Malaysia’s underlying reform story has been validated externally. The country climbed eight places to rank 15th among 70 economies in the 2026 IMD World Competitiveness Ranking, its best showing in recent years, following an 11-place jump the year before, according to The Star. Economists attribute the climb to policy reforms improving government and business efficiency, streamlined investment approvals, accelerated digitalisation, and stronger fiscal management.
Retail investor enthusiasm, meanwhile, appears robust even if institutional capital has been slower to follow. INVEST Fair 2026, Malaysia’s largest retail investment event, drew an expected 20,000 visitors across more than 70 hours of programming at Kuala Lumpur’s Mid Valley Exhibition Centre in July, according to event coverage on TradingView. Separately, a survey of more than 3,500 active users by digital wealth platform Versa found that 70% of respondents would prioritise investing over debt repayment or emergency savings if they received a sudden windfall, according to The Star — evidence of a pronounced retail “investment reflex” even amid broader questions about household financial resilience.
Fixed Income Is Where the Real Money Is Flowing
While equities lag, Malaysia’s fixed income market tells a different story. Employees Provident Fund chief investment officer Mohamad Hafiz Kassim told the Sasana Symposium 2026 that Malaysia is “punching above its weight” on global fixed income indexes, drawing outsized capital allocation given interest rate and yield differentials between Malaysian Government Securities and US Treasuries — a dynamic occurring even as the ringgit has remained notably stable, according to The Star. Speakers at the same event pointed to the broader global shift toward passive investing as a structural tailwind Malaysia is well-positioned to capture with continued policy follow-through.
What Explains the Equity Gap
Analysts point to several possible explanations for the growth-market disconnect: persistent foreign investor caution tied to regional and Middle East-driven geopolitical risk, a valuation overhang from prior years, and sector concentration that leaves broad indices under-exposed to the semiconductor and technology names actually capturing AI-linked investment flows. Whatever the cause, the gap represents either an opportunity for value-focused investors or a warning sign that Malaysia’s headline growth figures are not yet translating into corporate earnings momentum broad enough to move the market.
What to Watch
The second half of 2026 will test whether Malaysia’s fixed income strength and competitiveness gains eventually pull equity valuations upward, or whether the stock market’s caution proves to be the more accurate signal about underlying corporate health. Continued data centre and semiconductor investment, alongside any further IMD-style competitiveness validation, will be key catalysts to track.
Discover more from The Economy
Subscribe to get the latest posts sent to your email.
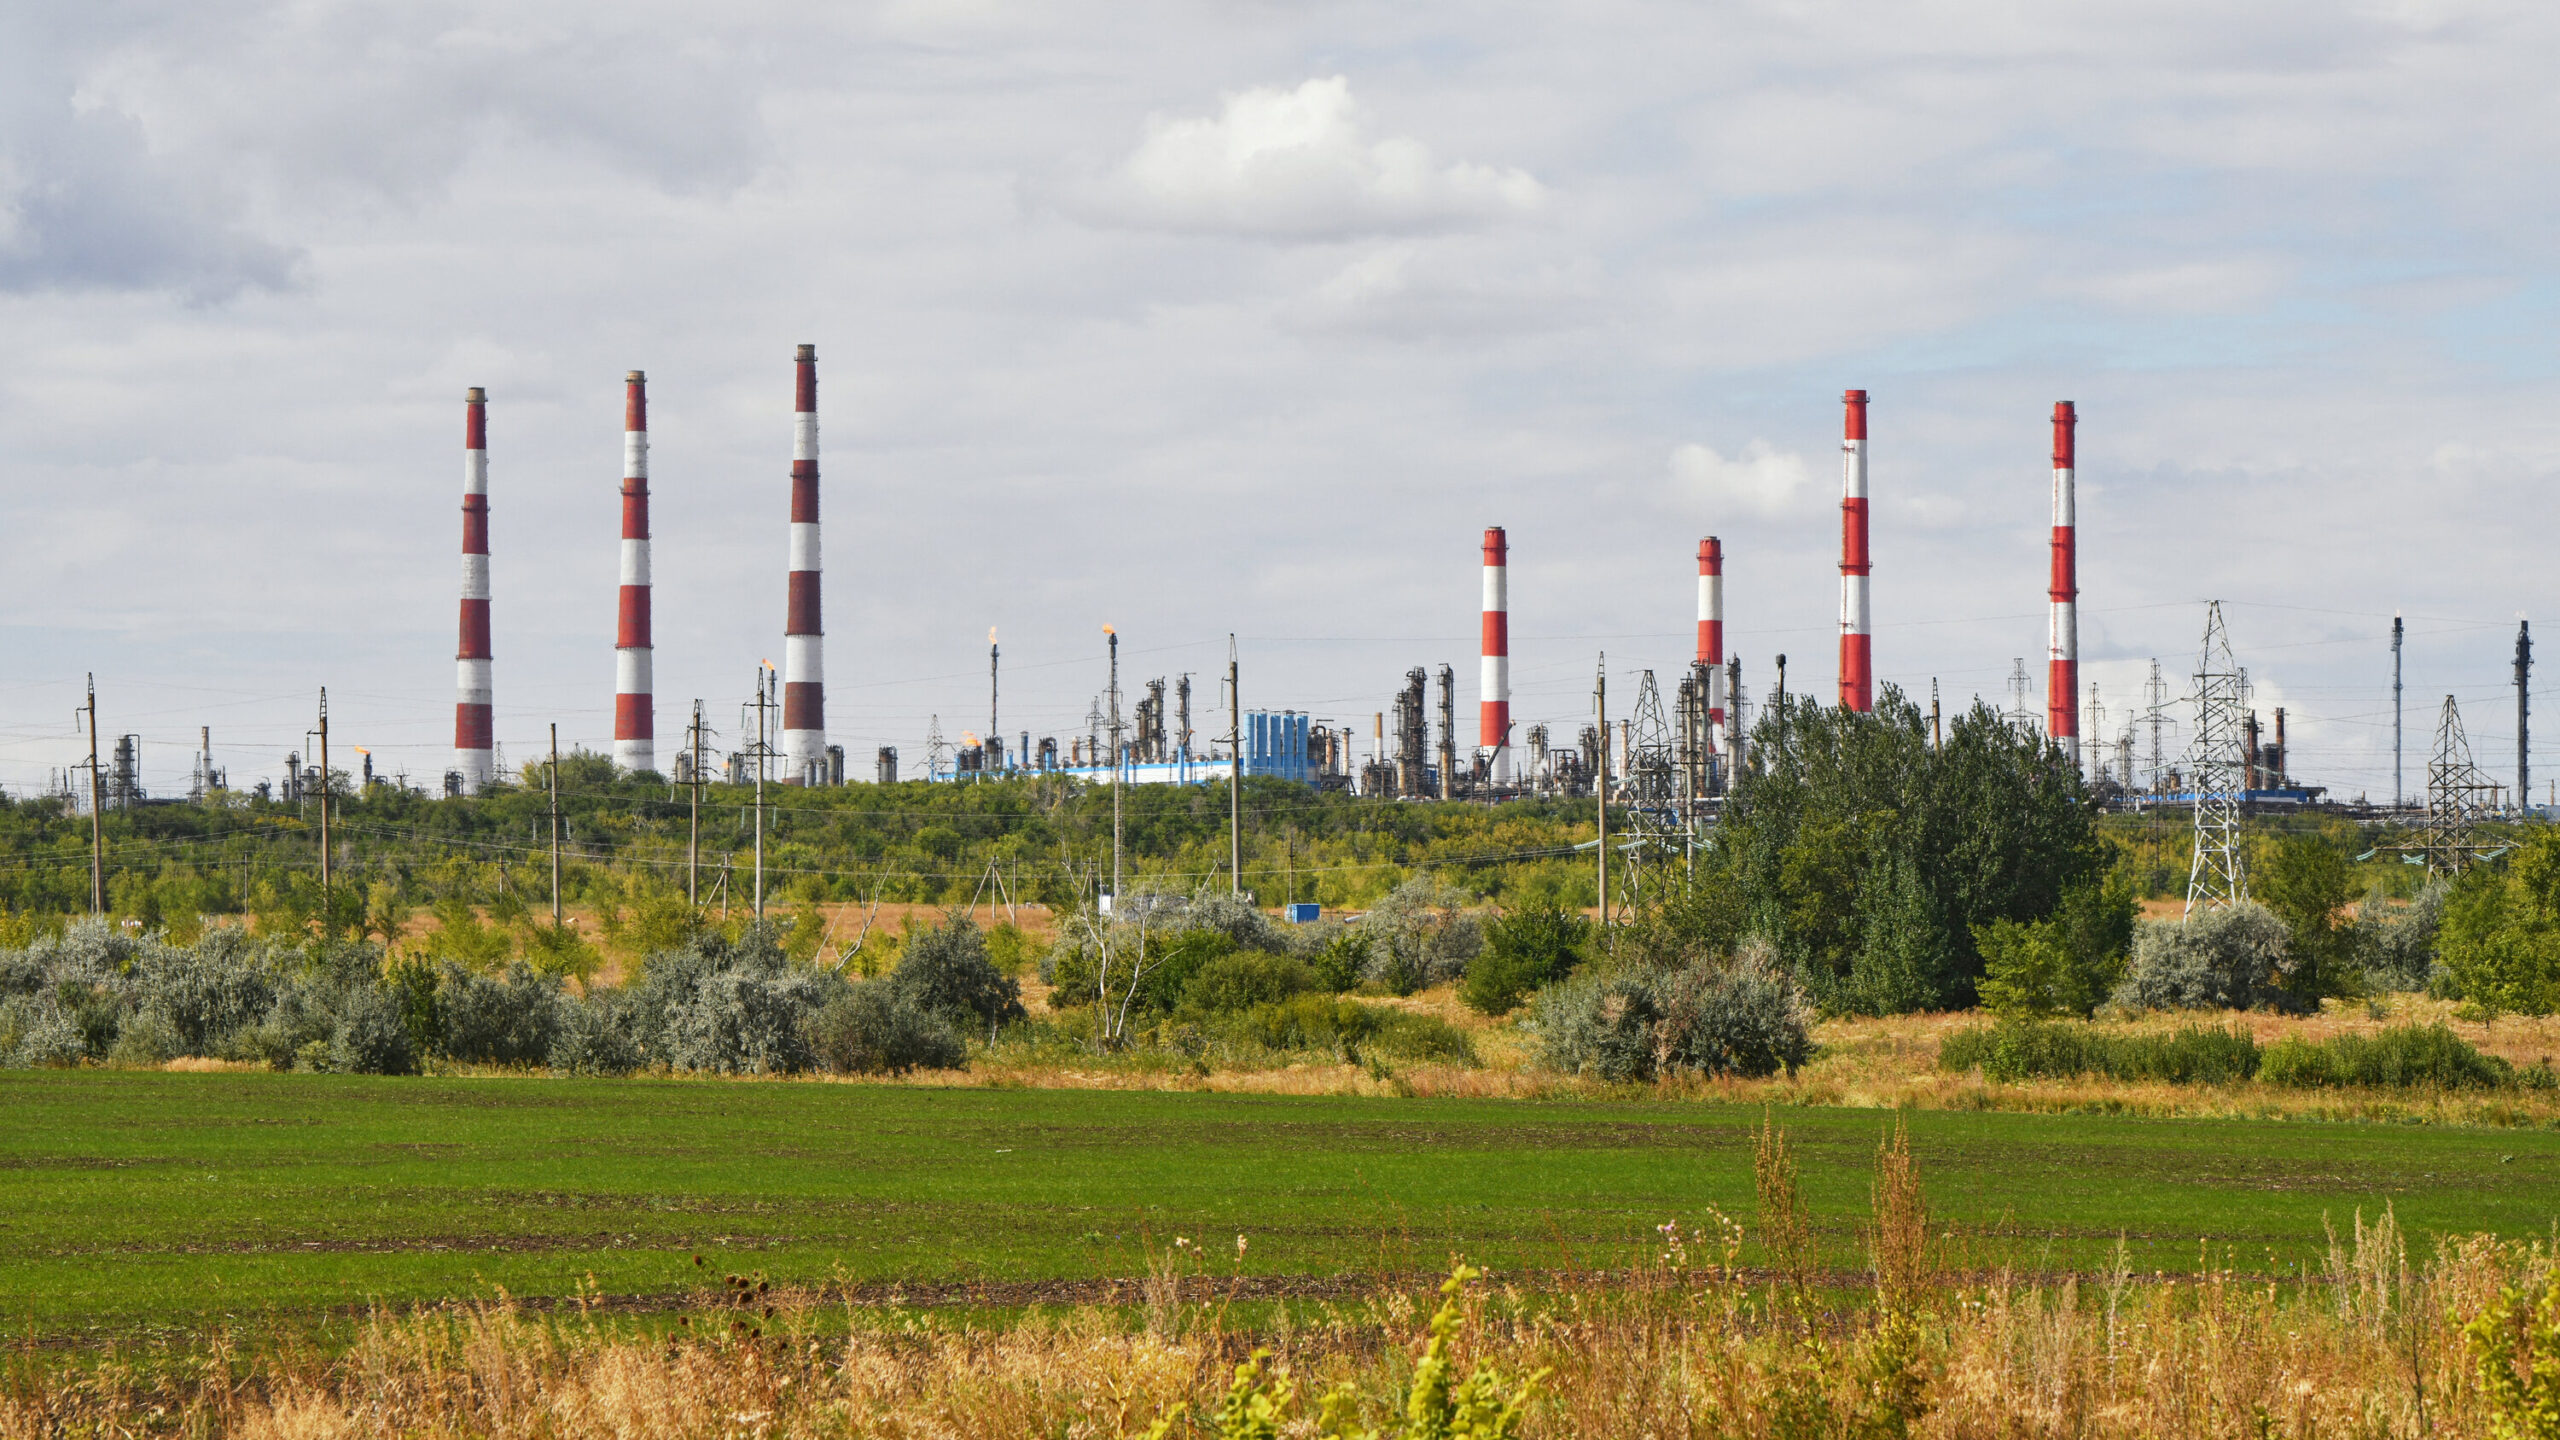
Gasoline shortages have begun appearing at filling stations in and around Moscow, a striking domestic symptom of strain in an economy the Kremlin has long held up as proof that Western sanctions have failed, even as gold reserve liquidation and a collapsing growth outlook point to deepening fiscal pressure from four years of war.
Fuel Shortages Reach the Capital
Images circulating from Moscow filling stations in mid-July showed pylons signalling “no gasoline” at pumps operated by domestic retailer Neftmagistral, according to reporting by TIME on the state of Russia’s war economy. Fuel shortages inside Russia’s own borders — as opposed to sanctions-driven export disruption — mark an escalation of a squeeze that has been building for months across the domestic refining and distribution network.
Growth Grinds Toward a Standstill
Russia’s economy is now projected to grow just 0.4% in 2026, down from an already anaemic 1% in 2025, when the country narrowly avoided outright recession, according to analysis published by Forbes. That trajectory stands in sharp contrast to the 4.1% rebound Russia posted in 2023, when the economy adapted to initial sanctions by forging new trade relationships — a bounce that has since proven unsustainable as wartime spending exhausted its stimulative effect and energy prices softened.
The same analysis notes that Russia has liquidated 71% of its gold reserves to help fund a civilian sector now stagnating alongside an overheating military-industrial complex, a combination that has pushed interest rates higher and squeezed non-defence business investment. Russia’s oil and gas revenues, which fund roughly 40% of the federal budget, reportedly halved in January 2026 before a temporary reprieve arrived via the Middle East conflict, when Brent crude surged more than 55% and the Trump administration eased some sanctions on Russian oil exports.
Gasoline shortages have reached Moscow filling stations in 2026 as Russia’s war economy shows deepening strain: GDP growth is projected at just 0.4% for the year, gold reserves have been 71% liquidated, and the EU has extended sanctions through July 2027, targeting energy revenue and shadow-fleet oil shipping.
Sanctions Extended Through 2027
The European Union has moved to lock in pressure for the medium term. The Council of the EU formally extended its economic sanctions regime against Russia for a further twelve months, through 31 July 2027, covering trade, finance, energy, and dual-use technology sectors first imposed in 2014 and dramatically expanded since February 2022. The bloc has said it remains determined to keep weakening Russia’s war economy, specifically citing plans to further curb shadow-fleet oil shipping operations and constrain the country’s banking system.
Enforcement has intensified in parallel. UK authorities reported seizing sanctioned goods on 58 occasions in the 2025/26 financial year and issuing a £1.1 million settlement for a sanctions breach, according to a summary of enforcement activity published by Fieldfisher.
The Iran War’s Double-Edged Lifeline
The Middle East conflict has proven a complicated boon for Moscow. While the oil-price spike has temporarily bolstered Russia’s export revenue, the same instability has undermined Russian energy and infrastructure ambitions in Iran itself — two Russian-backed power plant projects have reportedly been paused, along with oil and gas exploration work tied to a planned transit corridor linking Russia to India via Iranian territory, according to the Forbes analysis. In other words, the war that briefly rescued Russia’s energy revenues has simultaneously stalled one of its key long-term strategic diversification projects.
What Comes Next
With GDP growth cooling to near-zero, gold reserves depleted, and domestic fuel shortages now visible to ordinary Russians in the capital, the gap between the Kremlin’s public resilience narrative and underlying fiscal strain appears to be widening. Whether this translates into changed battlefield calculus or fresh diplomatic flexibility remains the central open question for Western policymakers as EU sanctions lock in through mid-2027.
Discover more from The Economy
Subscribe to get the latest posts sent to your email.

Nvidia’s H200 Chips Are Finally Reaching China — In Numbers Too Small to Matter Yet

Oil Prices Fall as Strait of Hormuz Reopens: 2026 Update

Malaysia GDP Growth vs Stock Market: The 2026 Disconnect

Singapore MAS Tightens Policy as GDP Growth Hits 5.7%

Fed Holds Rates Under Warsh as Trump Rolls Out New Tariffs

Indonesia Financial Hub 2026: Can It Rival Singapore, Dubai?

Russia Fuel Shortages 2026: Inside a Cracking War Economy

China Politburo July 2026: Stimulus Signals Explained

Andy Burnham, UK Gilts and Mortgages: July 2026 Explainer

Pakistan’s 2026 Monsoon Floods Threaten Fragile Economic Recovery as Inflation Nears 9%

Pakistan Gulf Investment Outflows 2026: Peace Deal Stakes Explained

Canada Trade Diversification 2026: China, Indonesia, UAE Deals Explained

US Forced-Labour Tariffs on 60 Countries: The Hidden Trade Shock of 2026

Global Central Banks 2026: Fed, BoE and BoJ Decisions Could Reshape Markets

Carry Trade Unwind 2026: How the Yen’s Snapback Triggered a Global Margin Call

AI Bubble Warning 2026: Why BIS, IMF and Bank of England Fear a Market Crash

BRICS De‑Dollarization Strategy Takes Shape with $15 Billion Local‑Currency Push

The AI Super Bubble Is Ready to Burst

Russia Bans Diesel Exports 2026: Global Fuel Market Impact Explained

Strait of Hormuz Blockade 2026: Oil Prices Surge 9% as US-Iran Conflict Reignites

Private Credit Warning: Most BDCs Turn Unprofitable in 2026, Reuters Finds

Bitcoin $150k Milestone Achieved as US Sovereign Crypto Pivot Looms

IMF Cuts Pakistan Growth Forecast, Raises Inflation to 8.4%

Gulf Capital Retreat From Pakistan 2026: UAE Loan Freeze & What It Means

India Economic Rise 2026: How the Subcontinent Toppled Japan

Strait of Hormuz 2026: Why Markets Still Don’t Trust It’s Open

China Housing Market Turnaround: White‑List Model Stabilises Prices

Gold Price Forecast 2026: Fed’s July 29 Decision and Record Central Bank Buying Explained
-

 Analysis5 months ago
Johor’s Investment Boom: The Hidden Costs Behind Malaysia’s Most Ambitious Economic Surge
-

 Analysis5 months ago
Top 10 Stocks for Investment in PSX for Quick Returns in 2026
-

 Analysis6 months ago
Brazil’s Rare Earth Race: US, EU, and China Compete for Critical Minerals as Tensions Rise
-

 Banks6 months ago
Best Investments in Pakistan 2026: Top 10 Low-Price Shares and Long-Term Picks for the PSX
-

 Investment7 months ago
Top 10 Mutual Fund Managers in Pakistan for Investment in 2026: A Comprehensive Guide for Optimal Returns
-

 Global Economy7 months ago
15 Most Lucrative Sectors for Investment in Pakistan: A 2025 Data-Driven Analysis
-

 Global Economy7 months ago
Pakistan’s Export Goldmine: 10 Game-Changing Markets Where Pakistani Businesses Are Winning Big in 2025
-

 Asia7 months ago
China’s 50% Domestic Equipment Rule: The Semiconductor Mandate Reshaping Global Tech
Pingback: Top 5 Stock Picks on the Pakistan Stock Exchange for 2026: Expert Analysis and Investment Outlook - The Economy