
Global Finance
Global Trade and Tariffs 2026:WTO Barometer Still Shows Growth

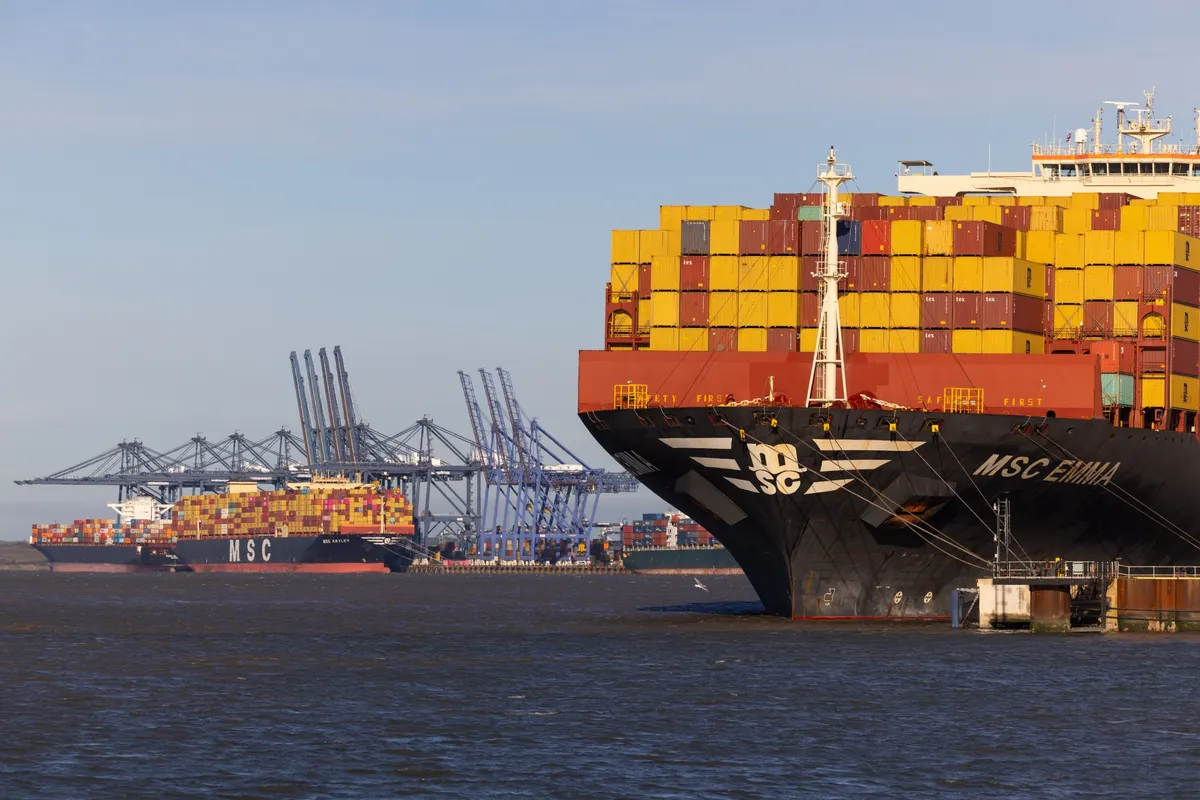
Global merchandise trade continues to expand in 2026 even as the United States and other major economies impose sweeping tariffs and non-tariff barriers. The WTO’s Goods Trade Barometer reached 102.0 in September 2026, remaining comfortably above the 100 baseline that signals trend growth. AI-related goods have become the dominant driver, accounting for a sharply rising share of incremental trade volumes and offsetting the drag from higher duties. WTO data via Peacock Tariff Consulting
This resilience is not uniform. Traditional consumer and intermediate goods face clearer headwinds, while semiconductors, servers, networking equipment, and other AI infrastructure components are expanding rapidly. At the same time, Section 301 measures and broader tariff actions have accelerated supply-chain diversion toward Vietnam, India, Mexico, and selected other locations. Economic Times citing DHL-Stern and WTO/OECD
For businesses, investors, and policymakers the central question is whether AI-driven capital expenditure can keep outweighing protectionist pressures through 2027, or whether a slowdown in hyperscaler spending would quickly expose the underlying fragmentation of the trading system.
Table of Contents
- Why Is Global Trade Growing Despite High Tariffs?
- What Does the WTO Goods Trade Barometer Actually Show?
- How Are AI Goods Driving Trade Volumes?
- What Role Do Section 301 and Other Tariffs Play?
- Which Countries Are Winning and Losing from Diversion?
- What Are the Risks to the 2026–27 Outlook?
- Key Takeaways
- Frequently Asked Questions
Why Is Global Trade Growing Despite High Tariffs?
Merchandise trade volumes rose in the first half of 2026. WTO figures indicated roughly 1.9 percent quarter-on-quarter growth in the first quarter and stronger year-on-year comparisons. The composition of that growth matters more than the headline: restrictive measures (tariff increases, import bans, quantitative restrictions, and subsidies) have surged, yet overall volumes have not contracted. Peacock Tariff Consulting
Two forces dominate. First, explosive demand for AI-enabling goods. Second, firms’ ability to absorb, reroute, or re-invoice around higher duties rather than halt trade. DHL and NYU Stern raised their 2026 goods-trade growth forecast to 4.6 percent, explicitly citing adaptation and the AI boom. Almost three-quarters of cross-border commerce still occurs under relatively low WTO-bound tariff rates, providing a floor. Economic Times
What Does the WTO Goods Trade Barometer Actually Show?
The September 2026 reading of 102.0 was up from 101.7 in June and sits above the index’s long-term baseline of 100. Component indicators linked to export orders, international air freight, and container shipping remained supportive. The barometer is a leading indicator; hard volume data through mid-2026 have largely confirmed the signal. Peacock Tariff Consulting
Importantly, the index captures activity even while the policy environment is the most restrictive in a generation. Trade-easing measures have lost relative momentum, so the expansion is occurring against a deteriorating rules backdrop.

How Are AI Goods Driving Trade Volumes?
AI-related products accounted for approximately 42 percent of merchandise trade growth in 2025. That share jumped toward 76 percent of incremental growth in the first quarter of 2026, according to WTO and OECD data referenced in recent analyses. Semiconductors, high-bandwidth memory, servers, and networking gear have become the single largest growth engine. Economic Times
This concentration creates both upside and vulnerability. As long as hyperscalers and sovereign AI projects continue heavy capital expenditure, trade volumes receive a powerful tailwind. Any pause or downward revision in those spending plans would subtract the primary growth driver almost immediately.
What Role Do Section 301 and Other Tariffs Play?
In 2026 the United States layered additional Section 301 tariffs covering a very large share of imports from major partners, with many rates in the 10–12.5 percent range and higher duties on selected products. These measures were partly framed around forced-labour and supply-chain security concerns. Earlier IEEPA-based actions faced legal challenges, prompting reliance on other authorities. Peacock Tariff Consulting
The practical effect has been higher landed costs and accelerated diversion rather than a collapse in total trade. Companies have shifted assembly, testing, and final billing locations while still moving physical goods.
Which Countries Are Winning and Losing from Diversion?
Vietnam, India, and Mexico have been the clearest near-term beneficiaries in electronics and certain intermediate goods. Smaller exporters in South and Southeast Asia have faced collateral damage from higher baseline tariffs that do not distinguish finely among sources. China’s direct share has been under pressure, yet Chinese-owned or Chinese-linked capacity in third countries has often captured the redirected orders. [Economic Times and related trade analyses]
Trade Growth Drivers 2026 – Comparative Impact
| Driver | Volume Impact | Policy Sensitivity | Durability | Notes |
|---|---|---|---|---|
| AI / semiconductor goods | Strong positive | Medium | High if capex holds | Dominant engine |
| Traditional consumer goods | Modest / negative | High | Low | Tariff-sensitive |
| Energy & commodities | Mixed | High | Geopolitical | Hormuz / sanctions risk |
| Digital services | Positive | Lower | High | Outside goods barometer |
What Are the Risks to the 2026–27 Outlook?
The largest downside risk is a slowdown in AI infrastructure spending. Secondary risks include further tariff escalation, successful legal challenges that create uncertainty, energy or shipping disruptions, and a broader global growth disappointment. Upside would come from faster-than-expected supply-chain adaptation or additional fiscal support for strategic industries in multiple countries.
Key Takeaways
- WTO Goods Trade Barometer remains above 100 despite record tariffs and restrictions.
- AI-related goods are the primary reason volumes are still rising.
- Section 301 and parallel measures are redirecting rather than stopping flows.
- Vietnam, India, and Mexico are the clearest diversion winners so far.
- A slowdown in hyperscaler and AI capital expenditure is the biggest threat to the outlook.
Frequently Asked Questions
Is global trade actually growing in 2026?
Yes. WTO volume data, the Goods Trade Barometer, and independent forecasts such as DHL-Stern all show positive growth led by AI goods.
Why hasn’t the tariff surge collapsed trade?
Firms are rerouting supply chains and AI demand is currently strong enough to more than offset higher costs in the fastest-growing categories.
Which countries benefit most from trade diversion?
Vietnam, India, and Mexico have captured the largest redirected flows in electronics and related intermediate goods.
What is the single biggest risk to the current trade outlook?
A sharp slowdown or deferral in AI-related capital spending by hyperscalers and governments.
How do the 2026 Section 301 tariffs differ from earlier rounds?
They are broader in coverage, sit on top of existing duties, and have been paired with other restrictive tools, producing wider diversion effects.
Conclusion
Global trade in 2026 is being pulled in opposite directions: the most restrictive policy environment in decades on one side and an historic AI infrastructure boom on the other. So far the boom is winning, keeping the WTO barometer above trend and supporting positive volume growth. For economy, finance, and foreign-policy audiences, the critical variables to watch through 2027 are hyperscaler capex guidance, the durability and legal status of Section 301 measures, and whether diversion gains in Asia and Mexico prove structural. The next four to six quarters will reveal whether AI demand can continue to mask a more fragmented trading system or whether protectionism finally exerts a clearer drag.
Discover more from The Economy
Subscribe to get the latest posts sent to your email.


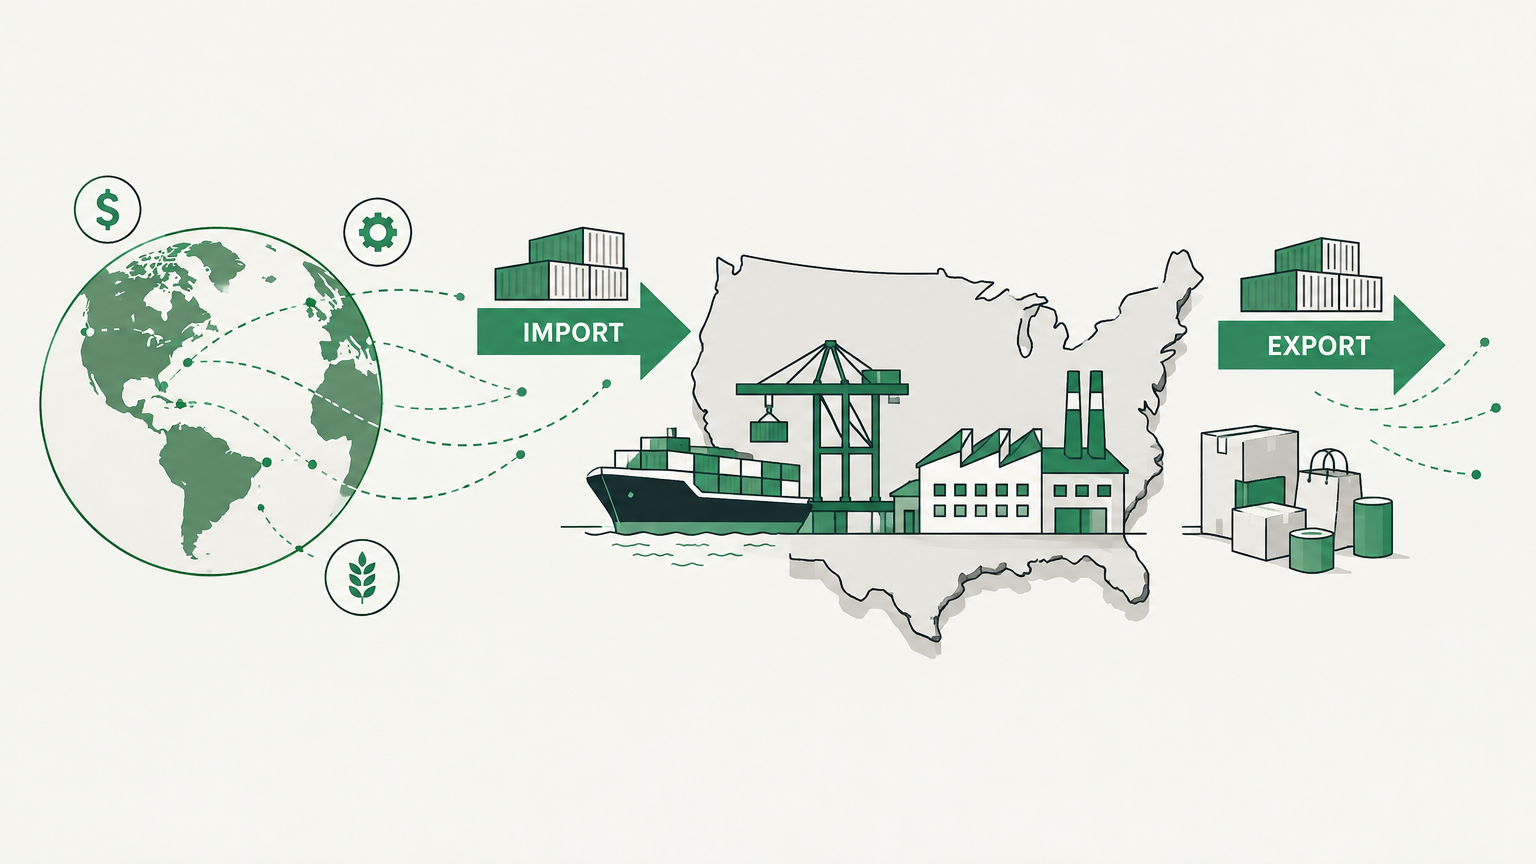
How economic globalization shapes the US economy, from record trade and the 35% fall in factory jobs since 1979 to wage stagnation and the 2025-26 tariffs.
Economic globalization is the integration of national economies through trade, investment and capital flows, and for the United States it works out to a mixed ledger rather than a single verdict. In 2025 the US exported $3,432.3 billion of goods and services and imported $4,333.8 billion, running a record $1.2 trillion goods deficit beside a record $339.5 billion services surplus (BEA/Census, Census Bureau). Factory employment has fallen 35 percent since its June 1979 peak (BLS). And the tariffs built to reverse that now average just over 12 percent, adding about $1,230 a year to the average household (PIIE).
Three findings do most of the work in this debate:
- The gains are thin and spread out; the losses are deep and concentrated. Cheaper imports help every shopper a little, while factory closures hit particular towns hard, which is why the politics of trade run louder than the economics.
- The trade deficit is a poor scoreboard. It edged down in 2025 even as the goods deficit hit a record, and tariffs appear to have rerouted trade toward Mexico, Vietnam and Taiwan rather than removing it (Census Bureau).
- The evidence on factory jobs is more nuanced than the headlines. The government’s own long-run data ties the 35 percent fall in manufacturing employment mainly to a shift toward services and to recessions, not to imports alone (BLS).
The rest of this guide works through what each side of the ledger actually contains, and what the CHIPS Act, USMCA and the 2025-26 tariffs do about it.
What economic globalization means for the United States
Economic globalization is the growing integration of national economies through trade in goods and services, cross-border investment, capital flows, and the movement of people and ideas. In the United States it shows up as cheaper imports, larger export markets, and more competition at home.
That is the neutral definition. The argument starts with what you count. A shopper buying a $200 television and a machinist in Ohio whose plant has closed are both describing the same phenomenon from opposite ends, which is why the pros and cons of globalization in America never quite settle. The honest answer is that the impact of economic globalization on the US economy is not one number but a ledger, and in 2025 and 2026 both sides of it moved at once.
This guide works through the ledger in order: what the United States sells and buys, where the manufacturing jobs went, what happened to wages, and how the tariffs of 2025 and 2026 have changed the arithmetic.
Key takeaways
- The United States trades at record scale. In 2025 it exported $3,432.3 billion of goods and services and imported $4,333.8 billion, both all-time highs (BEA/Census).
- The goods deficit is large, and so is the services surplus. The 2025 goods deficit reached a record $1.2 trillion, while the services surplus hit a record $339.5 billion (Census Bureau).
- Manufacturing has shed jobs for four decades. Factory employment peaked at 19.6 million in June 1979 and had fallen to 12.8 million by June 2019, a drop of 6.7 million or 35 percent (BLS).
- Tariffs have raised the cost of importing. The average US tariff now runs just over 12 percent, up from about 2.5 percent before January 2025, adding roughly $1,230 a year to the average household’s costs (PIIE).
- The wage picture is mixed and contested. Real wages for the lowest-paid US workers fell 0.3 percent in 2025 even as median wages rose (EPI).
The mechanics underneath all this are worth ten minutes. This short explainer from the Federal Reserve Bank of St. Louis walks through why countries specialize, how world prices set the terms of trade, and why the same shift that lowers prices for buyers hurts some domestic sellers:

The gains: cheaper goods, bigger export markets, deeper innovation
Globalization’s benefits to American households are easy to underestimate, because they arrive as slightly lower prices rather than as a headline. Here is what the ledger shows on the plus side.

Cheaper goods and services for consumers
When a country imports $4,333.8 billion of goods and services in a single year, the size of the number matters less than what it buys (BEA/Census). Imports widen the range of goods on the shelf and hold prices down in the sectors where American producers compete with foreign suppliers. The Federal Reserve Bank of St. Louis explains the mechanism in the video above: when a good can be bought abroad more cheaply, the consumer surplus from the lower world price is the basic gain from trade.
That gain is also why the reverse is expensive. As the Peterson Institute for International Economics puts it, tariffs make tariffed goods more expensive for consumers and push production toward goods “that could be obtained more cheaply abroad” (PIIE). The consumer benefit of globalization and the consumer cost of protectionism are the same fact seen from two directions.
Export markets for services, technology and agriculture
The United States is not only a buyer. In 2025 it exported $3,432.3 billion of goods and services, with services exports alone reaching $1,234.9 billion (BEA/Census). The 2025 services surplus of $339.5 billion was the highest on record, and the US notched record exports to 47 countries, led by Mexico, the United Kingdom and the Netherlands (Census Bureau).
Trade agreements widen those channels. Under the United States-Mexico-Canada Agreement (USMCA), which replaced NAFTA and took effect on 1 July 2020, US goods and services trade with the bloc totaled an estimated $1.8 trillion in 2022, and US exports to it accounted for 33 percent of all US exports that year (USTR). For a country whose strengths run to software, finance, aerospace and agriculture, open markets are where its comparative advantage gets paid.
Innovation through global talent and capital
The third gain is harder to see but it drives the other two: capital and know-how that cross borders. US direct investment in its USMCA partners alone reached $569.0 billion in 2022, up 9.5 percent on the year (USTR).
The clearest recent example is industrial policy built on exactly that flow. The CHIPS and Science Act of 2022 gave the Department of Commerce $50 billion to rebuild domestic semiconductor research and manufacturing, split into $39 billion of incentives for US facilities and $11 billion for research and development (NIST). The bets are visible: an amended package for GlobalFoundries of up to $955 million, a final R&D award of up to $1 billion for Anderon, a new IBM subsidiary, and up to $100 million for Quantinuum (NIST). Semiconductor supply chains are the most globalised in the world, and the strategy is to pull more of that chain onto US soil rather than step out of it.
The costs: lost factory jobs, stagnant wages, and a deficit that will not close
The other side of the ledger is where the political energy is, because its costs are concentrated in particular towns and industries rather than spread thinly across every price tag.
The manufacturing jobs that never came back

American manufacturing employment peaked in June 1979 at 19.6 million. By June 2019 it was 12.8 million, down 6.7 million or 35 percent, and its share of all nonfarm jobs had fallen from 22 percent to 9 percent (BLS). The deepest damage was in durable goods: computers and electrical products lost 43 percent of their jobs over the same forty years, and durable goods as a group shed 4.3 million (BLS).
Here is the part that gets lost in the shouting. The BLS account of that decline does not blame trade. It ties the fall to a broad shift toward service industries and to recessions from which factory payrolls never fully recovered: “manufacturing has shed employment over the past 40 years as the U.S. economy has shifted to service-providing industries” (BLS). Automation, offshoring and import competition are all plausible contributors, and economists differ on the weights, but the government’s own retrospective puts the emphasis on structural change rather than a single villain.
The sector has stabilised rather than recovered. US manufacturing employed 12,681 thousand people in October 2026, with average hourly earnings of $37.24 and a sector unemployment rate of 2.7 percent (BLS). Those are not the numbers of a collapsing industry, but they are also a long way from 19.6 million. The familiar shorthand is the Rust Belt; the data behind it, in this BLS series, is national and by industry.
Wage stagnation at the bottom

Wage outcomes split sharply by where a worker sits in the distribution. In 2025 the 10th-percentile hourly wage, the line below which a tenth of workers fall, dropped 0.3 percent to $14.56, while the median rose 0.8 percent to $25.67 and the 90th percentile added 0.4 percent to $64.52 (EPI).
The longer trend is starker. Since 1979, wages at the 90th percentile grew an average of 1.1 percent a year against 0.5 percent at the 10th, and wages for the top 1 percent rose 182 percent from 1979 to 2023, roughly seven times the growth at the 10th percentile (EPI). Had low-end wages kept pace with productivity since 1979, the Economic Policy Institute estimates the 10th-percentile wage would be $21.04, or 45 percent higher than it is (EPI).
Where EPI and other economists part company is the cause. EPI attributes the 2025 reversal to policy choices, pointing to tariffs, deportations and federal layoffs, and argues “this reversal was not inevitable, it was caused by policy decisions that weakened the labor market” (EPI). That is a contested claim, and it is worth reading as one side’s reading of the evidence rather than a settled finding.
The trade deficit, explained

Source: BEA/Census, U.S. International Trade in Goods and Services, Annual 2025.
The US trade deficit is the gap between what the country buys from abroad and what it sells, and it is the single most misread number in this debate. In 2025 the total goods and services deficit was $901.5 billion, actually down $2.1 billion from 2024 (BEA/Census). But that modest headline hides a bigger gap underneath: the goods deficit alone hit a record $1.2 trillion, while the services surplus hit a record $339.5 billion (Census Bureau).
Two details make the deficit easier to read straight. First, it is not a scoreboard. A goods deficit is the accounting mirror of other flows, including investment coming into the US, and it can rise simply because American firms bought ahead of threatened tariffs. Second, the deficit has been reshaping rather than shrinking. The 2025 deficit with China fell $93.4 billion to $202.1 billion, but record deficits opened up with Mexico ($196.9 billion), Vietnam ($178.2 billion), Taiwan ($146.8 billion) and Ireland ($114.2 billion) (BEA/Census, Census Bureau). Tariffs moved the trade, in other words, more than they removed it. Our colleagues at The Economy have tracked the same rerouting in the new geography of trade.
Benefits vs drawbacks of globalization for the US economy
The table below is the ledger in one view. Every figure links to the evidence behind it.
| Dimension | What globalization gave the US | What it cost the US |
|---|---|---|
| Prices | Cheaper and wider choice of imported goods; consumer surplus from lower world prices (St. Louis Fed) | Tariffs are passed through to consumers, making tariffed goods more expensive (PIIE) |
| Jobs | Open markets for services, tech and agriculture; record exports to 47 countries in 2025 (Census Bureau) | Manufacturing employment down 6.7 million from its 1979 peak (BLS) |
| Wages | Median real wage up 0.8 percent in 2025 (EPI) | Lowest-paid workers’ real wages fell 0.3 percent in 2025, to $14.56 (EPI) |
| Trade balance | Record services surplus of $339.5 billion in 2025 (Census Bureau) | Record goods deficit of $1.2 trillion in 2025 (Census Bureau) |
| Investment and innovation | Foreign direct investment and industrial policy rebuild capacity; CHIPS Act put $50 billion into semiconductors (NIST) | Dependence on foreign supply chains for critical inputs, from chips to drugs (NIST) |
The honest summary is that the two columns are not symmetric. The gains are spread across hundreds of millions of consumers and are worth a little each; the losses are concentrated in particular industries and communities and are worth a great deal to those who carry them. That asymmetry, more than the totals, is what drives trade policy.
What Americans actually say about trade and globalization
The macro numbers rarely capture how the argument feels on the shop floor. On r/Economics, a thread on the US trade deficit running to 266 comments brought out the full range, from plant managers to defenders of protectionism.
A self-described US plant manager made the case against tariffs from the production side, not the consumer side:
“I actually do manufacture parts in the US. I am plant manager. But it is impossible to get raw materials, castings, steel, and many chemicals from inside the US… The tariff is just a 10% tax on US citizens. It does not effect other countries at all. It is not magically creating domestic sources of raw materials.”
- u/EnterpriseGate, r/Economics, “US trade deficit surges despite Donald Trump’s tariffs”
Not everyone in the thread agreed, and the dissent is worth taking seriously. One commenter argued the deficit itself was the wrong test of whether tariffs were working:
“It’s almost as if President Trump has tricked China into foolishly doing even more of our work for us in exchange for nothing more than printed pieces of paper, while making China even more dependent on US consumption.”
- u/dually, r/Economics, same thread
A third commenter accepted the goal of a more protectionist posture but doubted the execution, arguing that a mercantilist turn “needs sound industrial policy” and that this administration does not have one (u/CremedelaSmegma, r/Economics). The split inside one thread, between people who want manufacturing back and people who doubt tariffs will bring it, is the whole debate in miniature.
Modern US trade policy and the shift toward protectionism
If the 1990s were the high-water mark of American openness, the 2020s are the renegotiation. The shift is not a rejection of global trade so much as an attempt to re-price it.
Tariffs: from 2.5 percent to just over 12 percent

The tariff regime built through 2025 and 2026 has raised the average US tariff “to just over 12 percent,” up from about 2.5 percent before 20 January 2025, though down from a temporary peak of 28 percent (PIIE). The cost lands close to home: PIIE puts the added cost at roughly $1,230 per American household per year (PIIE), and separate PIIE research concludes that “US consumers and firms are paying nearly the full cost of US tariffs” because a country has limited ability to push the burden onto foreign exporters (PIIE).
The legal ground under the tariffs has shifted as fast as the rates:
- The broad “reciprocal” tariffs were first imposed under the International Emergency Economic Powers Act (IEEPA) in April 2025.
- On 20 February 2026, the Supreme Court struck the IEEPA tariffs down.
- The administration replaced them with an interim blanket tariff of 10 percent under Section 122 of the Trade Act of 1974, which expires after 150 days unless Congress extends it.
- The likely durable basis is Section 301, with USTR launching 76 new investigations covering 99 percent of US imports (PIIE).
Where that levy actually falls is the point most political arguments skip:

The tax is collected at the border, but the payer is the importer, and almost all of it is passed forward into what shoppers pay. The Economy has followed the same chain in Trump tariffs 2026 and in what the Supreme Court ruling means for trade.
USMCA and the deals that still stand
Not every channel is closing. The USMCA, which replaced NAFTA and entered into force on 1 July 2020, remains the backbone of North American trade, adding chapters on digital trade, anticorruption and good regulatory practices, and improving rules of origin for autos and trucks (USTR). Trade with the bloc totaled about $1.8 trillion in 2022, a third of all US exports (USTR).
| USMCA, by the numbers | |
|---|---|
| Entered into force | 1 July 2020, replacing NAFTA (USTR) |
| Total US goods and services trade with the bloc, 2022 | About $1.8 trillion (USTR) |
| US exports to the bloc, 2022 | $789.7 billion (USTR) |
| Share of all US exports, 2022 | 33.0 percent (USTR) |
| US services trade surplus with the bloc, 2022 | About $26.0 billion (USTR) |
Alongside tariffs, the US is also spending directly to rebuild capacity at home. The CHIPS Act’s $50 billion for semiconductors is the clearest case: less a retreat from globalization than a bet on keeping the most strategic link of the global supply chain inside the country (NIST). For how far that reshaping has gone, see the new tariff war and reshoring.
The verdict: integration continues, but on new terms
Economic globalization did not end in 2026; it changed its terms. The United States still exports more than $3.4 trillion a year and imports more than $4.3 trillion, and the world still buys American services in record volume. What has changed is who bears the friction. The old bargain spread small gains across consumers and concentrated large losses in factory towns. The new one adds a tariff bill of about $1,230 a year to the average household while promising to bring back the jobs that trade, on the evidence, is only one of several forces taking them.
That is the unsatisfying truth at the centre of this debate. The goods deficit is a poor scoreboard, tariffs appear to have moved trade more than they have removed it, and the government’s own long-run data pins the factory-job decline more on a shift to services and on recessions than on imports alone. None of that makes the losses less real for the people who lived through them. It just means the honest case for or against globalization rests on weighing the two columns in the table above, not on any single number.
More on the global economy from The Economy
Trade and globalization are running themes across The Economy’s coverage. For the wider picture, the 2026 global economic outlook maps the forces reshaping markets, and World Trade in 2026 covers the cost of fragmentation. Start from The Economy for daily coverage of trade, tariffs and the global economy.
Frequently asked questions about globalization and the US economy
Does economic globalization help or hurt the average American worker?
It does both, and which one dominates depends on where the worker sits. Globalization has kept prices on imported goods low and opened export markets for services, tech and agriculture, but it has also coincided with a 35 percent fall in manufacturing employment since 1979. The BLS data behind that fall points mainly to a shift toward services and to recessions, so trade is one factor among several rather than a single cause. For a closer look at how wages have moved, see The Economy‘s coverage of the global economy.
How does globalization affect inflation in the United States?
Cheaper imports pull prices down, which is deflationary, so globalization has generally held US inflation below where it would otherwise be in import-heavy categories. Tariffs work in the opposite direction: the average US tariff rose from about 2.5 percent to just over 12 percent through 2025 and 2026, and PIIE estimates the added cost at roughly $1,230 per household per year. Our explainer on US tariffs and inflation covers how that pass-through works.
What is the difference between globalization and international trade?
International trade is the buying and selling of goods and services across borders. Globalization is broader: it includes trade but also cross-border investment, capital flows, and the movement of people and ideas. A country can trade heavily without being deeply globalized, and a company can invest abroad without exporting a single product. The Federal Reserve Bank of St. Louis explains the trade half of the picture clearly.
What is the US trade deficit and does it matter?
The trade deficit is the gap between the value of what the US buys from abroad and what it sells, and it is often misread as a scoreboard. In 2025 the total goods and services deficit was $901.5 billion, slightly down on 2024, while the goods deficit alone hit a record $1.2 trillion and the services surplus hit a record $339.5 billion. Our piece on trade imbalances explains why the narrower goods figure moves around so much.
How much do the 2026 tariffs cost the average American household?
About $1,230 a year, according to PIIE, with most of the cost passed through to consumers rather than absorbed by foreign exporters. The tariffs themselves now average just over 12 percent, and their legal basis shifted after the Supreme Court struck down the IEEPA tariffs in February 2026. The Economy’s analysis of the ruling walks through what replaced them.
Discover more from The Economy
Subscribe to get the latest posts sent to your email.
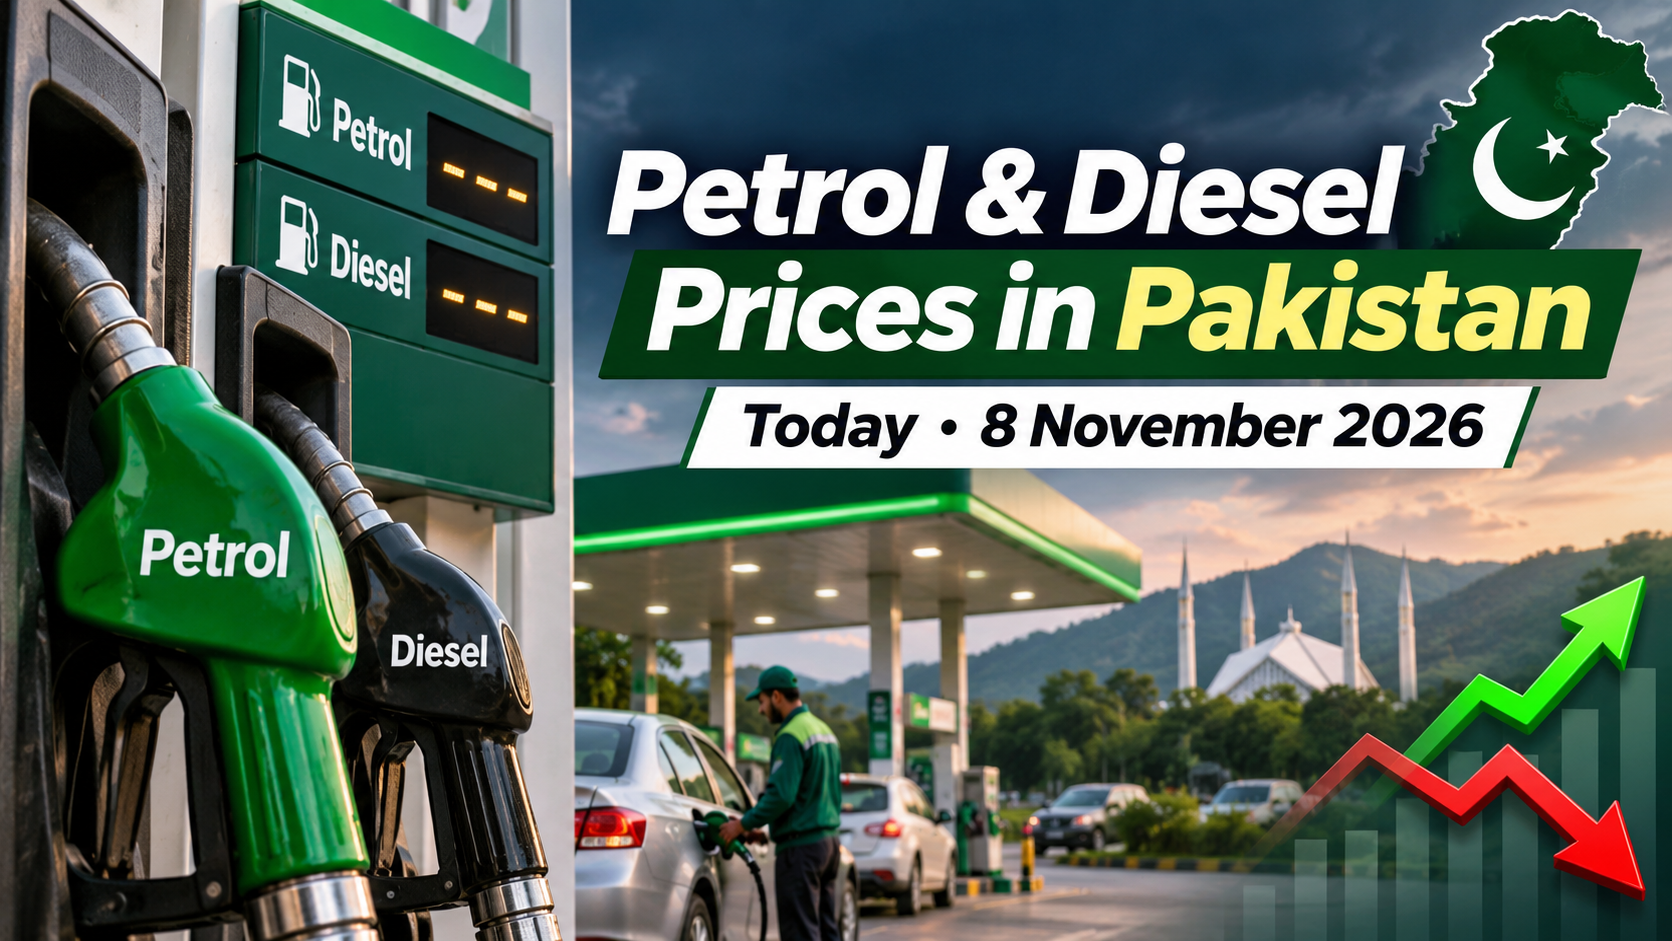
As of Sunday, 8 November 2026, the official Oil and Gas Regulatory Authority (OGRA) notified price of petrol (motor spirit) in Pakistan stands at Rs 346 per litre, while high-speed diesel (HSD) is priced at Rs 378 per litre. These rates came into effect from midnight on 7 November 2026 after a cut of Rs 6.59 in petrol and Rs 4.25 in diesel. The reductions continue a clear downward trend that began in late October and accelerated through the first week of November as international oil benchmarks softened.
This article provides the complete current price picture, explains the new daily pricing mechanism, traces 2026 price history, analyses the real-world impact on households and businesses, and outlines the outlook for the rest of the year.
Current Official Fuel Prices Effective 7–9 November 2026
The latest OGRA notification sets the following national ex-depot prices:
| Fuel Type | New Price (Rs/litre) | Change (Rs) | Previous Price | Effective Period |
|---|---|---|---|---|
| Petrol (Motor Spirit) | 346.00 | −6.59 | 352.59 | 7–9 Nov 2026 |
| High-Speed Diesel (HSD) | 378.00 | −4.25 | 382.25 | 7–9 Nov 2026 |
| Kerosene (SKO) | 308.52 | −15.15 | 323.67 | 7 Nov onwards |
| Light Diesel Oil (LDO) | 251.37 | −17.72 | 269.09 | 7 Nov onwards |
These figures have been widely reported by The News, Geo News, Business Recorder, and Dawn. Pump prices at individual stations are typically a few rupees higher because of inland freight costs that vary by location. OGRA also publishes city-wise pump prices for greater transparency.
High-octane blended component (HOBC) remains around Rs 415 per litre, set by individual oil marketing companies rather than a single OGRA rate. LPG cylinder prices are notified separately on a monthly basis and currently sit near Rs 294 per kg at the regulated maximum.
Why Prices Have Fallen in Early November 2026
Three main factors drove the recent cuts:
- Softer international oil prices. Brent crude has retreated from peaks above $100 per barrel earlier in the autumn as some geopolitical risk premium eased.
- Daily pricing mechanism. Since late October the government passes through changes in landed cost much more quickly.
- Refinery and premium differential adjustments. A portion of the benefit arising from premium differentials is being shared with consumers.
Earlier in the same week, OGRA had already announced larger cuts (Rs 9.41 for petrol and Rs 5.56 for diesel effective 6 November). The cumulative reduction from the late-October peak has been roughly Rs 28–32 for petrol within about ten days.
How the Daily Fuel Pricing Mechanism Works
On 30 October 2026 the federal cabinet approved a shift from the traditional fortnightly review to a daily fuel price revision system. The decision was taken against the backdrop of extreme volatility caused by the ongoing US-Israel-Iran tensions. Key features of the new system, as explained in official notifications and detailed by Express Tribune and Dawn, include:
- The import parity price is calculated on the actual landed cost of the relevant Pakistan State Oil (PSO) cargo rather than a fixed fortnightly average.
- A short-term premium differential adjustment (currently approximately $2.95 per barrel) is applied to smooth extreme daily swings.
- Refineries are required to surrender a portion of the differential into the petroleum levy account; the resulting benefit is passed on to consumers.
- The Petroleum Levy remains fixed at Rs 80 per litre for both petrol and diesel.
- An additional Climate Support Levy of Rs 5 per litre is still applied.
- Dealer margin is unchanged at Rs 9.98 per litre and oil marketing company margin at Rs 7.87 per litre.
- Prices are published on the OGRA website every day for public scrutiny.
The system improves transparency and allows faster relief when international prices fall. At the same time it means consumers can see price changes almost daily, which requires closer monitoring by transporters and households.
Detailed 2026 Price History and Volatility
Fuel prices in 2026 have been among the most volatile in the past decade. Compiled OGRA notification data shows:
- Petrol’s 2026 high was approximately Rs 398.96 in early October.
- The lowest point in the second half of the year was around Rs 315.80 on 21 July 2026.
- From 21 July to 7 November, petrol still rose overall by about 9.6% even after the recent cuts.
- Diesel followed a parallel path, peaking near Rs 424.92 in mid-September before declining to the present Rs 378.
Month-by-month summary (approximate closing levels):
| Month | Petrol (approx. end) | Diesel (approx. end) | Notable Events |
|---|---|---|---|
| July 2026 | 336 | 360 | Post-Eid recovery |
| August 2026 | 342 | 365 | Gradual rise |
| September 2026 | 387 | 400+ | Middle East escalation |
| October 2026 | 378–399 | 400–425 | Peak volatility |
| Early Nov 2026 | 346 | 378 | Daily mechanism + falling crude |
The sharp rises earlier in the year were directly linked to Brent crude trading above $100 per barrel for extended periods. Higher global freight rates and a relatively stable but still elevated USD/PKR rate (around 276–282) amplified the impact on local prices.
Real Economic Impact on Households, Transporters and Industry
Even modest cuts produce noticeable savings:
- A typical family car (40-litre tank filled once a week) saves approximately Rs 260–280 per week, or more than Rs 1,100 per month.
- Motorcycle users (5–8 litre tank) save Rs 30–55 per fill-up.
- Ride-hailing drivers and small transporters see improved margins.
- Goods transporters benefit most from the diesel cut; lower freight costs can gradually feed through into food and consumer goods prices, helping moderate inflation.
Despite the relief, absolute prices remain high. Petrol is still more than Rs 90 above early-2026 levels. Combined with the separate NEPRA fuel cost adjustment of Rs 2.37 per unit that will appear on November electricity bills, overall energy expenditure continues to pressure middle- and lower-income households. Analysts writing in Business Recorder and Profit by Pakistan Today note that sustained lower fuel prices could contribute to a further easing of core inflation (recently averaging 6–7%), but only if international prices remain soft for several more weeks.
Outlook for the Remainder of November and December 2026
Market participants and independent trackers expect continued volatility. Key variables:
- Brent crude trajectory. If crude stays below $95–98, further modest reductions are possible within the next 7–10 days. Any escalation in the Middle East could reverse the trend quickly.
- PSO cargo schedule and premiums. The exact landed cost of upcoming shipments will determine the next daily notifications.
- Exchange rate. The USD/PKR has been relatively stable near 276–282; any sharp depreciation would offset oil price declines.
- Government policy choices. Decisions on the petroleum levy, climate levy, or any temporary relief packages remain possible under the IMF programme.
Most observers currently lean toward a mildly positive short-term outlook for consumers, provided global supply conditions do not deteriorate.
Frequently Asked Questions
What is the petrol price in Pakistan today (8 November 2026)?
Rs 346 per litre according to the latest OGRA notification.
What is the current diesel price?
Rs 378 per litre.
Why do fuel prices change every day now?
The government adopted a daily review mechanism on 30 October 2026 to respond more quickly to global oil volatility.
Will prices rise again soon?
It depends on international oil prices, freight rates and the exchange rate. Monitor OGRA’s daily notifications.
Are there any consumer subsidies currently in place?
No broad-based consumer subsidies exist beyond the fixed levy structure. Targeted support measures remain under discussion.
How much has petrol fallen in the past ten days?
Roughly Rs 28–32 from late-October peaks, depending on the exact starting date.
Does the daily mechanism apply to LPG and kerosene?
Kerosene and light diesel oil are still adjusted less frequently; LPG follows a separate monthly notification process.
Detailed Breakdown of Price Components (November 2026)
Understanding why petrol costs Rs 346 requires looking beyond the headline number. According to the pricing formula used by OGRA and reported extensively by Business Recorder and Dawn, the final consumer price consists of several layers:
- Ex-refinery price / Import parity: This is the largest variable component and moves with international crude and product prices plus freight.
- Petroleum Levy: Fixed at Rs 80 per litre. This is a major revenue source for the federal government and is protected under the IMF programme.
- Climate Support Levy: Rs 5 per litre.
- Inland Freight Equalisation Margin (IFEM): Varies by location to equalise prices across the country.
- Dealer margin: Rs 9.98 per litre.
- OMC margin: Rs 7.87 per litre.
- Sales tax and other duties: Applied according to the prevailing regime.
Because the levy and margins are largely fixed, most of the daily movement comes from the import parity component. This is why a $5–6 drop in Brent crude can translate into a Rs 5–8 reduction at the pump once the daily mechanism is applied.
Comparison with Regional Prices
As of early November 2026, Pakistani fuel prices remain higher than several neighbouring and peer economies when adjusted for income levels:
- India (major cities): Petrol roughly equivalent to Rs 280–310 in Pakistani rupees after conversion.
- Bangladesh: Lower regulated prices with heavier subsidies.
- UAE and Saudi Arabia: Significantly lower (under Rs 200 equivalent) because of local production and subsidies.
- Sri Lanka: Has seen sharp reductions after earlier crises.
The gap is largely explained by Pakistan’s high petroleum levy, import dependence (over 80% of refined products or crude), and the exchange rate. Policymakers frequently cite the need to keep the levy high to meet fiscal targets while arguing that lower international prices should eventually provide relief.
Impact on Inflation and Monetary Policy
Fuel prices have a direct and indirect effect on inflation. Directly, they appear in the transport component of the CPI. Indirectly, they raise the cost of moving food, cement, steel, and consumer goods. The State Bank of Pakistan raised the policy rate by 50 basis points to 12% in late October 2026, citing elevated energy costs and the inflation outlook.
If the current downward trend in fuel prices persists for the next 4–6 weeks, it could ease pressure on the central bank and support a more stable inflation path into early 2027. Conversely, a rebound in oil prices would complicate the disinflation process and could force the SBP to maintain higher rates for longer. Independent analysis published by Profit and Business Recorder suggests that every sustained Rs 10 reduction in petrol contributes roughly 0.15–0.25 percentage points to lower headline inflation over a quarter, assuming no offsetting shocks.
What Consumers and Businesses Should Do Now
- Households: Consider filling tanks if further cuts are expected in the next few days, but avoid panic buying. Monitor OGRA’s website or reliable news sources daily.
- Transporters and logistics firms: Update freight rates cautiously. Many contracts allow pass-through of fuel costs; document the recent reductions.
- Businesses with high fuel intensity (manufacturing, agriculture, construction): Recalculate operating costs and review hedging or bulk-purchase options where available.
- Investors: Watch oil marketing companies and refineries for margin impacts. Lower prices can boost volume but squeeze refining margins if the differential narrows.
Frequently Asked Questions (Expanded)
Is the Rs 346 price the same in every city?
No. The OGRA rate is the ex-depot or base rate. Actual pump prices include inland freight, which is higher in northern and remote areas. Differences of Rs 3–8 per litre are common.
When will the next price announcement be made?
Under the daily mechanism, OGRA typically publishes the next day’s rate in the evening or late afternoon. Always check the official OGRA website or trusted news outlets.
Does the government still provide any fuel subsidy?
There is no general consumer subsidy. The government collects a high petroleum levy. Some targeted schemes for public transport or agriculture have been discussed but are not currently active on a large scale.
How does the current price compare with January 2026?
Petrol was near Rs 253 in January 2026. The present Rs 346 represents a substantial increase over the year despite the recent cuts.
Will electric vehicles become more attractive because of high fuel prices?
Yes. The combination of elevated petrol prices and the new Auto Policy 2026-31 incentives (1% sales tax on battery EVs and higher financing limits) is expected to accelerate EV adoption, especially among urban middle-class buyers.
Long-Term Structural Issues
Pakistan remains heavily dependent on imported petroleum products. Local refineries operate well below capacity, and new refining investments have been slow. The government has repeatedly stated that shifting toward electric vehicles, improving public transport, and eventually developing domestic energy resources are necessary to reduce vulnerability to global oil shocks. The recent Auto Policy and ongoing discussions around the National Electric Vehicle Policy are part of that longer-term strategy. Until those measures scale up, fuel price volatility will continue to affect the economy.
Conclusion
The latest OGRA cuts bring welcome and measurable relief after a prolonged period of elevated fuel prices. At Rs 346 for petrol and Rs 378 for diesel, Pakistani consumers are paying substantially less than they did in early October, though absolute levels remain high by historical standards. The new daily pricing system offers greater transparency and faster pass-through of international declines, but it also means more frequent adjustments. Households, transporters, logistics companies and policymakers will continue to watch global oil markets and OGRA notifications closely in the coming weeks. Sustained lower prices would support inflation moderation and household purchasing power, while any sharp rebound in crude would quickly reverse the gains under the current mechanism.
Discover more from The Economy
Subscribe to get the latest posts sent to your email.

The central development problem of 2026 is not simply a shortage of money. It is the gap between where finance is most urgently needed and where private and public capital is most willing to go. Many developing economies face expensive debt, exposure to climate shocks and large infrastructure needs at the same time that investors concentrate on a smaller group of countries and commercially familiar projects.
The UNCTAD World Investment Report 2026 says global FDI rose 6% to $1.6 trillion in 2025, but developing economies recorded only 2% growth, to $901 billion. More than 80% of global inflows went to the 20 largest recipients. This concentration matters because an aggregate recovery in investment can conceal a deterioration in access for smaller, poorer and climate-exposed countries.
Key takeaways
- Global investment has recovered unevenly; a handful of major recipients capture much of the growth.
- High sovereign yields increase the cost of financing long-lived infrastructure projects.
- Climate-finance goals are international commitments, not proof that money has already been delivered.
- Public guarantees and blended finance can mobilize investment but create fiscal risks if poorly designed.
- Pakistan and other climate-vulnerable economies need bankable projects, transparent procurement and financing terms that fit public balance sheets.
The paradox of rising global investment
A stronger headline FDI figure suggests that multinational companies have regained confidence. Yet location and purpose matter. The UNCTAD report shows that strategic sectors—including AI infrastructure, semiconductors, critical minerals and energy-transition technologies—accounted for 44% of announced greenfield project values in 2025, compared with 16% in 2020.
That does not mean the same share of projects are operating, or that employment and skill transfer have already materialized. Greenfield announcements refer to planned investment. The resulting development benefits depend on implementation, workforce integration, supplier networks and local regulatory conditions.
A large capital-intensive project can raise investment totals without producing substantial local employment. By contrast, a smaller power-distribution upgrade or irrigation investment might have broader productivity effects. Development policy must therefore be guided by outcomes, not project headline values.
How debt turns an investment gap into a development trap
A government may need to finance flood protection, transport networks, schools and electricity grids. When sovereign borrowing yields rise, debt servicing claims a greater share of future tax revenue. The government may then postpone maintenance or investment, reducing growth capacity and weakening the very revenue prospects that underpin debt sustainability.
This is a feedback loop, not a certainty for every borrowing country. The IMF’s October 2026 analysis of sovereign yields warns that high debt makes fiscal balances and market interest rates more sensitive to each other. Its April Fiscal Monitor reported global public debt just below 94% of GDP in 2025, projected to reach 100% by 2029 in that forecast vintage.
Global averages should not be used to label all developing economies insolvent. Debt sustainability depends on borrowing currency, maturity, interest costs, export earnings, domestic savings, tax capacity and creditor terms. A country with long-maturity concessional loans can have a very different risk profile from one refinancing short-term foreign-currency obligations at market rates.
For development projects, repayment risk can be even more nuanced. A new port may generate fees in foreign currency; an irrigation scheme may generate valuable social and productivity returns but relatively little direct cash flow. Both can be economically justified, yet they require different financing designs.
Climate finance: targets versus disbursements
At COP29 in 2024, countries agreed on a new climate-finance goal of at least $300 billion annually by 2035 for developing countries, with developed countries taking the lead, and a broader effort to scale total finance to $1.3 trillion per year by 2035. These commitments are described by the UN Climate Change secretariat.
The distinction between an announced goal and money actually disbursed cannot be overstated. A country facing flood risk in 2026 cannot pay for an embankment with a target set for 2035. It needs project preparation, agreed terms, implementation capacity and accessible funding now.
Finance also takes different forms: grants, concessional loans, guarantees, private investment and domestic budget allocations. A dollar of grant funding does not impose the same repayment burden as a dollar borrowed at commercial rates. Comparing climate-finance totals without identifying their form can mislead the public about the net benefit to recipients.
Adaptation is especially challenging because many protective projects generate benefits by avoiding future losses rather than collecting revenue. Protecting a town from flooding can be valuable to society while offering no direct income stream to repay a private investor. That is a strong case for carefully designed public or concessional funding, not evidence that the project is unproductive.
Four finance tools, four different obligations
| Instrument | Appropriate use | Advantage | Main caution |
|---|---|---|---|
| Grant | Socially essential, low-revenue adaptation | No debt repayment | Limited availability and donor conditions |
| Concessional loan | Infrastructure with public benefits | Lower-cost, longer-tenor finance | Still adds obligations |
| Public guarantee | Partially de-risking a viable private project | Can attract capital | Creates contingent government liability |
| Commercial investment | Projects with credible cash flows | Mobilizes private expertise and funds | Return requirements may be incompatible with affordability |
Original comparison. Appropriate financing depends on project economics and sovereign capacity.
A well-designed programme matches the financing instrument to a project’s cash flows and social returns. Governments should not ask commercial investors to deliver unremunerated public goods, nor should they use scarce grants to subsidize projects that would have proceeded profitably anyway.
The problem of bankability
A project can be economically sensible but financially unready. Investors want to know who owns the land, which authority sets tariffs, what happens if construction is delayed, whether contracts are enforceable and how foreign exchange can be accessed. Without answers, the cost of financing rises or the investment does not proceed.
Project preparation therefore deserves more attention than it receives. Reliable feasibility studies, credible demand forecasts, environmental safeguards, procurement transparency and clear risk allocation are themselves forms of economic infrastructure. They make public money more effective and reduce the need to compensate financiers for avoidable uncertainty.
The UNCTAD investment analysis emphasizes whether international investment builds productive capacity, jobs, skills and technology transfer. Those are better metrics of development success than the number of investment memoranda signed.
The climate–debt dilemma is also a timing dilemma
A flood barrier must be built before the storm. Drought-resistant irrigation must be maintained before harvest conditions deteriorate. Yet governments with financing constraints may postpone such investment because its payoff is uncertain in timing while the upfront cost is immediate and politically visible.
This creates a bias toward emergency relief after a disaster rather than resilience beforehand. International institutions can help by offering longer-maturity finance, technical support, credible insurance mechanisms and rapid access to grants when shocks occur. But financing arrangements should be published and independently scrutinized, especially when guarantees and contingent obligations are involved.
The UN DESA policy brief on the Middle East conflict and development finance underlines how geopolitical and energy shocks can reduce the room available for development investment. A country paying more for imported fuel has fewer funds left for climate protection, even before the next flood or drought arrives.
Pakistan: making resilience investable without mortgaging the future
Pakistan is exposed to external energy and financing shocks while facing major needs in irrigation, drainage, flood protection and electricity-sector reform. The IMF’s October 7 Pakistan assessment says reforms supported by the Resilience and Sustainability Facility include climate-aware public investment planning and disaster-risk financing. It reports a staff-level agreement, subject to Executive Board approval—not an automatic release of funds.
Three practical steps would improve outcomes. First, rank projects by avoided economic loss and realistic operating costs, not political visibility. Second, publish the full fiscal exposure of guarantees and contracts. Third, build local capability to maintain infrastructure after its ribbon-cutting moment. Climate resilience fails when maintenance is unfunded or responsibilities are fragmented between agencies.
Pakistan should also treat export growth and climate investment as complementary goals. A more reliable electricity network and less flood-prone logistics system can make businesses more productive as well as more resilient. The benefit is not confined to future disasters; it shows up in fewer outages, better delivery and lower uncertainty today.
A five-question test for every financing pledge
- Is the funding approved and disbursable, or only politically announced?
- Is it a grant, loan, guarantee or expected private investment—and who ultimately pays?
- Which institution owns implementation, procurement and subsequent maintenance?
- How will results be measured in employment, resilience, productivity or emissions?
- Could repayment or foreign-currency obligations crowd out essential spending later?
The point is not to reject international funding. It is to distinguish investment that expands development capacity from financing that merely moves risk into the future. Transparency helps lenders as well as citizens by reducing costly ambiguity.
Risks and uncertainties
FDI data are revised and announced projects may not be completed. Climate-finance accounting differs across sources and instruments. Borrowing costs can rise or fall quickly, and physical climate losses are difficult to forecast precisely. No financing mechanism eliminates governance risk; concessional funds can still be misallocated. A credible assessment must use country-level debt profiles and project-level cash flows rather than infer individual conclusions from global aggregate figures.
Frequently asked questions
Is global FDI increasing in 2026?
UNCTAD reports a rise in global FDI during 2025 in its 2026 report. That is historical data, not a statement that every country experienced an increase in 2026.
Why do poorer countries struggle to attract investment?
Financing costs, infrastructure constraints, market size, regulatory uncertainty and project preparation can all affect investor decisions.
Is the $300 billion climate-finance goal already being paid annually?
No. The COP29 goal concerns annual finance by 2035; actual commitments and disbursements must be measured separately.
What is concessional finance?
Finance on more favourable terms than typical commercial borrowing, often involving lower interest rates or longer repayment periods.
Can climate projects increase debt risk?
Yes, if financed with unsuitable loans or guarantees; but well-designed investments can also reduce losses and strengthen productivity.
What should Pakistan prioritize?
High-value resilience projects, transparent financing terms, credible maintenance plans and export- and energy-related productivity gains.
Conclusion
The investment divide cannot be closed through pledges alone. Developing economies need capital that arrives on viable terms and builds useful assets, while financiers need transparent projects and credible repayment structures. The most important test of the global development system in 2026 is whether it can channel resources toward genuine resilience without making vulnerable countries more financially fragile.
Discover more from The Economy
Subscribe to get the latest posts sent to your email.

Nvidia Stops Reporting Singapore Revenue After It Hit 22% of Sales: What Investors Need to Know

Global Trade and Tariffs 2026:WTO Barometer Still Shows Growth

Extended Producer Responsibility Changes and the UK Hospitality Sector

GDP and Economic Growth in the US: How It’s Measured, Current Trends

Economic Globalization: How Global Trade Shapes the US Economy, Jobs, and Consumers

Best Life Insurance Companies in the United States 2026: Our Top 5 Picks

Pakistan Auto Policy 2026-31 Explained: EV Tax Cuts, $6 Billion Export Target

When Dollar Debt and Food Imports Collide: The Currency Squeeze

Why Freight and Storage Costs Keep Food Prices High After Oil Falls

Personal Injury Lawyer Near Me in NYC: How to Find the Right Attorney After an Accident

Why Falling World Food Prices Do Not Always Lower Grocery Bills

Oil Shocks and Core Inflation: Why the Two Move Differently

Singapore Cannot Fight Financial Fraud by Making Victims Bear the Risk Alone

Singapore Banking’s Real Test: Beyond Profits, Who Will Safeguard Financial Trust?

Dow Jones Today: Dow Slips 237 Points After the Worst Day Since April 2025

US–Iran Conflict in October 2026: Hormuz, Oil Prices and Diplomacy

Pakistan IMF Programme 2026: Why Bailouts Keep Returning

SSI November 2026 Payment: Why Benefits Arrive October 30

US–China AI Export Controls in 2026: Chips, Testing Rules and Corporate Risk

2027 Federal Tax Brackets: New IRS Rates and Standard Deductions Explained

Singapore Stock Market Outlook 2027: The STI’s Bank-and-Yield Test

World Bank Debt Report 2026: The $9.4 Trillion Burden Behind the Recovery

Stock Market Crash 2026? What the November Rout Actually Tells Us

IMF Global Outlook 2027: The Recovery Is Real, but the Divide Is Growing

KSE-100 Index 2026: Is Pakistan’s Stock-Market Recovery Sustainable?

Germany–France ‘Made in Europe’ Deal Could Reshape China’s EV Ambitions

Power Grid Emergency Across 13 States? What the October 2026 PJM Order Actually Says

Global Markets Today: The AI Sell-Off Has Become a Test of Liquidity
-

 Markets & Finance10 months ago
Top 15 Stocks for Investment in 2026 in PSX: Your Complete Guide to Pakistan’s Best Investment Opportunities
-

 Analysis9 months ago
Johor’s Investment Boom: The Hidden Costs Behind Malaysia’s Most Ambitious Economic Surge
-

 Analysis9 months ago
Top 10 Stocks for Investment in PSX for Quick Returns in 2026
-

 Banks10 months ago
Best Investments in Pakistan 2026: Top 10 Low-Price Shares and Long-Term Picks for the PSX
-

 Analysis9 months ago
Brazil’s Rare Earth Race: US, EU, and China Compete for Critical Minerals as Tensions Rise
-

 Investment10 months ago
Top 10 Mutual Fund Managers in Pakistan for Investment in 2026: A Comprehensive Guide for Optimal Returns
-

 Global Economy11 months ago
15 Most Lucrative Sectors for Investment in Pakistan: A 2025 Data-Driven Analysis
-

 Global Economy11 months ago
Pakistan’s Export Goldmine: 10 Game-Changing Markets Where Pakistani Businesses Are Winning Big in 2025