
currency
When Dollar Debt and Food Imports Collide: The Currency Squeeze


In brief: Food-importing economies with substantial dollar liabilities can face a double squeeze: foreign-currency debt service rises in local-currency terms when their currency weakens, while imported grain and fuel also become costlier. Fiscal choices can become harder just when food support is most needed. This guide draws on World Bank October 2026 commodity outlook and identifies where an individual case needs additional checks.
Published commodity indexes describe wholesale market movements; exchange rates, transport and the contents of a national food basket determine how households feel those movements.
Information relevant to how dollar debt affects food import costs can be misread when a national guideline, an industry average and a reader’s particular situation are presented as though they are identical. The starting point is the dated evidence. The FAO Food Price Index, November 2026 release provides wider context, while the specific details below explain the limits of a simple answer.
Debt repayments and trade invoices compete for scarce foreign exchange. Where reserve buffers are thin, financing costs may rise, and importers may struggle to secure letters of credit. This is a macro-financial channel, not proof that all food importers are denied foreign currency.
This creates a useful distinction between a headline measure and the outcome that matters. The former can be quoted publicly; the latter may depend on timing, eligibility, contract terms, geography or equipment. A careful analysis names each moving part instead of pretending the same rule produces an identical result for everyone.
A government that must pay $1 billion of interest will need more domestic currency after a depreciation if its payment obligation is fixed in dollars. Separately, mills importing wheat will convert their own dollar invoices at the weaker rate. Those two exposures affect different budgets but can reinforce pressure on households.
The example isolates a particular assumption rather than claiming to reproduce every real-world case. Change the date, price, document category or other relevant input and the conclusion may change. Readers should use the calculation or scenario as a transparent method for asking better questions, not as a substitute for primary records.
What to check in practice
Separate public external debt from private importer borrowing, and check reserves, maturity schedules and invoice currencies. A headline debt-to-GDP number does not reveal near-term dollar cash needs. Pair your analysis with institutional data and local import licensing rules.
| Evidence | Where to look | What it establishes |
|---|---|---|
| Governing principle | World Bank October 2026 commodity outlook | The baseline rule or measured relationship |
| Broader context | FAO Food Price Index, November 2026 release | The date and wider background |
| Your individual position | Domestic prices, contracts and country-level official statistics | Whether the general explanation applies in practice |
A source can be authoritative and still be too broad to settle an individual case. When multiple documents or measurements disagree, check whether they refer to different periods, populations, definitions or activities before deciding that one must be wrong.
Where a simple answer becomes misleading
An economy can borrow internationally while sustaining affordable food if revenue, reserves and policy frameworks are strong. Avoid presenting every currency fall as a debt crisis, or treating a forecast currency rate as an observed transaction rate.
These qualifications are not minor technicalities. They are often the difference between a useful guide and a confident headline that sends the reader in the wrong direction. The safest recommendation is to describe the relevant condition precisely and then give readers a way to verify it themselves.
What the available evidence does and does not establish
World Bank commodity analysis explains the trade shock; the country’s sovereign filings and balance-of-payments releases are needed to quantify the debt component. The final judgement must be specific to each economy.
The FAO Food Price Index methodology helps corroborate the wider subject, but it cannot authenticate a reader’s private documents, bills, contractual obligations or travel plan. Where the article includes an illustrative calculation, the assumptions are labelled. Where it concerns a live rule or future schedule, the controlling institution should be consulted again immediately before use.
For an independent news report on the October 2026 commodity outlook, see Reuters: World Bank October 2026 commodity outlook. This news account adds context; it is not a substitute for the directly applicable institutional source.
A short verification checklist
- Start with the specific evidence: Separate public external debt from private importer borrowing, and check reserves, maturity schedules and invoice currencies.
- Challenge the default assumption: An economy can borrow internationally while sustaining affordable food if revenue, reserves and policy frameworks are strong.
- Check the scope of the published material: World Bank commodity analysis explains the trade shock; the country’s sovereign filings and balance-of-payments releases are needed to quantify the debt component.
- Confirm the current version: Revisit the World Bank October 2026 commodity outlook and the original dated guidance before making an irreversible decision.
Frequently asked questions
What is the key principle?
Food-importing economies with substantial dollar liabilities can face a double squeeze: foreign-currency debt service rises in local-currency terms when their currency weakens, while imported grain and fuel also become costlier. The relevant primary reference is World Bank October 2026 commodity outlook.
What would change the answer?
An economy can borrow internationally while sustaining affordable food if revenue, reserves and policy frameworks are strong. Avoid presenting every currency fall as a debt crisis, or treating a forecast currency rate as an observed transaction rate.
What should I verify before relying on this?
Separate public external debt from private importer borrowing, and check reserves, maturity schedules and invoice currencies. A headline debt-to-GDP number does not reveal near-term dollar cash needs. Pair your analysis with institutional data and local import licensing rules.
The bottom line
Food-importing economies with substantial dollar liabilities can face a double squeeze: foreign-currency debt service rises in local-currency terms when their currency weakens, while imported grain and fuel also become costlier. World Bank commodity analysis explains the trade shock; the country’s sovereign filings and balance-of-payments releases are needed to quantify the debt component.
Discover more from The Economy
Subscribe to get the latest posts sent to your email.



With the September 24, 2026, US-China trade truce extended rather than permanently resolved, Citibank and institutional peers are pricing dólar estadounidense forecasts around a narrow, event-driven volatility window. For cross-border businesses and remittance senders, this compressed timeline shifts the focus from a clean directional currency bet to active hedging ahead of the new Q1 2027 deadline.
Why Citibank Is a Bellwether for Dólar Estadounidense Direction
Citibank’s global markets desk remains one of the most-cited authorities in dollar-peso forecasting due to its dual footprint: a deep US retail and corporate banking presence combined with one of the most extensive correspondent-banking networks across Latin America. When Citibank’s macroeconomic strategists adjust their USD/MXN forecasts, remittance companies, importers, and forex retail platforms typically follow suit within days. Therefore, tracking Citibank’s post-summit positioning offers a highly accurate proxy for where institutional capital expects the dollar to move next.
The September 24 Trade Truce Extension: What Changed
The September 24 Trump-Xi summit at the White House did not yield the durable macroeconomic trade agreement some forex analysts had priced in. Instead, US Treasury Secretary Scott Bessent confirmed a roughly two-month extension of the existing tariff pause, which had been originally set to lapse in November 2026. Analysts at preview briefings—including China specialists at CSIS—had already flagged rare-earth export controls and AI technology restrictions as the most difficult hurdles, which proved accurate.
For currency desks, an “extension-without-resolution” sends a specific technical signal: it eliminates the tail risk of an immediate, severe trade-war escalation, but maintains the uncertainty premium that emerging market currencies have priced in since the spring. This explains the sharp, localized spike in the USD/MXN pair following the September 24 announcement, as traders unwound overly optimistic positions and re-priced for continued negotiations.
Dólar Estadounidense: Current Post-Summit Positioning
Data updated as of late September 2026.
| Metric | Current Reading / Forecast | Market Context |
| USD/MXN Spot Rate | ~17.65–17.70 pesos per dollar | Spiked from 16.95 in mid-September following the Sept 24 summit. |
| USD 12-Month Change vs. Peso | Dollar down ~2% year-over-year | Late September volatility has narrowed the dollar’s YOY deficit. |
| Citi Analyst Survey (Year-End 2026) | ~17.50 pesos per dollar | Indicates expectations of slight stabilization. |
| Monex House Forecast (2026) | ~17.80 pesos per dollar | Pricing a higher geopolitical risk premium into Q4. |
Sources: Banxico FIX rate reporting; Citi Encuesta de Expectativas survey of 37 institutions; Monex economic research.
Why the Peso Remained Historically Strong in 2026
Despite the immediate post-summit dollar spike, the peso mexicano has maintained a broader resilience through much of 2026. Three macroeconomic forces explain this dynamic:
- Persistent Carry-Trade Demand: Even with central bank adjustments, Mexico’s benchmark interest rate remains significantly higher than the US Federal Reserve’s rate. This spread keeps peso-denominated sovereign debt highly attractive to yield-seeking capital.
- Resilient Remittance and Nearshoring Flows: Despite US-China trade friction, North American supply chain integration (nearshoring) and the US-Mexico goods trade have remained robust, ensuring structural dollar inflows into Mexico.
- A Weaker Broad Dollar Trend: Tied to the broader Fed easing cycle, the dollar has occasionally softened against a basket of global currencies, limiting its ability to achieve runaway momentum against the peso.
Citibank’s Forex Playbook for the Rest of 2026
Institutional desks like Citibank are advising corporate clients to treat the current Q4 window as a critical hedging opportunity rather than a speculative directional bet. With the new truce deadline landing in the opening weeks of Q1 2027, volatility will likely cluster around that date regardless of the ultimate macroeconomic outcome.
Practical takeaways for cross-border exposure:
- Lock in Forward Contracts: Secure forex pricing before the Q1 2027 truce deadline if your business has scheduled cross-border payments in that window.
- Monitor the 10-Year Treasury Yield: Yields have acted as a more responsive, real-time indicator of trade-risk pricing this year than delayed central bank statements.
- Track the Remittance Corridor: Treat US-Mexico remittance-corridor pricing as directional context; it is one of the most liquid, closely watched proxies for broader dollar sentiment.
Q4 2026 to Q1 2027 Predictive Scenarios
| Scenario | Anticipated USD/MXN Path | Market Probability |
| Base Case: Truce holds into Q1 2027, talks continue | Peso stabilizes near the 17.40–17.70 range | Highest |
| Tail Risk: Truce collapses before the new deadline | Dollar spikes toward 18.50+ on safe-haven risk-off flows | Moderate |
| Bullish Surprise: Durable US-China deal reached | Peso strengthens back toward 16.50–16.90 | Low (Near-term) |
Frequently Asked Questions
What is the dólar estadounidense worth in pesos today?
Following the late-September 2026 summit volatility, the dollar is trading in the 17.65–17.70 peso range, up from sub-17.00 levels earlier in the month. Because forex markets fluctuate continuously, always confirm against Banxico’s FIX rate or a live institutional feed before executing a transfer.
Why does a US-China summit affect the Mexican peso?
While Mexico is not a direct party to the Xi-Trump negotiations, US-China trade tension directly impacts the broad US dollar index and global risk appetite. These macroeconomic shifts immediately spill over into every dollar-paired emerging market currency, including the highly liquid Mexican peso.
Is now a good time to send money via the US-Mexico remittance corridor?
For dollar earners sending money to Mexico, the late-September bump to ~17.67 pesos per dollar offers slightly better purchasing power than the mid-September lows. However, timing depends heavily on individual cash-flow needs rather than attempts to perfectly time geopolitical news cycles.
Discover more from The Economy
Subscribe to get the latest posts sent to your email.
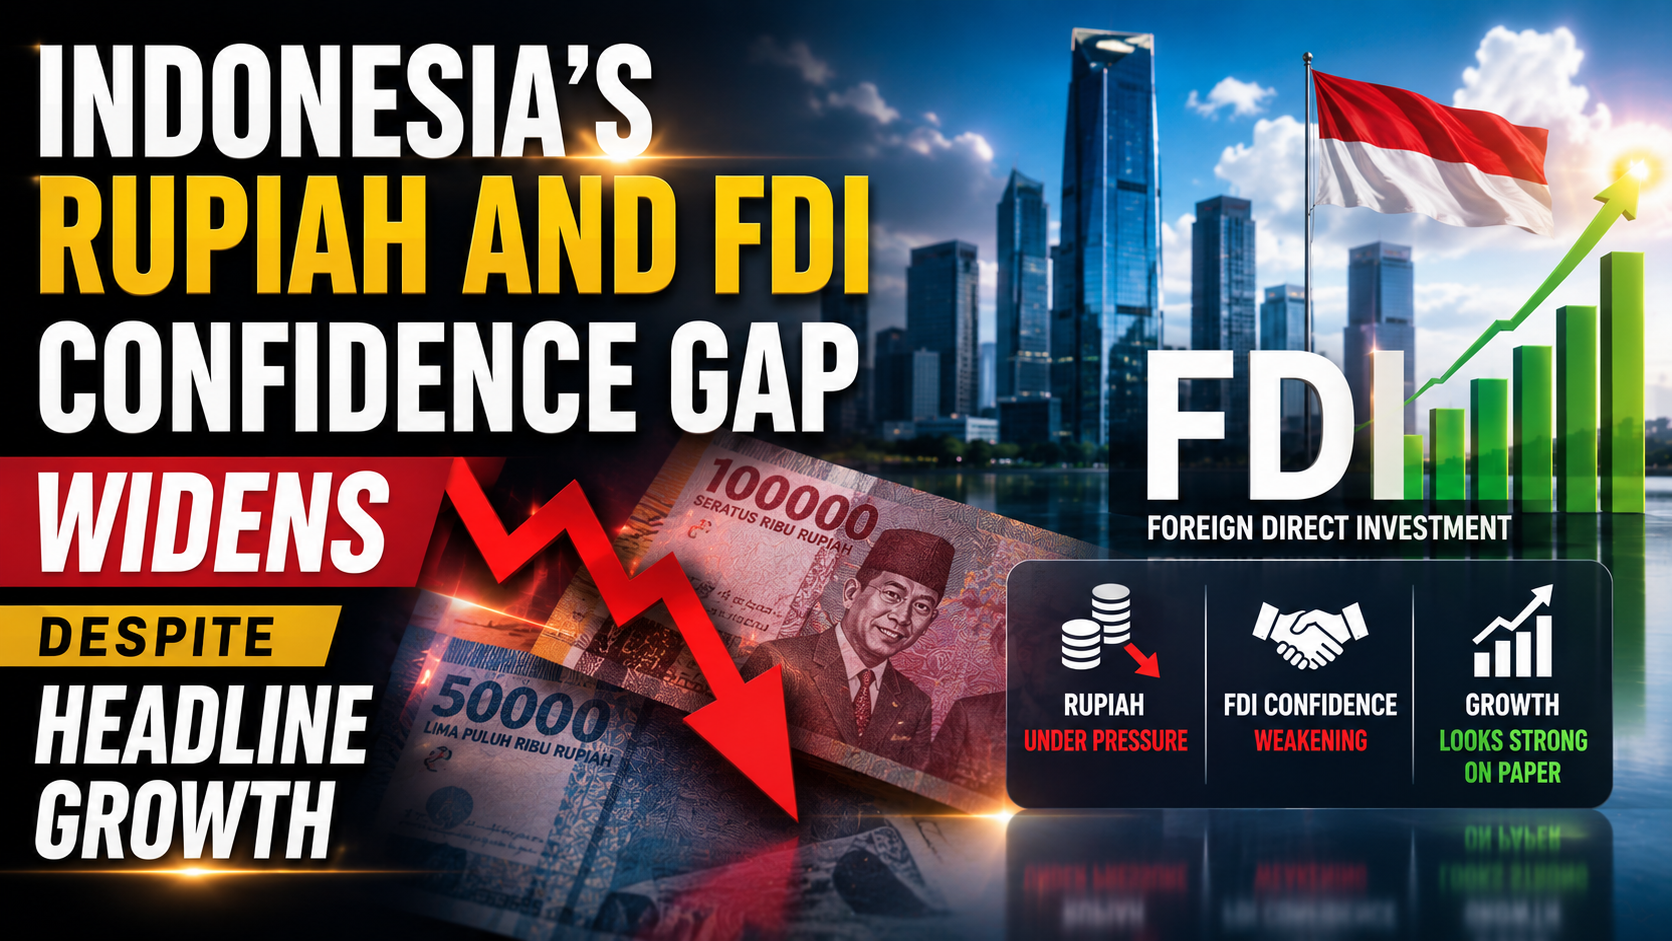
Indonesia’s official data shows resilient FDI, but independent analysts see a 26% FDI contraction and record-low rupiah levels. Here’s the real story behind the conflicting numbers.
Key Takeaways
- Indonesia’s official data (BKPM) shows Q1 2026 FDI at IDR250 trillion, up modestly and framed as FDIevidence investor confidence “remains strong.”
- Independent regional analysis from Krungsri puts the picture very differently — describing net FDI contracting 26% year-on-year in Q1 2026 amid deteriorating investor sentiment.
- The rupiah has repeatedly hit record lows despite Bank Indonesia intervention, even as GDP growth held at 5.6% in Q1 2026.
- Q2 2026 data shows a rupiah rebound tied to a reported 27.4% year-on-year FDI surge — a swing that itself illustrates how volatile the confidence signal has become.
- A 32% US tariff on key Indonesian exports, including textiles, electronics and furniture, adds a further headwind to the FDI outlook.
Indonesia’s investment story depends heavily on which data source you read. Official government messaging is unambiguously positive: per Tempo, Indonesia’s Investment Coordinating Board (BKPM) reported FDI reaching Rp250 trillion (about $15.4 billion) in Q1 2026, contributing 50.1% of total investment realization, with a BKPM spokesperson explicitly arguing that investor confidence “should not be measured solely by short-term financial market movements” and that sustained FDI growth “proves that global investors’ confidence in Indonesia remains strong.”
Independent regional analysis tells a considerably less reassuring story about the same period.
The disconnect is stark and worth stating plainly, because it’s the genuine content gap in existing coverage. Per Krungsri’s regional research, as investor sentiment continued to deteriorate through the year, net FDI actually contracted by 26% year-on-year in Q1 2026 — a figure suggesting the confidence shock had moved beyond financial markets into real investment decisions. The same analysis notes equities had fallen sharply, the rupiah had repeatedly hit record lows despite continued Bank Indonesia intervention, and government bond yields had risen as investors demanded a higher risk premium for holding Indonesian assets. Krungsri’s assessment of the underlying economy is nuanced rather than alarmist: GDP growth reached 5.6% in Q1 2026, but a closer look at the growth composition suggests much of the momentum came from fiscal stimulus and temporary factors rather than durable private investment — meaning the resilient headline growth number may not be sustainable once those supports fade.
Official BKPM data for the following quarter appears to support a more optimistic reading, though the comparison methodology differs. Per Indonesia-Investments’ coverage of BKPM’s H1 2026 report, Q2 2026 FDI realization reached IDR257.7 trillion, with total H1 investment of IDR1,010.6 trillion meeting nearly half the annual target — and, notably, Hong Kong overtook other sources to become the top FDI origin in Q2, at $5 billion, with Investment Minister Rosan Roeslani noting Chinese investment has become more aggressive via Hong Kong for the first time in a decade, partly channeled through Singapore-based subsidiaries as well.
Currency markets registered a genuinely sharp swing around this same data. Per FXStreet, the rupiah strengthened on a reported 27.4% year-over-year surge in Q2 FDI — a dramatically different trajectory from the 26% Q1 contraction Krungsri had described just weeks earlier, illustrating just how sensitive currency and confidence readings are to which quarter’s data and which source’s framing gets cited.
Structural headwinds remain layered on top of this volatility. Analysis from GBG Indonesia points to a 32% US tariff on key Indonesian exports — including textiles, electronics and furniture — set to take effect unless negotiations succeed, a risk that has itself contributed to rupiah selling pressure and reserve concerns, alongside inflation that climbed to 5.2% year-on-year in mid-2025, above Bank Indonesia’s 2-4% target range.
Why It Matters
Indonesia’s is a genuinely rare case where a country’s own official investment data and independent regional research diverge sharply on direction, not just magnitude — a distinction that matters enormously for how investors, and Indonesia’s ASEAN neighbors sizing up their own competitive position, should read the country’s underlying economic trajectory.
Data and Evidence
- BKPM Q1 2026 FDI: IDR250 trillion (~$15.4bn), 50.1% of total investment
- Krungsri’s Q1 2026 estimate: net FDI contracted 26% YoY
- Q1 2026 GDP growth: 5.6%
- Q2 2026 FDI (BKPM): IDR257.7 trillion; reported YoY growth of 27.4% per FXStreet
- Threatened US tariff on key exports: 32%
- Mid-2025 inflation: 5.2% YoY, above the 2-4% target band
Global Impact
Indonesia’s confidence volatility is a bellwether for how ASEAN’s largest economy is absorbing simultaneous pressure from US tariff threats and regional geopolitical shocks — a contrast worth reading alongside Malaysia’s (Article 10) and Singapore’s (Article 9) considerably steadier growth trajectories over the same period.
What Happens Next
Watch whether the Q2 FDI rebound BKPM reported holds up in Q3 data, whether the threatened 32% US tariff takes effect or gets negotiated down, and whether Bank Indonesia’s rupiah interventions stabilize the currency without depleting reserves.
Frequently Asked Questions
Is Indonesia’s FDI growing or shrinking?
Depends on the source and quarter — official BKPM data shows growth, while independent Q1 2026 analysis from Krungsri described a 26% year-on-year contraction; Q2 data shows a rebound.
Why has the rupiah been so volatile?
A combination of shifting FDI sentiment, Middle East-driven risk aversion, and looming US tariff threats on Indonesian exports.
What’s driving Indonesia’s resilient GDP growth despite the confidence concerns? Largely fiscal stimulus and temporary factors, according to Krungsri’s analysis, rather than durable private investment.
Which country became Indonesia’s top FDI source in Q2 2026? Hong Kong, at $5 billion, reflecting more aggressive Chinese investment channeled partly through Hong Kong and Singapore.
What tariff risk does Indonesia face? A potential 32% US tariff on textiles, electronics and furniture exports unless negotiations succeed.
Discover more from The Economy
Subscribe to get the latest posts sent to your email.
Indonesia’s economy just posted its best quarterly performance since 2023, but the central bank’s response to that strength tells a more cautious story than the headline number suggests — one with direct implications for anyone tracking capital flows into Southeast Asia’s largest economy.
The Growth Number
Indonesia’s economy expanded by 5.61 percent in the first quarter of 2026, its fastest pace in more than three years, according to McKinsey’s Southeast Asia quarterly review, boosted by a surge in government spending and strong household consumption tied to the Eid festive period. The Asian Development Bank’s July outlook has since nudged its own 2026 forecast for Indonesia higher by half a percentage point to 3 percent for the year, while separately projecting Indonesia’s growth to hold stable at 5.2 percent in both 2026 and 2027 in its base scenario — reflecting how much forecasts vary depending on the specific window and methodology used.
Why Bank Indonesia Is Playing It Safe
Despite the strong print, Bank Indonesia has kept its benchmark policy rate unchanged at 4.75 percent for a seventh consecutive meeting, prioritising rupiah stability over further easing in the face of external volatility. The central bank has explicitly signalled readiness to step up both onshore and offshore foreign exchange intervention to defend the currency and keep inflation within its 2026–2027 target range — a notably defensive posture for an economy growing at its fastest pace in years.
That caution is paying off on the capital-flow side. Foreign direct investment into Indonesia grew for a second consecutive quarter, rising 8.1 percent to 249.9 trillion rupiah, or roughly $14.5 billion, in the first quarter of 2026.
How fast is Indonesia’s economy growing in 2026?
Indonesia’s GDP grew 5.61% in Q1 2026, its fastest pace in more than three years, driven by government spending and Eid-season consumption, while Bank Indonesia held its policy rate at 4.75% to protect the rupiah amid regional currency volatility.
The Singapore Connection
Much of that capital has a specific source: Singapore. Indonesia’s Coordinating Minister for Economic Affairs, Airlangga Hartarto, confirmed that Singapore’s investment in Indonesia reached approximately $17.4 billion in 2025, calling the city-state “a reliable partner,” with investment into the Batam-Bintan-Karimun corridor specifically reaching $5.7 billion in 2025, up from the prior year. The two governments are now expanding cooperation into the digital economy and green energy, alongside a Young Farmer Development Program launched in June 2026 aimed at deepening agricultural technology ties.
The Regional Context
Indonesia’s performance sits within a broader Southeast Asian picture that is, in McKinsey’s own framing, showing “signs of softening” even as growth foundations remain broadly stable, with higher costs, currency volatility and weaker external demand weighing on households and businesses across the region. Cushman & Wakefield’s Southeast Asia Outlook similarly frames the region as expanding 4.8 percent in 2025 before slowing to a projected 4.3 percent in 2026, citing resilient domestic consumption and moderating interest rates as the main supports.
The ADB’s own assessment is blunter about the source of the regional drag: the Strait of Hormuz-linked Middle East conflict is weighing more heavily on developing Asia than previously anticipated, with higher energy costs, supply disruptions and tighter financial conditions expected to dampen growth in the months ahead even as inflation broadens and stays elevated for longer than earlier forecast.
What It Means for Investors
Indonesia’s combination of strong headline growth, disciplined currency management, and deepening Singapore-anchored capital inflows makes it one of the more structurally sound growth stories in Southeast Asia heading into the second half of 2026 — provided Bank Indonesia’s defensive rate stance succeeds in insulating the rupiah from the broader regional energy-price shock now working through the system.
Discover more from The Economy
Subscribe to get the latest posts sent to your email.

When Dollar Debt and Food Imports Collide: The Currency Squeeze

Why Freight and Storage Costs Keep Food Prices High After Oil Falls

Personal Injury Lawyer Near Me in NYC: How to Find the Right Attorney After an Accident

Why Falling World Food Prices Do Not Always Lower Grocery Bills

Oil Shocks and Core Inflation: Why the Two Move Differently

Singapore Cannot Fight Financial Fraud by Making Victims Bear the Risk Alone

Singapore Banking’s Real Test: Beyond Profits, Who Will Safeguard Financial Trust?

Nvidia’s Share Price Is Not a Scorecard for Singapore’s AI Future

The Australian Dollar Is Not Asia’s Oracle. Singapore Should Listen Anyway

Singapore’s Bank Sell-Off Is Really a Test of What Stability Is Worth

Why a Weaker Currency Makes Imported Food More Expensive

How Oil Price Shocks Raise Food Prices in Importing Countries

Petrol and Diesel Prices in Pakistan Today: Complete Update for 9 November 2026

Wall Street’s Renminbi Paradox: Banks, Beijing and the Dollar

Stock Market Crash in 2026? Warning Signs, Scenarios and a Calm Investor Checklist

US–Iran Conflict in October 2026: Hormuz, Oil Prices and Diplomacy

Dow Jones Today: Dow Slips 237 Points After the Worst Day Since April 2025

Pakistan IMF Programme 2026: Why Bailouts Keep Returning

SSI November 2026 Payment: Why Benefits Arrive October 30

US–China AI Export Controls in 2026: Chips, Testing Rules and Corporate Risk

2027 Federal Tax Brackets: New IRS Rates and Standard Deductions Explained

EU-China Trade Deal 2026: How Beijing and Brussels Avoided a Trade War—and Who Wins

Singapore Stock Market Outlook 2027: The STI’s Bank-and-Yield Test

Stock Market Crash 2026? What the November Rout Actually Tells Us

World Bank Debt Report 2026: The $9.4 Trillion Burden Behind the Recovery

IMF Global Outlook 2027: The Recovery Is Real, but the Divide Is Growing

KSE-100 Index 2026: Is Pakistan’s Stock-Market Recovery Sustainable?

Germany–France ‘Made in Europe’ Deal Could Reshape China’s EV Ambitions
-

 Markets & Finance10 months ago
Top 15 Stocks for Investment in 2026 in PSX: Your Complete Guide to Pakistan’s Best Investment Opportunities
-

 Analysis9 months ago
Johor’s Investment Boom: The Hidden Costs Behind Malaysia’s Most Ambitious Economic Surge
-

 Analysis9 months ago
Top 10 Stocks for Investment in PSX for Quick Returns in 2026
-

 Banks10 months ago
Best Investments in Pakistan 2026: Top 10 Low-Price Shares and Long-Term Picks for the PSX
-

 Analysis9 months ago
Brazil’s Rare Earth Race: US, EU, and China Compete for Critical Minerals as Tensions Rise
-

 Investment10 months ago
Top 10 Mutual Fund Managers in Pakistan for Investment in 2026: A Comprehensive Guide for Optimal Returns
-

 Global Economy11 months ago
15 Most Lucrative Sectors for Investment in Pakistan: A 2025 Data-Driven Analysis
-

 Global Economy11 months ago
Pakistan’s Export Goldmine: 10 Game-Changing Markets Where Pakistani Businesses Are Winning Big in 2025