
Food Security
Why Falling World Food Prices Do Not Always Lower Grocery Bills

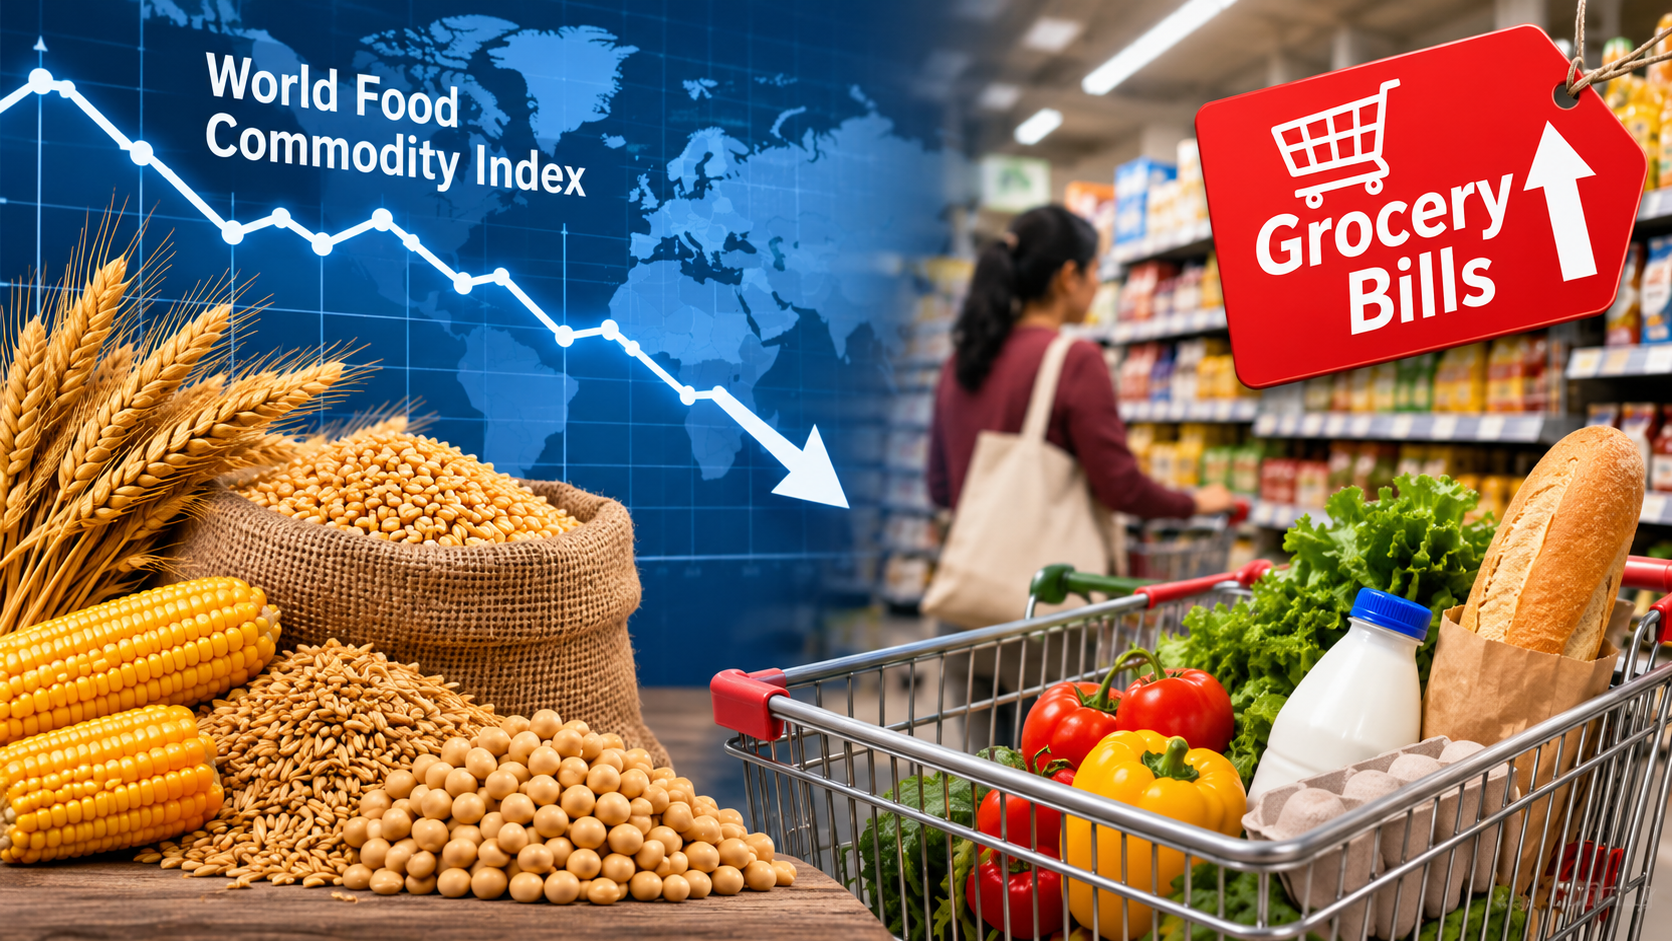
The FAO Food Price Index tracks international commodity quotations, not the total cost of the weekly supermarket basket. Shoppers can continue paying more because of earlier price increases, exchange-rate moves, local transport costs and slow changes in retail contracts. This guide draws on World Bank October 2026 commodity outlook and identifies where an individual case needs additional checks.
Published commodity indexes describe wholesale market movements; exchange rates, transport and the contents of a national food basket determine how households feel those movements.
Information relevant to world food commodity index versus supermarket prices can be misread when a national guideline, an industry average and a reader’s particular situation are presented as though they are identical. The starting point is the dated evidence. The FAO Food Price Index, November 2026 release provides wider context, while the specific details below explain the limits of a simple answer.
A global index is an average across selected traded commodity groups. A retail food index measures actual consumer purchases including local production, processing, packaging and distribution. Their baskets, currencies, weights and dates differ, so direct month-to-month comparisons can be misleading.
This creates a useful distinction between a headline measure and the outcome that matters. The former can be quoted publicly; the latter may depend on timing, eligibility, contract terms, geography or equipment. A careful analysis names each moving part instead of pretending the same rule produces an identical result for everyone.
If world wheat quotations decline by 5%, a packaged bakery item will not necessarily become 5% cheaper: flour is only one input, and the shop may still be using higher-cost inventory. A decline in a price level also differs from a slower rate of increase.
The example isolates a particular assumption rather than claiming to reproduce every real-world case. Change the date, price, document category or other relevant input and the conclusion may change. Readers should use the calculation or scenario as a transparent method for asking better questions, not as a substitute for primary records.
Compare the FAO measure with the country’s food CPI and wholesale prices on a shared timeline. Add exchange rates and seasonal harvest information. Label which figures refer to levels, percentage changes and annual inflation, so readers do not confuse a declining index with falling store prices.
| Evidence | Where to look | What it establishes |
|---|---|---|
| Governing principle | World Bank October 2026 commodity outlook | The baseline rule or measured relationship |
| Broader context | FAO Food Price Index, November 2026 release | The date and wider background |
| Your individual position | Domestic prices, contracts and country-level official statistics | Whether the general explanation applies in practice |
A source can be authoritative and still be too broad to settle an individual case. When multiple documents or measurements disagree, check whether they refer to different periods, populations, definitions or activities before deciding that one must be wrong.
Where a simple answer becomes misleading
Beware the claim that a lower FAO reading proves governments or retailers are hiding an immediate saving. In reality, product composition, taxes, production costs and inventory turnover can explain some of the difference; any accusation needs separate evidence.
These qualifications are not minor technicalities. They are often the difference between a useful guide and a confident headline that sends the reader in the wrong direction. The safest recommendation is to describe the relevant condition precisely and then give readers a way to verify it themselves.
What the available evidence does and does not establish
The FAO’s 6 November 2026 release reports a 1.2% monthly fall in its international food index, but that is not the same as a 1.2% retail price cut everywhere. A useful article must display the different measurements side by side.
The FAO Food Price Index methodology helps corroborate the wider subject, but it cannot authenticate a reader’s private documents, bills, contractual obligations or travel plan. Where the article includes an illustrative calculation, the assumptions are labelled. Where it concerns a live rule or future schedule, the controlling institution should be consulted again immediately before use.
For an independent news report on the October 2026 commodity outlook, see Reuters: World Bank October 2026 commodity outlook. This news account adds context; it is not a substitute for the directly applicable institutional source.
A short verification checklist
- Start with the specific evidence: Compare the FAO measure with the country’s food CPI and wholesale prices on a shared timeline.
- Challenge the default assumption: Beware the claim that a lower FAO reading proves governments or retailers are hiding an immediate saving.
- Check the scope of the published material: The FAO’s 6 November 2026 release reports a 1.2% monthly fall in its international food index, but that is not the same as a 1.2% retail price cut everywhere.
- Confirm the current version: Revisit the World Bank October 2026 commodity outlook and the original dated guidance before making an irreversible decision.
Frequently asked questions
What is the key principle?
The FAO Food Price Index tracks international commodity quotations, not the total cost of the weekly supermarket basket. The relevant primary reference is World Bank October 2026 commodity outlook.
What would change the answer?
Beware the claim that a lower FAO reading proves governments or retailers are hiding an immediate saving. In reality, product composition, taxes, production costs and inventory turnover can explain some of the difference; any accusation needs separate evidence.
What should I verify before relying on this?
Compare the FAO measure with the country’s food CPI and wholesale prices on a shared timeline. Add exchange rates and seasonal harvest information. Label which figures refer to levels, percentage changes and annual inflation, so readers do not confuse a declining index with falling store prices.
The FAO Food Price Index tracks international commodity quotations, not the total cost of the weekly supermarket basket. The FAO’s 6 November 2026 release reports a 1.2% monthly fall in its international food index, but that is not the same as a 1.2% retail price cut everywhere.
Discover more from The Economy
Subscribe to get the latest posts sent to your email.


Key Takeaways
- This is not primarily a supply crisis: FAO’s July 2026 forecast puts global cereal production at 2.983 billion tonnes — the second-highest on record — with end-of-season stocks actually rising 8.2 million tonnes year-on-year.
- Yet 266 million people across 47 countries faced high levels of acute food insecurity in 2025, and global food inflation could rise from 2.8% to 5% by 2027.
- FAO’s own research attributes roughly 45% of the 2007-08 rice price rise and 30% of the wheat rise to export restrictions and reactive border protection — not fundamental scarcity — a pattern policymakers are watching closely in 2026.
- Fertilizer prices rose 35% year-on-year in the first five months of 2026, driven substantially by Strait of Hormuz-linked energy disruption, threatening the 2026/27 production outlook even though this year’s harvest was strong.
- A near-certain 2026-27 El Niño event is the single largest wildcard risk factor layered on top of an already fragile trade-policy environment.
A Price Crisis Layered on Top of Adequate Supply
The defining paradox of the 2026 food crisis is this: the world is not short of grain. According to FAO’s July 2026 forecast, global cereal production is expected to reach 2.983 billion tonnes this year — slightly below the record level recorded in 2025, but still the second-highest production level on record. Global cereal stocks at the end of the 2026-27 season are forecast at 957.8 million tonnes, an increase of 8.2 million tonnes from the previous year. These figures suggest the world is not currently facing an unavoidable shortage of basic grains — though a major weather event, prolonged geopolitical disruption, or a sharp increase in energy and fertiliser costs could quickly alter that outlook.
And yet the human toll remains severe. The Global Report on Food Crises 2026 estimates that about 266 million people in 47 food crisis countries and territories faced high levels of acute food insecurity in 2025, with FAO and the World Food Programme identifying 13 hunger hotspots for the June-to-November 2026 period. Reconciling adequate global supply with severe localised hunger is the central policy challenge — and it points squarely toward distribution, trade-policy, and price-transmission failures rather than an absolute production shortfall.
The Inflation Trajectory: Manageable Today, Risky Tomorrow
Global food inflation could rise from 2.8% in the first half of 2026 to 5% in the same period next year, adding an estimated 0.6 percentage points to overall inflation. The World Bank Group’s April 2026 Commodity Markets Outlook projects a 2.5% increase in the global food commodity price index this year, with risks firmly tilted to the upside — the emergence of El Niño conditions, rising energy and fertiliser costs, growing biofuel demand, and potential trade restrictions could all push food prices significantly above current projections.
The FAO’s own price index has already logged multiple consecutive monthly increases through 2026. World food commodity prices rose for a third consecutive month in April, with the FAO Food Price Index averaging 130.7 points, up 1.6% from March and 2% above the same month a year earlier, driven by higher costs across vegetable oils, meat, and cereals as the effective closure of the Strait of Hormuz continued to push up energy and fertiliser prices — though the index remained 18.4% below its March 2022 peak. FAO’s chief economist noted that despite the disruptions linked to the Strait of Hormuz crisis, global agrifood systems continue to show resilience.
Fertilizer: The Hidden Transmission Mechanism
The clearest link between the Middle East energy crisis and food prices runs through fertiliser costs. Global fertilizer markets have faced pressure since early 2026, and in the first five months of 2026, fertiliser prices increased by 35% compared to the same period last year — and despite some easing in recent weeks, fertiliser markets have not fully stabilised. Brazil, a major agricultural producer, imports approximately 80-90% of the fertilisers used in its agricultural sector, making it highly vulnerable to global supply disruption — a vulnerability shared by many mid-income agricultural exporters whose next season’s output now hinges on an input market they do not control.
The Real Policy Lesson: Export Restrictions Make Things Worse
The single most important, and most actionable, finding in FAO’s 2026 research concerns what governments do once prices start climbing — and it is a direct warning against the policy response many governments instinctively reach for. FAO’s State of Agricultural Commodity Markets 2026 report finds that when major producers impose export restrictions to protect their own markets, they transfer instability abroad and raise food insecurity elsewhere — insulating trade policies and reactive border protection explain about 45% of the rise in world rice prices and about 30% of the wheat rise during the 2007-08 crisis.
The human cost of that policy failure mode is directly quantifiable. In a scenario simulating a strong warm phase of El Niño affecting several countries, the report estimates that export restrictions push an extra 21.4 million people into hunger, on top of those hit by the shock itself. With a 2026-27 El Niño event now considered virtually certain based on all seasonal forecast modelling systems contributing to the Copernicus Climate Change Service, this is not an abstract policy warning — it is a near-term test that governments will very likely face within the next 12 months.
The 2026 global food crisis is a price and policy crisis, not a supply crisis: cereal production and stocks are near record highs, yet 266 million people face acute food insecurity. FAO research shows export restrictions, not shortages, drove roughly 45% of the 2007-08 rice price spike, with a near-certain 2026-27 El Niño now the key near-term risk.
Comparative Table: Supply-Driven vs. Policy-Driven Food Crisis Dynamics
| Dimension | Supply-Driven Crisis | Policy/Trade-Driven Crisis (2026 Pattern) |
|---|---|---|
| Root cause | Actual production shortfall | Export restrictions, speculation, price transmission failures |
| Global stock trend | Declining | Rising (+8.2 million tonnes forecast for 2026-27) |
| Appropriate policy response | Increase production, food aid | Keep trade flows open, avoid reactive border protection |
| Historical precedent | Genuine harvest failures | 2007-08 crisis: ~45% of rice price rise attributed to export restrictions |
| 2026 risk multiplier | Weather (El Niño) | Reactive policy response to weather-driven price spikes |
Speculation: A Contested but Recurring Explanation
Financial speculation remains a genuinely debated driver of food price volatility, distinct from but related to trade-policy failures. Academic research into prior food crises has argued that investor behaviour, not supply fundamentals, was the dominant price driver. One prominent economic analysis argues that despite common narratives blaming supply chain disruptions, there is no shortage of food globally — financial speculation is the key driver of food price surges, meaning the world faces a food price crisis, not a food supply crisis, with consequences that can be equally severe but require different policy solutions.
Whatever the precise weighting between speculation and trade policy, the practical implication for 2026 policymakers is the same: production-side interventions (subsidising farmers, boosting harvests) address the wrong lever if the actual failure is occurring in trade flows, price transmission, and financial markets.
Why It Matters for Investors and Policymakers
For commodity investors, the 2026 setup argues for treating agricultural price risk as a policy-and-weather compound bet rather than a pure supply-and-demand trade. Adequate global stocks mean prices should, in principle, remain contained — but the historical pattern shows that a weather shock combined with a defensive trade-policy response can produce price spikes disconnected from underlying fundamentals. Agricultural commodity exposure should be sized with this asymmetry in mind: the downside scenario (El Niño plus reactive export restrictions) has a well-documented historical precedent and a quantified human and price impact.
For policymakers, FAO’s research offers a rare, empirically grounded recommendation: keeping trade flows open during a price shock, rather than restricting exports, is the single most effective policy lever available — more effective, on the evidence, than most domestic production interventions.
What to Do Next
- Track fertiliser price trends as a leading indicator for the 2026/27 agricultural season, given their direct link to Strait of Hormuz-driven energy costs and Brazil-style import dependency risk.
- Watch for early signs of export restrictions from major grain producers as the 2026-27 El Niño event develops — this is the single clearest historical predictor of a price spike disconnecting from fundamentals.
- Distinguish country-level food inflation risk using FAO’s country rankings rather than relying on the global average, since currency depreciation and import dependency drive dramatically different exposure levels across markets.
- Treat current elevated global stocks as a genuine buffer, not a reason for complacency — the buffer can be undermined quickly by trade-policy responses to a weather shock, as 2007-08 demonstrated.
FAQ
Is the 2026 food crisis caused by an actual shortage of food?
No, not primarily. Global cereal production is forecast at 2.983 billion tonnes for 2026, the second-highest on record, with global cereal stocks actually rising 8.2 million tonnes year-on-year. The crisis is better explained by trade-policy responses, price transmission, and localised access failures than by an absolute supply shortfall.
What is the biggest risk factor for food prices heading into 2027?
A 2026-27 El Niño event is now considered virtually certain, and historically, weather shocks combined with defensive export restrictions have produced the sharpest price spikes. FAO estimates export restrictions in an El Niño scenario could push an extra 21.4 million people into hunger.
How many people are currently affected by acute food insecurity?
About 266 million people across 47 food crisis countries and territories faced high levels of acute food insecurity in 2025, according to the Global Report on Food Crises 2026.
Discover more from The Economy
Subscribe to get the latest posts sent to your email.
How Beijing is quietly rewiring the architecture of global agriculture — succeeding at the edges while remaining hostage to a single, stubborn bean.
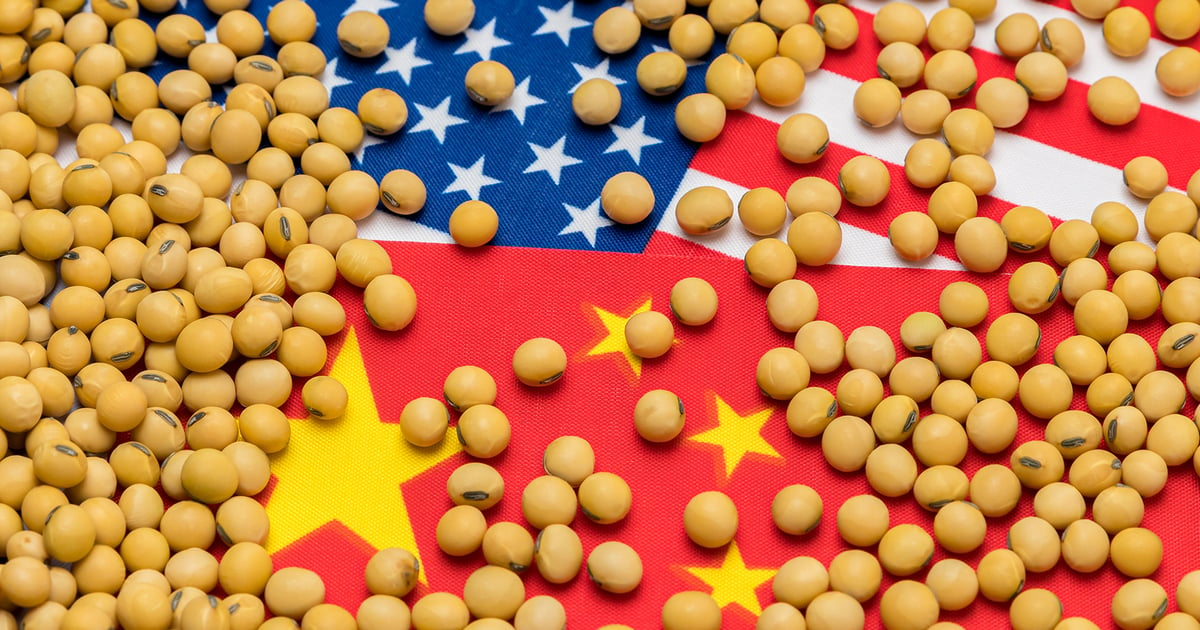
There is a particular irony buried inside China’s most consequential agricultural statistic of 2024. The country’s total grain imports fell 2.3% that year to 157.53 million tonnes — the most deliberate retreat from global markets in nearly a decade — yet in that same calendar year, Chinese soybean imports hit a record 105.03 million tonnes, a 6.5% year-on-year increase, accounting for 66% of total grain imports by volume. The strategists in Zhongnanhai are simultaneously winning and losing the food security game they’ve been playing for thirty years. Grasping both truths at once is essential to understanding one of the defining economic relationships of the coming decade. Modern DiplomacyModern Diplomacy
Call it the Soybean Paradox: China is demonstrably, successfully reducing its dependence on global food markets for rice, wheat, and corn while deepening a structural addiction to imported oilseeds that no domestic policy, however muscular, has yet been able to cure. This is not a story of decoupling. It is a story of strategic de-risking — partial, pragmatic, and geopolitically loaded — with reverberations that will reach farmers in Iowa, traders in Santos, and smallholders in the Sahel for decades to come.
From Humiliation to Harvest: The Long Arc of Chinese Food Policy
Understanding where China stands today requires a brief detour through the memory that animates its every agricultural instinct. The great famine of 1959–1961 — which historians believe claimed between 15 and 55 million lives — left an indelible mark on the Communist Party’s institutional psychology. Food security is not, for Beijing, a technocratic concern to be managed through import optimization and comparative advantage logic, as Western economists might counsel. It is existential. It is sovereignty.
This explains why, since Xi Jinping consolidated power in 2013, the language surrounding food has hardened from policy to theology. “China’s rice bowl must always be firmly held in its own hands,” Xi has declared repeatedly — a phrase whose political weight dwarfs its agricultural specificity. Each year since 2004, the central government’s most symbolic annual directive — the so-called “No. 1 Document” — has been devoted to rural and agricultural priorities, signaling to provincial governors, state enterprises, and private farmers alike that food production is not a sector to be disrupted by market rationality alone.
The 2025 No. 1 Document doubled down. It emphasized agricultural technology as central to the food security strategy, directing the central government to accelerate research and application of advanced domestic agricultural machinery and smart farming systems, including AI, 5G, big data, and low-altitude systems. Then, in April 2025, Beijing unveiled its most ambitious blueprint yet: the “Plan for Accelerating the Construction of an Agricultural Powerhouse (2024–2035),” which sets foundational goals for securing China’s food production and supply, including strengthening production capacity, conserving arable land, diversifying food sources domestically and abroad, and advancing agricultural technology and machinery. The ten-year horizon is telling. This is not crisis management. It is civilizational architecture. Asia TimesChinaPower Project
What China Has Actually Achieved: The Staples Miracle
Before cataloguing vulnerabilities — and they are real and numerous — the record of achievement deserves honest acknowledgment.
In 2024, China’s grain output exceeded 700 million tonnes for the first time, with per capita grain possession reaching 500 kilograms — above the internationally recognized food security line of 400 kilograms per capita. Absorb that figure in its full historical context: in 1978, China’s per-capita grain production barely crossed 300 kilograms. The country has, with 8% of the world’s arable land, sustained the dietary needs of nearly 18% of the global population across four decades of rapid urbanization, industrialization, and dietary upgrading. This is an agricultural accomplishment without modern precedent. English.gov.cn
The recent trajectory of staple grain imports tells the de-risking story clearly. In 2024, wheat imports fell 8% to 11.18 million tonnes, rice imports dropped a striking 37% to 1.625 million tonnes, and corn imports decreased by 49% to 13.76 million tonnes. These are not modest adjustments at the margin — they represent a deliberate and largely successful policy of reasserting domestic sufficiency in the grains that matter most to political stability and caloric security. For rice and wheat — the twin pillars of the Chinese dietary identity — self-sufficiency rates have remained above 95% in recent years, with official data showing rice, maize, and wheat self-sufficiency above 98% as recently as 2019. Modern DiplomacyNature
The methods underpinning this success are instructive. China has pursued what academics call a “land red line” policy with near-religious discipline, enforcing a rigid farmland protection floor of 1.8 billion mu (120 million hectares) to prevent agricultural land from being converted to industrial or residential use. It has invested massively in high-standard farmland construction — leveling, draining, and irrigating lower-quality plots to boost per-hectare yields. And it has quietly reversed decades of official hostility toward biotechnology: in 2023, China’s Ministry of Agriculture and Rural Affairs approved GM corn and soybeans as well as GM seeds for commercial use, with another 17 GM crop variants approved in December 2024 — a profound change given long-standing public antagonism against GM foods. English.gov.cnChinaPower Project
The digital revolution is now arriving at the farm gate. In June 2025, seven key government agencies jointly released the Implementation Plan for the Food Industry Digital Transformation, an ambitious roadmap to bring precision farming, AI-driven planting optimization, and smart logistics to a sector still dominated by smallholder plots averaging less than half a hectare. The challenge is formidable; the intent is unmistakable. chinaobservers
The Soybean Trap: Where De-Risking Meets Its Limits
And then there is the bean that breaks every model.
China’s demand for soybeans is approximately 110 million tonnes per year, and roughly 90% of that must be imported. Soybeans are the primary source of vegetable oil in the Chinese diet and, far more consequentially, the dominant protein source for China’s livestock industry — the vast pig, poultry, and aquaculture complex that feeds the country’s growing appetite for meat. China’s Ministry of Agriculture and Rural Affairs noted in January 2025 that 70% of animal husbandry production costs derive from feeds, the bulk of which depends on soybean meal. China’s pork supply chain — the most politically sensitive food commodity in the country — is thus structurally dependent on the global soybean market. This is not a vulnerability that can be engineered away quickly. CssnChinaPower Project
The geopolitical dimension of this dependency has become acute. Trade tensions with the United States have accelerated a diversification that was already underway. Between 2016 and 2024, the US share of China’s soybean imports plummeted from 40% to just 18%. In 2024, Brazil alone accounted for approximately 71% of China’s total soybean imports, a concentration that has redrawn the commercial geography of global agriculture. US agricultural exports to China are projected at just $17 billion in 2025, down 30% from 2024 and more than 50% from 2022; by 2026, the figure is expected to fall to $9 billion — the lowest level since the 2018 trade war. Global Times + 2
From January through August 2025, US soybean exports to China totaled just 218 million bushels, down sharply from 985 million bushels in the equivalent period of 2024. This is not trade friction; it is a structural rupture. For the American agricultural heartland — corn-belt states whose entire revenue model was built around the assumption of Chinese demand — the implications are not merely uncomfortable. They are existential. American Farm Bureau Federation
China has not simply found a new supplier. It has begun constructing a new supply architecture. The “Soy China” initiative — modeled on a successful “Boi China” beef supply chain that Brazil developed specifically to Chinese quality and traceability standards — aims to create a dedicated soybean supply chain cultivated in accordance with sustainability and quality standards defined by China, with the PRC expected to inject capital into Brazil’s agricultural sector to support the recovery of degraded lands. This is agri-diplomacy with a precision that Washington has consistently failed to match: rather than simply purchasing commodities, China is co-designing supply chains, financing logistics infrastructure, and embedding preferential standards that make alternative sourcing progressively more difficult. USDA
The Brazil-China soybean relationship has become a case study in strategic commercial interdependence — but with asymmetries that favor Beijing. 73% of Brazil’s exported soybeans are now destined for China, a concentration that gives Beijing enormous leverage over Brasília’s agricultural policy, land use decisions, and trade posture in any multilateral negotiation. This is the quiet power of being the buyer that cannot be replaced. Farmdoc Daily
The Virtual Water Problem and Climate Reckoning
Soybean dependency is not only a geopolitical liability — it is, on one reading, an ecological strategy of stunning cleverness. Soybeans are extraordinarily water-intensive to produce. By importing 105 million tonnes annually, China effectively imports the equivalent of hundreds of billions of cubic meters of “virtual water” — the water embedded in traded agricultural goods — from Brazil and Argentina, thereby relieving pressure on its own chronically stressed aquifers, particularly in the North China Plain, where groundwater depletion has reached crisis levels in some provinces.
Yet this logic, elegant in the short run, becomes precarious in a world of accelerating climate disruption. Climate change is expected to reshape precipitation patterns, heat accumulation, and the frequency of extreme weather events, with water-stressed regions like the North China Plain becoming more vulnerable to production risks, while resource-rich northeastern provinces could emerge as critical grain expansion zones. Brazil’s soybean production is equally exposed to climatic volatility — La Niña events, deforestation-induced rainfall disruption in the Amazon basin, and the worsening drought cycles in Mato Grosso, which produces the majority of Brazilian soy. China’s supply security is therefore only as resilient as the climate systems of countries it has chosen to depend on — which is to say, increasingly fragile. MDPI
The domestic dimension is similarly sobering. Of China’s 31 provincial-level administrative regions, 19 have failed to achieve food self-sufficiency, with a stark divide between food-surplus northern inland provinces and food-deficit southern coastal regions that depend on inter-regional transfers. The national food self-sufficiency rate has declined to 82% by 2022 when broader food categories including beans and tubers are counted — a figure that underscores the gap between the officially celebrated grain self-sufficiency narrative and the full complexity of the food system. MDPIMDPI
The Global Ripple: Who Wins, Who Loses
Beijing’s strategic de-risking has already produced winners and losers, and the redistribution will intensify.
Brazil is the clearest beneficiary — a soybean superpower whose agricultural export revenues have become structurally dependent on Chinese demand. The risk, rarely discussed in Brasília, is that Brazil has traded one form of external dependency for another: it has diversified away from American market exposure only to concentrate on Chinese demand to a degree that rivals US exposure at its peak.
Russia and the Global South are increasingly integrated into China’s agricultural diversification playbook. Chinese investment in Russian Far East farmland, grain corridors through Central Asia, and agricultural cooperation agreements with ASEAN and African nations all reflect a Belt and Road logic applied to food security: building redundant supply networks so that no single geopolitical rupture can threaten the food chain. China has pledged 1 billion yuan in emergency food assistance to Africa, development of 100,000 mu of agricultural demonstration areas, and the dispatch of 500 agricultural experts — soft power investments that simultaneously build goodwill and create future supply dependencies. English.gov.cn
American farmers are experiencing the sharpest adjustment. In 2012, China purchased more than $25 billion in US farm products, nearly 20% of all agricultural exports. The recovery under the Phase 1 agreement was temporary; since then, China has steadily diversified its suppliers. The lesson that US agricultural policy has been slow to internalize is that Chinese diversification is not purely reactive to tariff cycles — it is a structural policy goal that trade concessions can slow but not reverse. American Farm Bureau Federation
Evaluating the Strategy: Partial Success, Persistent Gaps
How should this Chinese agricultural strategy be assessed against its own ambitions?
On staple grains: broadly successful. The combination of land protection policies, yield-enhancing technology, price support mechanisms, and strategic reserves has produced genuine food security for the 1.4 billion population’s core caloric needs. China’s average grain stock-to-consumption ratio of 54% stands far above the FAO’s food security warning line of 17% — a buffer that provides meaningful insulation against short-term supply shocks. Nature
On oilseeds and feed proteins: still deeply vulnerable. China’s soybean imports are on track to reach a record high in 2025, potentially exceeding 110 million tonnes — the inverse of what de-risking doctrine demands. Domestic soybean production, despite substantial policy support, achieved a self-sufficiency rate of just 18.5% as recently as 2022. The Five-Year Agricultural Plan targets domestic soybean production of 23 million tonnes by 2025 — an aspiration that would still leave 80% of demand unmet from imports. Dccchina + 2
On supplier diversification: genuine progress, but with new concentration risks. Reducing dependence on the US from 40% to 18% of soybean imports is a meaningful strategic achievement. But replacing it with 71% dependence on Brazil is less diversification than substitution. True resilience would require viable supply streams from five or six geographically dispersed sources, each capable of rapid scale-up — a supply architecture that does not yet exist for soybeans and may not be structurally achievable given the crop’s biophysical requirements.
On technology: genuinely promising, but with a decade-long lag. The embrace of precision agriculture, AI-optimized planting, and GM seed technology represents China’s most underappreciated long-term lever. Seven government agencies launched a joint Implementation Plan for the Food Industry Digital Transformation in June 2025, signaling the kind of whole-of-government coordination that tends to produce results in China’s development model. The productivity gains from widespread GM adoption, combined with precision irrigation in the water-stressed North China Plain, could materially improve self-sufficiency rates in oilseeds by the 2030s — but the timeline is uncertain, and the structural demand from a protein-hungry middle class is relentless. chinaobservers
The Broader Lesson: A New Model of Commodity Power
China’s agricultural strategy offers a masterclass in what might be called “dependency asymmetry management”: systematically reducing the leverage that any single foreign supplier holds over its food system while simultaneously increasing the leverage that China itself holds over those suppliers. The US-China soybean relationship was, at its peak, one of profound mutual dependency. Today, American farmers are more exposed to Chinese purchasing decisions than Chinese consumers are to American supply disruptions — a strategic inversion achieved over fifteen years through patient diversification, supplier cultivation, and infrastructure investment in the Global South.
This is not decoupling. It is something more sophisticated and arguably more destabilizing for the existing global trade order: selective interdependence, calibrated to minimize China’s vulnerability while preserving — and deepening — the vulnerabilities of its trading partners.
For commodity markets, the implications are profound. A China that continues buying record volumes of Brazilian soybeans while systematically excluding US origins will reshape the economics of both exporting nations, redirect global shipping patterns, and — through the “Soy China” initiative — begin to impose quality and sustainability standards on global production that Beijing, not Geneva, will define. China’s emergence as the buyer that sets the rules, rather than the buyer that follows them, represents a structural shift in global agricultural governance that has received insufficient attention.
For the broader project of globalization, China’s food security strategy embodies the central tension of our era: between the efficiency gains of comparative advantage and the resilience demands of geopolitical competition. Beijing has concluded, with some empirical justification, that the post-Cold War trade order was built on assumptions of political trust that no longer hold. Its response — partial, pragmatic, and increasingly effective — is not a rejection of global markets but a renegotiation of the terms on which it participates in them.
The Soybean Paradox will not be resolved quickly. China will remain the world’s largest agricultural importer for the foreseeable future, and its soybeans will continue to flow overwhelmingly from the Southern Hemisphere. But the trajectory is unmistakable: a country of 1.4 billion, armed with ambitious policy, deepening technology, and a strategic patience that Western democracies struggle to match, is slowly, deliberately tightening its grip on the one resource that every civilization has learned, sometimes through catastrophe, is too important to leave to markets alone.
The rice bowl, Beijing has decided, will be held in Chinese hands — even if the soybeans that fill it still arrive on Brazilian ships.
Discover more from The Economy
Subscribe to get the latest posts sent to your email.
Analysis
The Next Global Food Crisis Has Already Begun: How Blocked Fertilizer Shipments and a Fading La Niña Are Locking In 2026 Harvest Losses
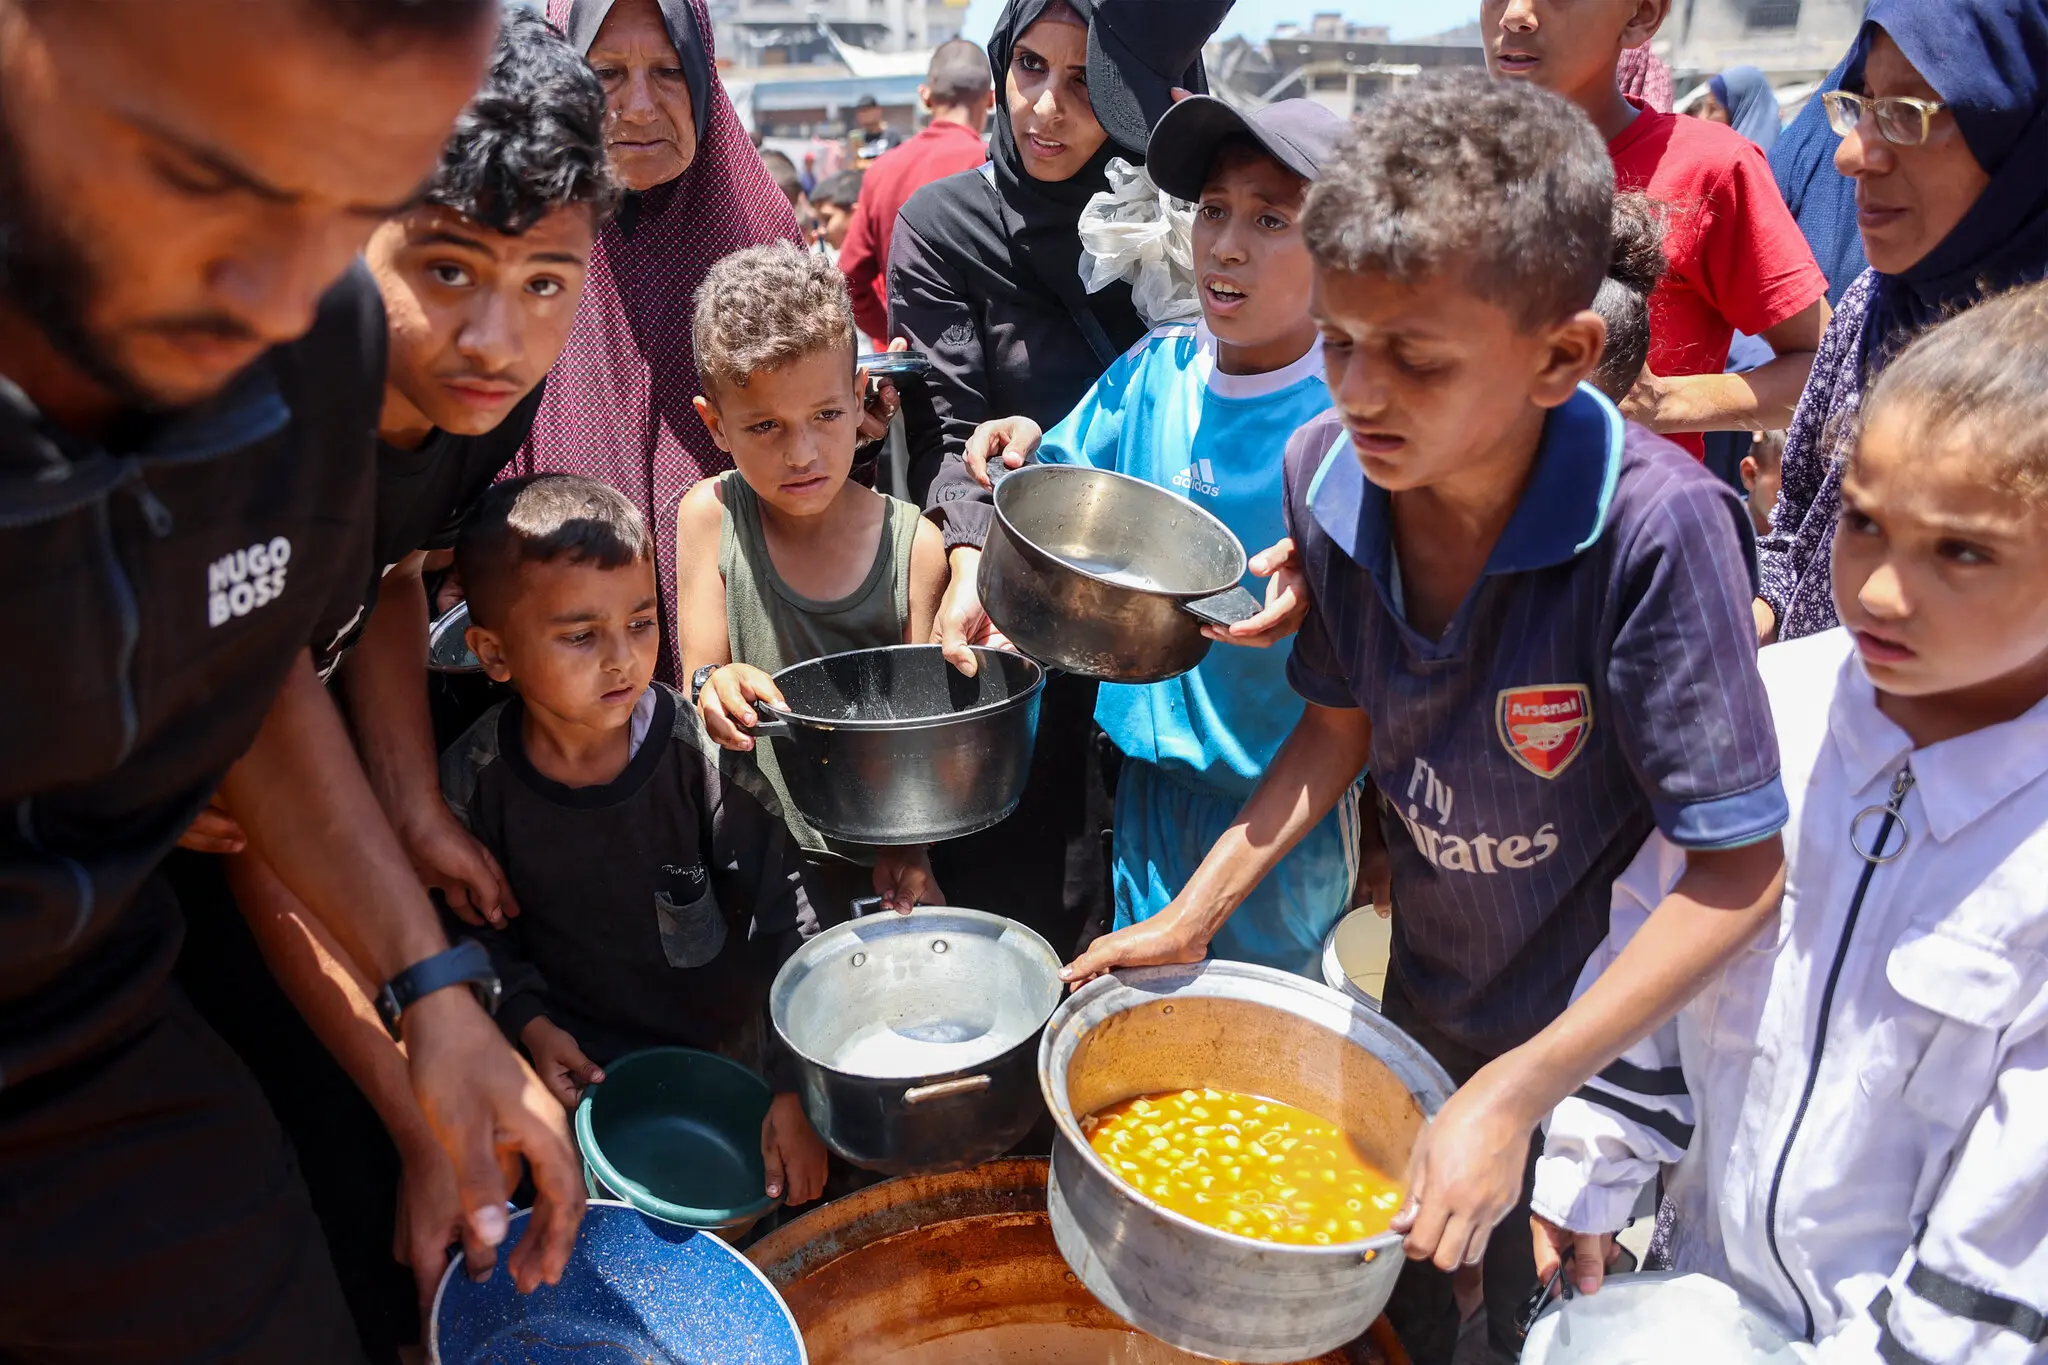
The Strait of Hormuz crisis has detonated one of the most severe shocks to global agricultural supply chains in a generation. With spring planting underway across the Northern Hemisphere and fertilizer inventories draining by the day, the food inflation of 2026–2027 is not a forecast—it is already being written in empty bags and dry fields.
Consider a smallholder in Bihar, India’s most agriculturally precarious state, preparing her Kharif fields in late spring. She has been waiting weeks for her urea allocation. The bags that arrived were fewer than ordered and cost nearly a third more than last season. She will plant anyway—she has no choice—but she will apply less fertilizer than the crop needs. Across South Asia, across the Sahel, across the river deltas of Bangladesh, millions of farmers are making exactly the same quiet, devastating calculation. The harvest they shortchange today is the food crisis of 2027.
The trigger is by now well-documented but insufficiently understood in its full systemic depth. On February 28, 2026, the United States and Israel launched “Operation Epic Fury” against Iran. Within days, tanker traffic through the Strait of Hormuz collapsed by more than 90 percent, as Iranian drone strikes on commercial shipping drove every major insurer to withdraw war-risk coverage. Without insurance, no captain runs a vessel worth hundreds of millions of dollars through a contested chokepoint for a cargo of fertilizer. The economics are brutally simple.
What has not been simple to convey to policymakers—or to a public still fixating on oil prices—is that the Hormuz closure is not merely an energy shock. As FAO Chief Economist Máximo Torero put it bluntly at a UN press briefing in late March: “This is not only an energy shock. It is a systematic shock affecting agrifood systems globally.” The distinction matters enormously, and it is one the world has not yet fully reckoned with.
The Fertilizer Chokepoint Nobody Planned For
Most people understand the Strait of Hormuz as an oil artery. What they do not understand is that it is equally a food artery.
Up to 30 percent of internationally traded fertilizers normally transit the Strait. The Gulf region—Saudi Arabia, Qatar, the UAE, Iran, and Bahrain—accounts for roughly a third of global urea exports and around 20 to 30 percent of ammonia exports. The region also produces nearly half of the world’s traded sulfur, a byproduct of oil and gas refining that is essential for converting phosphate rock into the water-soluble fertilizer plants can absorb. When the Gulf goes dark, it does not just switch off the lights. It pulls out the nutrients from under the world’s crops.
The numbers are already stark. Benchmark urea prices have surged approximately 30 percent in a single month, according to Carnegie Endowment analysts Noah Gordon and Lucy Corthell, who identified the cascading second-order effects even before markets had fully priced them in. At ports like New Orleans, urea is now trading above $600 per metric ton; diammonium phosphate and MAP have crossed $700 per metric ton. Fitch Ratings has raised its full-year 2026 ammonia and urea price expectations by around 25 percent. The World Bank’s commodity market data shows urea prices surging nearly 46 percent month-on-month between February and March—a shock comparable in speed, if not yet in magnitude, to the worst weeks of the 2022 Ukraine fertilizer crisis.
There is a cruel asymmetry in who bears this cost. The United States produces roughly three-quarters of the fertilizer it consumes and is partially insulated. But Brazil imports more than 80 percent of its fertilizers, relying heavily on Gulf-sourced nitrogen and phosphate. Ethiopia sources almost all of its nitrogen fertilizer through Gulf supply routes and is confronting acute shortages at its most critical planting juncture. India—the world’s second-largest agricultural economy and a country where smallholder farmers operate with razor-thin margins—faces reduced domestic nitrogen fertilizer output precisely as its Kharif season approaches. Bangladesh’s fertilizer plants have paused operations as LNG prices have spiked. Schools in Pakistan have closed as energy supply falters.
The interconnection that makes this crisis uniquely insidious is the natural gas link. Nitrogen fertilizers—urea, ammonium nitrate, UAN—are synthesized from ammonia, which requires enormous volumes of natural gas both as feedstock and energy. European gas prices have surged 50 to 75 percent since the conflict began. Egypt, a major nitrogen fertilizer producer that had partially compensated for Gulf supply losses during the 2022 Ukraine crisis, has now lost its pipeline gas imports from Israel and must compete on the now-devastated LNG spot market. The secondary circuit has blown. There is no obvious compensating supplier.
A Lingering Climate Hangover
The fertilizer shock does not arrive in isolation. It lands on agricultural systems already stressed by a protracted La Niña episode that, while weaker than the 2020–2022 triple-dip event, left distinctive fingerprints on key growing regions before its recent fade.
Through the first quarter of 2026, NOAA’s Climate Prediction Center confirmed La Niña persisted, albeit in a weakened state, with its atmospheric circulation patterns carrying through into the early Northern Hemisphere spring with a characteristic lag. For South America, the pattern reinforced dryness risk across parts of Argentina’s eastern corn belt and southern Brazil’s second-crop maize, precisely the safrinha crop that accounts for the bulk of Brazil’s annual maize production. Forecasters including Dr. Michael Cordonnier maintained cautious uncertainty on Argentine soybean estimates through January, noting that the La Niña-driven dryness risk, while not catastrophic, remained live.
Drought in parts of the U.S. central and southern Plains, which lingered from a dry late 2025 and which La Niña conditions reinforced into early 2026, has stressed the hard red winter wheat crop. The FAO’s March 2026 Cereal Price Index noted international wheat prices rising 4.3 percent in a single month, supported by “deteriorating crop condition ratings in the United States amid drought concerns and expectations of reduced plantings in Australia in response to anticipated higher fertilizer costs.” That phrase—”reduced plantings in response to higher fertilizer costs”—deserves more attention than it has received. It is a direct supply-side feedback loop: the Hormuz crisis is now reshaping what farmers in the Southern Hemisphere will choose to plant in the second half of 2026.
La Niña’s precise contribution is not the dominant story here, and it would be analytically dishonest to inflate it. Meteorologists and agricultural scientists broadly concur that the current episode has been relatively mild compared to its predecessors, and the transition to ENSO-neutral and possibly El Niño conditions through mid-2026 should bring relief to South American and some East African growing areas. But two important caveats apply. First, the timing of that transition matters acutely: a lagged atmospheric response means La Niña’s influence lingers into the Northern Hemisphere planting window even after Pacific Ocean temperatures have normalized, exactly as the USDA’s ENSO advisory for spring 2026 warned. Second, and more consequently, a late-developing El Niño carries its own risks for the western Pacific Rim—drought in parts of Australia, Southeast Asia, and southern Africa—arriving precisely as the fertilizer shock is biting hardest into 2026–27 crop cycles.
The climate and geopolitical shocks are not additive. They are multiplicative. A farmer who cannot afford fertilizer is far more vulnerable to a drought stress event than a well-nourished crop. The margin for error has narrowed catastrophically.
Why This Crisis Is Different From 2022
It has become fashionable to invoke the 2022 Ukraine shock as the reference point for the current crisis. The comparison is instructive but dangerous if it breeds complacency.
In 2022, the primary disruption was to grain exports: Russia and Ukraine together accounted for roughly 29 percent of global wheat exports, and their simultaneous exit from global markets caused a supply panic that drove wheat prices up over 70 percent. Fertilizer prices also spiked sharply, but the shock was diffuse—the price transmission to food was visible within weeks because wheat itself was the missing commodity.
The 2026 Hormuz disruption follows a different and in some respects more treacherous logic. As analysts at the University of Illinois’s farmdoc daily noted, the Persian Gulf is not a major grain export region, so the Hormuz closure primarily increases fertilizer costs rather than directly removing grain from the market. Crop futures moved upward after the initial shock but modestly—corn and soybean futures rose only 3.6 to 8 percent in the first two weeks, compared to the 70 percent-plus wheat surge in 2022.
This relative calm in grain futures is precisely the danger. It suggests markets are pricing the current crisis as a cost shock to inputs rather than an immediate supply shock to outputs. They are correct—for now. But fertilizer is not a commodity that can be substituted overnight. A farmer who under-applies urea at planting cannot compensate at harvest. The yield reduction is baked in at the moment the bag stays on the shelf. And because fertilizer use follows a nonlinear yield response, even modest reductions—say, 10 to 15 percent fewer kilograms per hectare applied by cost-squeezed smallholders—can produce disproportionately large declines in output, particularly in regions where nutrient application is already far below agronomic optimum. This is the amplifier that the grain futures desks are not fully pricing.
If the disruption persists for three months or longer, FAO projects reduced yields for wheat, rice, and maize, crop substitution toward nitrogen-fixing legumes, and escalating competition between food crops and biofuel feedstocks as elevated oil prices stimulate ethanol and biodiesel demand. The 2022 food crisis peaked visibly and painfully within six months of the Ukraine invasion. The 2026 crisis will peak more quietly, and somewhat later—perhaps not until the 2026–27 harvest season—but with consequences no less severe for those at the bottom of the global income distribution.
The World Food Programme estimates that the conflict could push 45 million additional people into acute hunger by mid-2026. That is a figure that deserves to be read slowly.
The Architecture of Neglect
Every major food supply chain crisis—1973, 2008, 2011, 2022—has, in its aftermath, prompted confident declarations that the international community has learned its lesson and will build resilience. Every declaration has quietly dissolved under the pressure of competing budget priorities and market complacency during the long, calm years that follow.
The Hormuz crisis has exposed four specific architectural failures that go beyond this particular conflict.
The strategic reserve asymmetry. G7 countries do not maintain strategic fertilizer reserves to match their oil stockpiles. This is not an oversight—it reflects a deliberate political economy in which energy security has powerful industrial lobbies and food security has smallholder farmers who are voiceless in international forums. Saudi Arabia built a pipeline to enable Red Sea exports of oil when the Hormuz chokepoint is threatened. There is no equivalent pipeline for ammonia, and there are no globally coordinated ammonia stockpiles. The food system has been treated, implicitly, as a residual claim on energy infrastructure rather than as independent strategic infrastructure of its own.
The insurance failure. War-risk insurance premiums surged from 0.25 percent to as high as 10 percent of vessel value, resetting weekly, within days of the Hormuz disruption. Even if the conflict ends tomorrow—and the Security Council vote on Bahrain’s proposal to mandate open passage remains deadlocked as of this writing—the insurance industry will require months of incident-free sailing before normalizing premiums. One industry expert estimated that even a rapid diplomatic resolution would take months before maritime trade returns to normal shipping capacity. The planting season does not wait for insurers.
The China paradox. Even before the Iran war, China had been restricting fertilizer exports to protect its own farmers. China’s self-sufficiency in fertilizers was supposed to make it a buffer; instead, its export restrictions amplify global scarcity. Beijing needs Brazil to grow soybeans to feed Chinese livestock. Brazil needs Gulf urea to grow those soybeans. The Gulf is blocked. The interdependence is total and the safety valve does not exist.
The just-in-time delusion. The 2022 Ukraine shock was supposed to cure the world of just-in-time supply chain management in strategic commodities. It manifestly did not. Fertilizer inventories globally were at comfortable but not exceptional levels when the Hormuz disruption hit; the 40 to 60 day supply buffer that most import-dependent countries held has been eroding since early March. Countries like Ethiopia, which sources essentially all of its nitrogen fertilizer via Gulf supply routes, had no meaningful buffer at all.
What Must Change
The immediate priority, as the International Crisis Group’s Comfort Ero has argued, is a humanitarian transit deal through the Strait of Hormuz that allows food and fertilizer shipments to pass regardless of the military situation. Iran’s partial concessions—allowing vessels from China, Russia, India, Iraq, Pakistan, and several Southeast Asian nations to transit, and agreeing to a UN request for humanitarian and fertilizer shipments—are welcome but fragile and selective. What is needed is a robust, institutionally anchored mechanism analogous to the Black Sea Grain Initiative of 2022, covering all flag states and backed by a credible monitoring framework. The UN task force announced in early April is a starting point, not a solution.
Beyond the immediate crisis, three structural shifts deserve serious international investment.
Fertilizer diplomacy must become food diplomacy. The G7, G20, and major multilateral lenders need to treat fertilizer supply chains with the same strategic seriousness they apply to oil and semiconductor supply chains. This means coordinated strategic reserves, early-warning systems linked to ENSO forecasts, and pre-negotiated alternative routing agreements before the next chokepoint fails—not after.
Green ammonia deserves urgent acceleration, not because it is cheap, but because geography-based vulnerability demands it. The FAO’s long-term recommendation for green ammonia is not a climate fantasy—it is a food security hedge. Distributed production of nitrogen fertilizers, decoupled from Gulf gas fields, is the structural answer to geographic concentration risk. Every dollar invested in green ammonia production in Africa, South Asia, or Latin America is a dollar of insurance against the next Hormuz closure.
Smallholder resilience cannot be an afterthought. The farmer in Bihar who is applying less urea to her Kharif field right now will not generate a headline. She will not appear in a futures market report. But she—and the 300 million smallholders like her across Asia and Africa—is where the food crisis actually lives. Emergency credit facilities, targeted subsidy deployment, and climate-smart agronomic support that reduces fertilizer dependency through precision application and nitrogen-fixing cover crops are not soft development investments. They are the front line of food price stability for the entire world.
The FAO Food Price Index reached 128.5 points in March 2026, its second consecutive monthly increase, driven by energy-related pressures now bleeding into every agricultural commodity group. It remains below the terrifying peak of March 2022. But the gap is closing, and it is closing for structural reasons—reasons that will not reverse when a ceasefire is eventually signed and the drones stop flying over the Strait.
The food crisis of 2026–2027 will not announce itself with a single dramatic headline. It will arrive, as it always does for the world’s poorest, in the slow accumulation of empty shelves, skipped meals, and fields that yielded less than they should have—because the bag of urea arrived too late, cost too much, or never arrived at all. We have been warned. The question is whether the warning will be heard before the harvest, or only after it.
Discover more from The Economy
Subscribe to get the latest posts sent to your email.

Why Falling World Food Prices Do Not Always Lower Grocery Bills

Oil Shocks and Core Inflation: Why the Two Move Differently

Singapore Cannot Fight Financial Fraud by Making Victims Bear the Risk Alone

Singapore Banking’s Real Test: Beyond Profits, Who Will Safeguard Financial Trust?

Nvidia’s Share Price Is Not a Scorecard for Singapore’s AI Future

The Australian Dollar Is Not Asia’s Oracle. Singapore Should Listen Anyway

Singapore’s Bank Sell-Off Is Really a Test of What Stability Is Worth

Why a Weaker Currency Makes Imported Food More Expensive

How Oil Price Shocks Raise Food Prices in Importing Countries

Petrol and Diesel Prices in Pakistan Today: Complete Update for 9 November 2026

Wall Street’s Renminbi Paradox: Banks, Beijing and the Dollar

The Market Economy Is Winning

Bitcoin’s Dollar Trap: The Chart That Exposes the Future of Money

Dow Jones Today: Dow Slips 237 Points After the Worst Day Since April 2025

Stock Market Crash in 2026? Warning Signs, Scenarios and a Calm Investor Checklist

US–Iran Conflict in October 2026: Hormuz, Oil Prices and Diplomacy
Dow Jones Today: Dow Slips 237 Points After the Worst Day Since April 2025

China’s AI Microdrama Boom: How Beijing Is Reshaping Global Media

SSI November 2026 Payment: Why Benefits Arrive October 30

US–China AI Export Controls in 2026: Chips, Testing Rules and Corporate Risk

Pakistan IMF Programme 2026: Why Bailouts Keep Returning

2027 Federal Tax Brackets: New IRS Rates and Standard Deductions Explained

EU-China Trade Deal 2026: How Beijing and Brussels Avoided a Trade War—and Who Wins

Q3 2026 Earnings Preview: Can Record Profit Expectations Keep Wall Street’s Rally Alive?

Stock Market Crash 2026? What the November Rout Actually Tells Us

Singapore Stock Market Outlook 2027: The STI’s Bank-and-Yield Test

World Bank Debt Report 2026: The $9.4 Trillion Burden Behind the Recovery

KSE-100 Index 2026: Is Pakistan’s Stock-Market Recovery Sustainable?
-

 Markets & Finance10 months ago
Top 15 Stocks for Investment in 2026 in PSX: Your Complete Guide to Pakistan’s Best Investment Opportunities
-

 Analysis9 months ago
Johor’s Investment Boom: The Hidden Costs Behind Malaysia’s Most Ambitious Economic Surge
-

 Analysis9 months ago
Top 10 Stocks for Investment in PSX for Quick Returns in 2026
-

 Banks10 months ago
Best Investments in Pakistan 2026: Top 10 Low-Price Shares and Long-Term Picks for the PSX
-

 Analysis9 months ago
Brazil’s Rare Earth Race: US, EU, and China Compete for Critical Minerals as Tensions Rise
-

 Investment10 months ago
Top 10 Mutual Fund Managers in Pakistan for Investment in 2026: A Comprehensive Guide for Optimal Returns
-

 Global Economy11 months ago
15 Most Lucrative Sectors for Investment in Pakistan: A 2025 Data-Driven Analysis
-

 Global Economy11 months ago
Pakistan’s Export Goldmine: 10 Game-Changing Markets Where Pakistani Businesses Are Winning Big in 2025