
Analysis
Amid Iran Tensions, US-China Trade Chiefs Gear Up for Mid-March Talks Ahead of Trump-Xi Summit
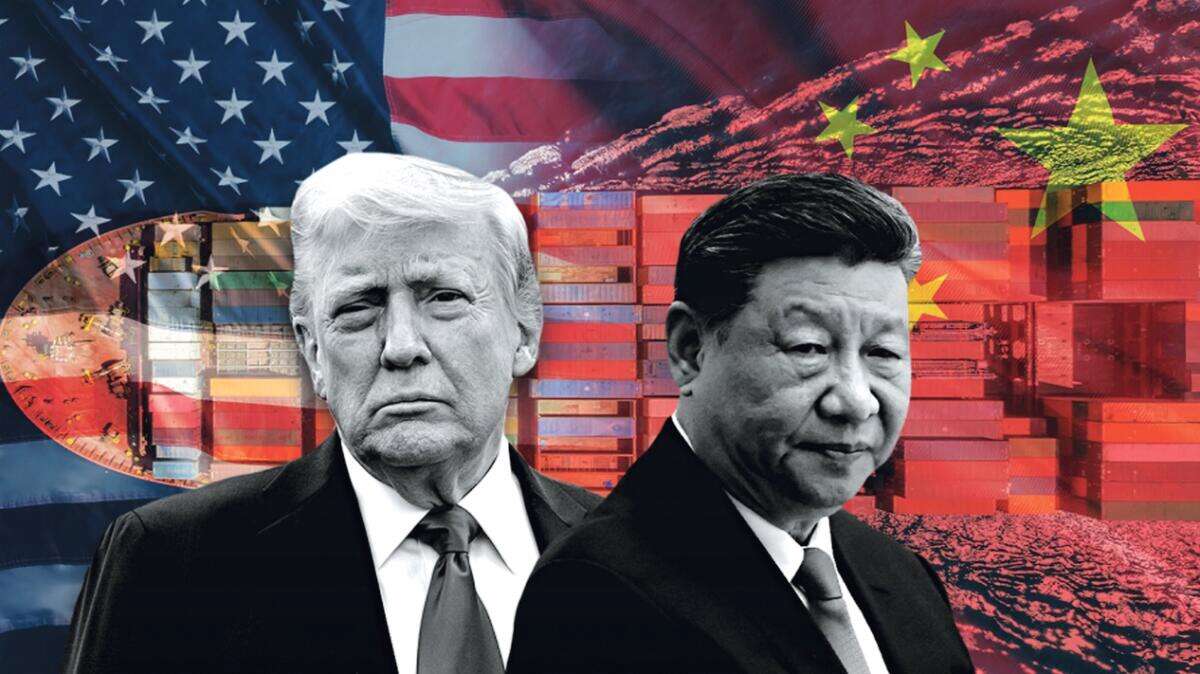
As missiles reshape the Middle East, two of the world’s most consequential economic officials prepare to sit across a table in Paris — and the world is watching.
The Paris Prelude: Bessent and He’s High-Stakes Rendezvous
In the shadow of American strikes on Iran and the death of Ayatollah Ali Khamenei, a quieter but no less consequential drama is unfolding in the back channels of global diplomacy. US Treasury Secretary Scott Bessent and Chinese Vice Premier He Lifeng are expected to convene in Paris at the end of next week, according to sources familiar with the matter, in what amounts to the groundwork session for a planned Trump-Xi summit currently scheduled from March 31 to April 2, 2026, in Beijing.
The meeting — still subject to change in both timing and location — would be the latest in a series of bilateral encounters stretching from Geneva in May 2025 through London, Stockholm, Madrid, and Kuala Lumpur. That itinerary alone tells a story: the US-China trade relationship, for all its seismic tension, has been quietly managed by two officials who have shown a consistent, if carefully choreographed, willingness to talk. As reported by Bloomberg, the mid-March trade talks signal that summit preparations are advancing despite the escalating geopolitical turbulence generated by Washington’s military actions in the Persian Gulf.
Neither the US Treasury nor China’s Ministry of Commerce responded to requests for comment — a silence that, in diplomatic terms, is practically deafening with implication.
Key Agenda Items: From Boeing to Taiwan
The Paris agenda, if it holds, is expected to span a range of contentious and commercially significant issues. Among the most prominent:
| Agenda Item | Stakes | Status |
|---|---|---|
| Chinese purchase of Boeing aircraft | Multi-billion dollar aviation deal; symbolic détente | Under discussion |
| US soybean purchase commitments | Agricultural exports; rural political currency for Trump | Preliminary |
| Taiwan | Sovereignty flashpoint; structural red line for Beijing | Exploratory |
| Post-Supreme Court fentanyl tariffs | Legal vacuum following February ruling; new 10% levies in place | Active negotiation |
| Broader trade deficit rebalancing | Core US demand; “managed trade” framework | Ongoing |
The Boeing question carries particular weight. China’s commercial aviation market — among the fastest-growing in the world despite its economic deceleration — represents an enormous prize for the American aerospace giant, which has spent years navigating regulatory and reputational turbulence. A purchase commitment would offer Beijing a high-visibility concession while giving Washington a tangible win ahead of the summit.
On soybeans, the calculus is similarly political. US exports to China fell a staggering 25.8% in 2025 as the trade war ground on, and American farmers — a bedrock constituency for President Trump — have felt the pain acutely. Renewed purchase commitments would provide both economic relief and narrative momentum heading into what the White House hopes will be a triumphant Beijing summit.
Taiwan, as ever, looms over any discussion. Beijing’s insistence that the self-ruled island is Chinese territory has hardened in recent years, and any American concession — or even ambiguity — on the matter carries enormous strategic weight. Conversely, any perceived US softening on Taiwan in exchange for trade gains would face fierce domestic political scrutiny on Capitol Hill.
The Fentanyl Tariff Wrinkle: A Legal Earthquake Reshapes the Agenda
Perhaps the most technically complex item on the table involves the sudden collapse of the US fentanyl tariff regime. On February 20, 2026, the Supreme Court issued a ruling invalidating the IEEPA-based tariffs that had underpinned Washington’s economic pressure on China over fentanyl trafficking — a decision that sent trade lawyers scrambling and left the administration’s negotiating toolkit notably lighter. The tariffs were formally terminated on February 24, 2026, the same day the administration moved to impose new 10% Section 122 tariffs across all trading partners (with exemptions carved out for civil aviation, a nod, perhaps, to the very Boeing negotiations now underway).
As the Peterson Institute for International Economics has noted, the legal architecture of US trade policy is under increasing strain as presidents reach for expansive executive authorities that courts may not sustain. The fentanyl ruling is the sharpest illustration yet of that vulnerability — and it hands Beijing a modest but meaningful tactical advantage in Paris. Chinese negotiators can now point to an American legal retreat, however involuntary, as evidence of the limits of economic coercion.
The US-China trade deficit, which did narrow in 2025 under the weight of successive tariff rounds, remains a central grievance for the Trump administration. Washington’s 2026 Trade Policy Agenda, released by the USTR, frames its objectives explicitly around what it calls “managed trade” — a deliberate, government-coordinated shaping of bilateral commerce rather than the free-market orthodoxy that once animated US trade doctrine. It is an approach that, ironically, has more in common with Chinese industrial policy than either side is inclined to acknowledge.
Broader Geopolitical Shadows: Iran, Oil, and the Beijing Calculation
Any honest accounting of the Paris talks must grapple with the shadow cast by American military operations in Iran. The killing of Supreme Leader Khamenei and the subsequent US strikes have stoked deep unease in Beijing, which maintains significant economic and strategic relationships with Tehran. China is Iran’s largest oil customer; disruption to Persian Gulf shipping lanes or further escalation in the Strait of Hormuz could send Asian energy markets into convulsions.
The Council on Foreign Relations has flagged precisely this risk: a Middle East conflict that constrains oil flows to Asia forces difficult choices on Beijing, potentially hardening its posture in trade negotiations where it might otherwise have shown flexibility. Chinese officials, for their part, have been careful to compartmentalize their public reactions — condemning the strikes without explicitly threatening retaliatory economic measures — but the tension is palpable and structural.
It would be naive to assume the Bessent-He talks in Paris can proceed in a hermetically sealed bilateral vacuum. The Iranian escalation is not merely a regional crisis; it is a variable that reshapes Chinese threat perceptions, energy economics, and the domestic political environment within which Xi Jinping must calculate his approach to the summit. A Beijing leadership consumed with Middle East uncertainty may drive a harder bargain — or, conversely, may see value in economic stability with Washington precisely because strategic uncertainty is rising elsewhere.
China’s own economic picture adds another layer of complexity. Growth has slowed, exports have surged in ways that have inflamed trade partners globally, and the property sector continues its long, painful deleveraging. Beijing’s suspension of rare earth export restrictions in October 2025 — a concession made as part of an earlier truce — remains a fragile détente that could unravel quickly if negotiations sour. Rare earth leverage is among the most potent cards in Beijing’s hand, and both sides know it.
What Paris Could — and Cannot — Deliver
Tempered expectations are in order. The Paris meeting, should it occur, is a preparatory session, not a deal-closing event. Its function is to narrow the agenda for the Trump-Xi summit, establish the parameters of what is achievable, and reduce the risk of a high-profile failure in Beijing at the end of March.
On that basis, a Chinese commitment to purchase Boeing aircraft and ramp up soybean imports would represent a meaningful deliverable — economically modest, perhaps, but symbolically potent. Progress on the fentanyl replacement framework, now that the IEEPA architecture has been legally dismantled, would address a genuine domestic concern for the administration and offer China a path to reducing tariff pressure under the new Section 122 structure.
Taiwan is, as always, the variable that defies neat packaging. It will be discussed, managed, and almost certainly left unresolved — a structural feature of US-China relations rather than a bug in any particular negotiation.
For global markets, the implications are material. A successful summit outcome — even a partial one — would provide relief to US agricultural exporters, aviation manufacturers, and the broader community of multinationals navigating a bifurcated trade landscape. A breakdown, particularly against the backdrop of Middle East escalation, could accelerate the fragmentation of global supply chains and deepen the decoupling that economists across the political spectrum increasingly view as economically costly for both nations.
As Reuters has reported, the mere fact of the mid-March US-China trade meeting is itself a signal — that both Washington and Beijing retain an interest in managing, rather than severing, the relationship. In a world of narrowing diplomatic bandwidth and expanding geopolitical risk, that signal carries weight.
The olive branches are extended. Whether they hold, in Paris and beyond, is the question that markets, policymakers, and allies from Seoul to Brussels will be watching closely over the weeks ahead.
Discover more from The Economy
Subscribe to get the latest posts sent to your email.


Oil Markets
China’s Oil Shock Absorber: How Beijing Kept Crude Prices Half of What Analysts Predicted

Analysts predicted oil above $200 during the Hormuz crisis. China’s intervention kept prices roughly half that. Fortune and Bloomberg explain how Beijing did it — and why the strategy has limits that markets have not fully priced in.
The $200 Oil That Never Arrived
When Iranian forces declared the Strait of Hormuz closed in early March 2026, the analytical consensus in energy markets shifted rapidly toward a catastrophic scenario. The Strait carries 27% of globally traded crude oil and petroleum products (Congressional Research Service, 2026). Iran had demonstrated both the capability and willingness to enforce that closure through attacks on shipping. A sustained blockade, analysts projected, could push Brent crude to $150, $175, or even above $200 per barrel — levels not seen since the 1970s oil shocks in real terms.
Brent reached approximately $113 at its peak in April. That is a severe price spike by any historical standard — a 100%-plus rise from January levels of around $56. But it is emphatically not $200. And the primary reason it is not $200, according to reporting from Fortune and Bloomberg, is China (Fortune, June 2026).
How Beijing managed to suppress oil prices to roughly half of what the most bearish forecasters projected — and why analysts warn that capability has limits — is one of the most consequential and under-analysed stories in global energy markets this year.
Key Takeaways
- Analyst consensus during the Hormuz closure was for Brent crude to potentially breach $200/barrel
- China’s strategic reserve releases, demand management, and alternative supply sourcing kept prices around $100–113 at their peak
- China receives approximately one-third of its total oil imports via the Strait of Hormuz
- Beijing is reportedly running out of its ability to continue suppressing oil price volatility through reserves alone
- The longer-term consequence may be a permanent reshaping of Asian energy supply chains away from Gulf dependence
China’s Structural Exposure and Its Response
China is not merely a passive participant in global oil markets. It is, by a significant margin, the world’s largest crude oil importer, and the Strait of Hormuz occupies a central role in its energy security architecture. Approximately one-third of China’s total oil imports — representing about 3–4 million barrels per day — transits the Strait of Hormuz (Wikipedia / 2026 Hormuz Crisis). The disruption of that supply was not an abstract geopolitical concern for Beijing; it was a direct threat to industrial production, electricity generation, and economic stability.
China’s response operated on multiple fronts simultaneously. The most immediate was the release of strategic petroleum reserves — a buffer that Beijing has been systematically expanding since the early 2000s precisely in anticipation of supply disruptions. China’s strategic reserve capacity, estimated at approximately one billion barrels by the time of the conflict, provided a multi-month cushion that allowed Chinese refineries to maintain throughput without paying spot prices at the elevated levels that would otherwise have cleared the market (Wikipedia / Hormuz Crisis).
Simultaneously, Beijing accelerated the diversification of its spot purchasing toward West African, Russian, and Central Asian supply — suppliers not exposed to the Strait bottleneck. Russia, whose pipeline export routes run overland through Central Asia and whose Pacific coast ports access Chinese markets without Middle East transit, saw a significant increase in contracted volumes. The rapid rerouting of demand is a function of commercial relationships that China’s National Petroleum Corporation and Sinopec have been cultivating for precisely this scenario for over a decade.
Demand Management: The Hidden Tool
Less visible but equally important was demand-side management. China’s centralised economic planning apparatus has tools that market economies simply do not possess. When spot crude prices spiked, Chinese industrial regulators directed state-owned enterprises in energy-intensive sectors — aluminum smelting, steel production, cement manufacturing — to reduce output or shift to pre-accumulated inventory rather than purchase at market prices.
This is not a price mechanism adjustment; it is a direct administrative intervention in the quantity of oil demanded. By reducing industrial throughput in sectors where the marginal cost of a production pause is relatively low, Beijing effectively shifted the demand curve downward during the period of peak supply disruption — suppressing the equilibrium price without directly intervening in international markets.
The geopolitical complexity of this strategy should not be overlooked. China’s demand management created cover for an implicit diplomatic position: Beijing was neither supporting the U.S.-led international effort to reopen the Strait nor openly backing Tehran’s closure. It was simply managing its own economic exposure — a position that Xi Jinping could maintain with public statements calling the Strait’s openness “in the common interest of regional countries and the international community” while privately doing whatever was necessary to insulate the Chinese economy from the worst consequences (Wikipedia / Hormuz Crisis).
Why the Strategy Has Limits
Fortune’s analysis is clear: China’s oil shock absorption cannot continue indefinitely, and cannot protect global markets much longer at current intensity (Fortune, June 2026).
The strategic petroleum reserve, however large, is a finite buffer. It is designed to cover weeks or a few months of disruption — not a sustained multi-year reorientation of global supply chains. Every barrel released from reserve must eventually be replaced, and replacement purchases at a time of market tightness push prices back up. If the Hormuz situation were to deteriorate again after a partial reopening, China’s reserve cushion would be materially depleted compared to its pre-crisis level.
The administrative demand management approach also carries economic costs that compound over time. Cutting aluminum or steel output during a supply shock is tolerable for weeks. Sustained output reductions damage trade relationships, create delivery failures on international contracts, and impose real economic costs on the downstream industries that depend on those materials. At some point, the cost of demand suppression exceeds the cost of simply paying higher oil prices.
The most durable consequence of the crisis is not what China did in the short term — it is what it is now doing structurally. Long-term supply agreements with non-Gulf producers, accelerated domestic refinery investment, expanded strategic reserve capacity, and intensified electric vehicle and renewable energy adoption are all being fast-tracked as direct lessons of the 2026 disruption. Those investments will reduce China’s Hormuz dependency over a five-to-ten-year horizon — permanently altering the geopolitical leverage that control of the Strait confers.
What This Means for Global Oil Prices
The two-sided implication for global energy markets is stark. In the near term, as the Hormuz deal is implemented and Chinese reserve releases wind down, the physical oil market will need to find a new equilibrium without Beijing’s suppressive effect. The natural clearing price — in the absence of further disruption — is likely in the $75–90 Brent range, reflecting OPEC-plus production discipline, recovering non-Gulf supply, and the partial demand destruction caused by the price spike.
In the medium term, China’s structural shift away from Gulf dependency represents a secular demand reduction for Hormuz-routed barrels. That reduction, distributed across a five-to-ten year transition, is manageable for Gulf producers who can reroute via pipeline (Saudi Arabia, UAE) but is structurally damaging for those who cannot (Iraq, Kuwait, Qatar).
For energy investors, the China oil story of 2026 offers a counterintuitive insight: the country that was most exposed to the supply disruption also proved to be the most effective damper on the price shock. That capability will not disappear — but it will not be unlimited either. The next disruption will test reserves and administrative levers that are now partially depleted, and the price response, when it comes, may be harder to contain.
Discover more from The Economy
Subscribe to get the latest posts sent to your email.
Analysis
U.S. Inflation at a Three-Year High: How the Iran War Turned an Economic Recovery Into a Stagflation Risk
U.S. inflation hit 4.2% in May 2026 — its highest since April 2023 — driven by an oil price surge linked to the U.S.-Iran conflict and the Strait of Hormuz closure. Here’s what it means for households, the Fed, and economic growth.
Key Takeaways
- U.S. CPI rose 4.2% year-on-year in May 2026, the highest reading since April 2023
- Core CPI (ex-food and energy) is more contained at 2.9%, limiting but not eliminating the Fed’s concern
- WTI crude rose from ~$57/barrel in January to a peak of $113 in April — nearly doubling in three months
- The Federal Reserve has revised its 2026 PCE inflation forecast up sharply, from 2.7% to 3.6%
- The risk of second-round inflationary effects — where energy costs embed into the broader price level — is Citigroup’s primary concern
From Recovery to Renewed Pressure
Entering 2026, the U.S. economic outlook appeared broadly constructive. Inflation had trended down from post-pandemic peaks; the Federal Reserve had delivered three successive quarter-point rate cuts in the final months of 2025; the labour market, while cooling, remained healthy; and consumer spending was proving more resilient than many forecasters expected.
Then, in late February 2026, the United States and Israel launched military operations against Iran, and the macroeconomic calculus changed almost overnight.
The Consumer Price Index rose 4.2% year-on-year in May 2026 — the highest annual reading since April 2023, and a dramatic reversal of the disinflationary trajectory that had defined 2024 and most of 2025 (CBS News, June 2026). The Federal Reserve revised its headline PCE inflation forecast for 2026 up from 2.7% to 3.6% at the June FOMC meeting — a 90-basis-point upward revision in a single quarter, the most aggressive single-meeting inflation reassessment in years (Fox Business, June 17, 2026).
The Oil Price Channel: From $57 to $113
The transmission mechanism is straightforward. Iran’s declaration that the Strait of Hormuz was “closed” on March 4, 2026 — through which approximately 27% of globally traded crude flows — created an immediate and severe supply shock. West Texas Intermediate crude futures rose from approximately $57 per barrel at the start of the year to a peak of $113 in April (U.S. Bank Asset Management, June 2026).
At the pump, the consequences were immediate. U.S. gasoline prices track crude oil prices closely, with a lag of several weeks. By the time WTI peaked in April, American consumers were paying materially more to fill their tanks, heat their homes, and power their businesses. Energy is both a direct component of the CPI and an indirect input cost for virtually every sector of the economy — transportation, manufacturing, agriculture, and retail alike.
The energy shock was the primary driver behind the May CPI reading. Core inflation — which strips out volatile food and energy prices and is the Fed’s preferred gauge of underlying price dynamics — came in at a more contained 2.9% (NPR, June 17, 2026). That 130-basis-point gap between headline and core is the central interpretive challenge facing policymakers: it suggests the inflation is mostly a supply shock rather than a demand-driven phenomenon — but that is cold comfort when households are paying 4.2% more for their consumption basket than they were a year ago.
The Second-Round Effect: The Slow Spread
The more dangerous scenario, from a monetary policy perspective, is not the initial energy price spike — it is what economists call second-round effects. These occur when energy cost increases flow into the prices of non-energy goods and services through transportation costs, higher manufacturing input costs, and wage demands that workers make in response to a higher cost of living.
Citigroup flagged this risk in a late-May research note, warning that the prolonged run-up in crude prices was already beginning to spill into broader inflation pressures, with second-round effects becoming visible in sectors where energy costs are a significant input — logistics, food processing, and industrial manufacturing in particular (CNBC, May 28, 2026). Once second-round effects are embedded in the wage-price dynamic, the supply-shock origin becomes irrelevant: the inflation is self-sustaining regardless of what happens to oil.
This mechanism is why the Federal Reserve — which under normal doctrine would look through a supply-driven energy shock — has moved to a hawkish posture despite the conflict being the source of price pressure. Nine of 18 FOMC members now project a rate hike before year-end 2026 (Fox Business). The committee has explicitly raised its inflation outlook and removed its easing-biased forward guidance. That is not the behaviour of a central bank confident it can look through an energy spike.
Labour Market Complexity
What makes this inflation episode particularly difficult to manage is the backdrop of a surprisingly resilient labour market. U.S. employers added an average of 188,000 jobs per month over the three months to May, and the unemployment rate has held steady at 4.3% for a full year — a remarkably stable number given the geopolitical disruption (CNBC, June 17, 2026).
In a conventional supply-shock inflation scenario, one would expect the real income compression caused by higher energy prices to dampen consumer spending and slow growth — effectively doing the Fed’s tightening work for it. That has not clearly happened yet. Consumer spending has remained resilient, supported by a tight labour market, lower income and corporate taxes enacted earlier in the Trump administration, and fiscal tailwinds from government spending programmes.
The combination of elevated inflation and a still-strong labour market is, in monetary policy terms, the worst of all worlds for a central bank trying to justify patience. It removes the “growth is already slowing” argument that would otherwise support a hold-and-wait posture. The hawks within the FOMC have a clean case: prices are too high, jobs are plenty, and there is no compelling reason to leave rates where they are.
How American Households Are Feeling It
Behind the statistics is a lived economic reality for American households. Inflation has now been running above the Fed’s 2% target for five consecutive years (Fox Business). The compounding effect of sustained above-target inflation on real purchasing power is substantial: a household that was earning $75,000 in 2021 needs approximately $89,000 in 2026 to maintain the same standard of living, even before accounting for the latest energy-driven spike.
The political consequences are significant. Inflation is historically the most potent economic grievance among voters. An inflation reading of 4.2% — after a period when the public narrative had shifted to “inflation is under control” — represents a reputational setback for the administration and a genuine hardship for lower- and middle-income households, who spend a disproportionate share of their income on energy and food.
SNAP benefit restrictions — under active congressional consideration — would compound the impact on the most vulnerable households. Food companies and grocery chains are watching the policy debate closely, as changes to SNAP purchasing rules could meaningfully alter demand patterns for staple goods (CNBC, June 20, 2026).
The Path Forward
The good news — and it is significant — is that the primary driver of the inflation surge is now partially reversing. Brent crude has retreated from its April peak of approximately $113 to approximately $78 by mid-June, as the U.S.-Iran peace framework reduces near-term supply disruption fears (Al Jazeera, June 17, 2026). If Brent settles in the $70–80 range and the Strait reopening is durable, the energy component of CPI should provide disinflationary relief in the June, July, and August prints.
The lagged second-round effects will take longer to unwind. Wage growth that has been pulled higher by workers’ cost-of-living concerns does not retreat immediately when pump prices fall. Transportation costs embedded in goods pricing take months to work out of supply chain contracts. Services inflation — already running hot before the conflict — has limited sensitivity to oil prices in either direction.
The base case, shared by most economists surveyed ahead of the June FOMC meeting, is that inflation moderates back toward 3% by year-end as energy effects dissipate — but that the Fed holds rates steady at best, and hikes once at worst. The stagflationary risk — where growth slows meaningfully while inflation remains above target — is not the central scenario but is no longer a tail risk.
Discover more from The Economy
Subscribe to get the latest posts sent to your email.
IPO
IPO Summer 2026: Anthropic, OpenAI, and the Race to Price Artificial Intelligence on Public Markets

With SpaceX now public, Anthropic has confidentially filed at a ~$965 billion valuation and OpenAI follows at $852 billion. We break down what their IPOs mean for public markets, AI competition, and investors.
Key Takeaways
- Anthropic confidentially filed its S-1 with the SEC on June 1, 2026; OpenAI followed on June 8
- Anthropic’s latest funding values it at approximately $965 billion; OpenAI targets a $852 billion debut valuation
- Anthropic’s annualised revenue run rate crossed $44–47 billion in May 2026, growing at roughly 10x per year
- Both Goldman Sachs and Morgan Stanley are bookrunning both deals, each expected to raise at least $60 billion
- Together with SpaceX, the three mega-IPOs could demand north of $200 billion from public markets in 2026
The Year Public Markets Had to Price AGI
SpaceX’s June 12 debut was historic. But in the longer narrative arc of 2026, it may prove to be the prelude. With Elon Musk’s rocket company now trading on the Nasdaq and raising $85.7 billion in the largest IPO in history, Wall Street’s attention has pivoted immediately to the next act: Anthropic and OpenAI, the two companies whose products are reshaping global knowledge work, coding, legal services, healthcare, and finance — and whose valuations are asking public markets to price something it has never priced before: the plausible path to artificial general intelligence.
The sequence is moving fast. Anthropic confidentially filed its S-1 with the SEC on June 1, 2026, the company confirmed in a blog post that day (Fortune, June 1, 2026). OpenAI followed exactly one week later, on June 8, announcing its own filing rather than allowing it to leak — a signal from Sam Altman’s team that they intend to control the IPO narrative (FutureSearch, June 2026). Both are bookrun by the same dual-bank syndicate: Goldman Sachs and Morgan Stanley, each expected to raise at least $60 billion (FutureSearch).
Anthropic: The Quiet Frontrunner
Twelve months ago, Anthropic was universally described as OpenAI’s challenger. Today, by several key metrics, it has pulled ahead. The company’s annualised revenue run rate crossed $44–47 billion in May 2026, compounding at approximately 10x per year — a growth rate that makes OpenAI’s roughly 3.4x annualised growth look almost conventional by comparison (IndMoney, June 2026; BitMEX).
Anthropic raised $30 billion in a Series G round in February 2026 at a $380 billion post-money valuation, before a $65 billion Series H-1 round in May pushed the private valuation to approximately $965 billion — eclipsing OpenAI’s valuation for the first time (Fortune, June 2026). The company is also on track to post its first-ever operating profit in Q2 2026, projecting approximately $559 million on $10.9 billion in quarterly revenue (IndMoney).
The enterprise thesis is central to Anthropic’s public market story. Approximately 80% of revenue comes from enterprise customers, and Anthropic’s share of the enterprise AI market surpassed OpenAI’s for the first time in April 2026, driven by Claude’s dominance in agentic coding workflows, legal research, and financial analysis (IG UK, June 2026). Anthropic has told investors its annualised run rate will surpass $50 billion by July, and has projected $70 billion in revenue with $17 billion in free cash flow by 2028 (IG UK).
The risks are real. A $5.6 billion net loss in 2024 and a 2028 cash-flow profitability target — rather than an immediate one — mean investors must take a long-dated view. The company is also embroiled in a legal dispute with the U.S. government after the Pentagon designated it a supply-chain risk, a designation Anthropic argues could jeopardise billions in revenue (Fortune). Additionally, a June 12 regulatory action suspending the “Claude Fable” model export has widened the tail risk on Anthropic’s IPO timeline, pushing the p10 downside date out to April 2028 in some analyst models (FutureSearch).
The consensus target date for Anthropic’s listing is December 2026, with a first-day market cap median of approximately $1.10 trillion — which would make it the first pure-enterprise AI safety company to trade publicly, and one of the most valuable companies ever to debut (FutureSearch).
OpenAI: Bigger by Brand, Smaller by Growth Rate
OpenAI carries extraordinary brand recognition — ChatGPT crossed 900 million weekly active users by early 2026 — and its revenue trajectory, while slower than Anthropic’s in percentage terms, is still formidable in absolute terms: revenues grew from approximately $2 billion annualised in 2023 to over $20 billion by end-2025 (IndMoney).
But the loss picture gives public investors pause. FutureSearch estimates OpenAI’s 2026 GAAP net loss at $25–26 billion against a widely cited $14 billion non-GAAP figure — a gap that reflects the difference between the story management is telling on the roadshow and the financial reality a public company must disclose in quarterly filings (FutureSearch). The 90-day post-IPO market cap estimate of $0.86 trillion — materially below the first-day median — reflects the prediction that institutional models, once they have time to fully digest the loss line, will price more conservatively than day-one narrative demand.
OpenAI’s $852 billion debut valuation target positions it slightly below Anthropic’s pre-IPO mark (Fortune, June 2026). The later it lists, the more revenue compounds under the number — meaning OpenAI has a structural incentive to maximise quality of disclosure ahead of its September target rather than rush to beat Anthropic to market.
The Capital Markets Challenge: Can the System Absorb It?
The scale of capital being demanded is genuinely unprecedented. SpaceX alone raised $85.7 billion. Anthropic and OpenAI are each expected to raise at least $60 billion. Total 2026 U.S. IPO proceeds could reach approximately $160 billion, according to Goldman Sachs projections — against a 2025 baseline of $45 billion (IndMoney).
The liquidity case is that there is an estimated $8 trillion sitting in U.S. money market funds. SpaceX’s $85.7 billion raise represents roughly 1% of that pool. Institutional investors who have spent years gaining AI exposure indirectly — via Nvidia for chips, Microsoft for its OpenAI stake, Alphabet for its Anthropic investment — now have the option of owning the underlying models directly. The pent-up demand for pure-play AI exposure is enormous.
The displacement risk is subtler but real. Money rotating into SpaceX, Anthropic, and OpenAI must come from somewhere — and that somewhere is likely existing Magnificent 7 positions or cash allocations that would otherwise flow into other sectors (IndMoney). The portfolio rebalancing triggered by three mega-listings could create meaningful headwinds for established large-cap tech stocks in the second half of 2026.
The Race to First-Mover Advantage
Anthropic’s decision to file first was strategically deliberate. By going to market ahead of OpenAI, the company avoids being overshadowed by its more famous rival and benefits from scarcity — institutional investors who buy Anthropic have less capital available for OpenAI when it comes. OpenAI, meanwhile, gains a tactical advantage from watching how the market prices audited frontier AI financials before committing to its own price.
It is worth noting, as IG UK observes, that both companies filed within days of each other despite being direct competitors — suggesting that both management teams made independent calculations that the post-SpaceX IPO window represents an optimal moment for AI listings, when investor appetite for frontier technology is at a verifiable high and the SpaceX roadshow has done the work of educating institutional allocators on how to think about pre-profitability, mission-driven, deeply moated technology businesses (IG UK).
2026: The Year That Changes Public Markets Forever
If SpaceX, Anthropic, and OpenAI all complete their listings before year-end, 2026 will be remembered as the year public markets were forced to price artificial general intelligence for the first time. Their combined target valuations of approximately $3.6 trillion equal the GDP of France — and they are not asking investors to value what they earn today, but what humanity becomes tomorrow (IndMoney).
That is a proposition without precedent in the history of capital markets. Whether public markets accept it enthusiastically, price it conservatively, or — as some veteran investors warn — create the conditions for a correction of historic proportions when the gap between narrative and quarterly earnings becomes undeniable, is the central investment question of 2026.
Discover more from The Economy
Subscribe to get the latest posts sent to your email.

Goldman Sachs: “The Circulatory System Is Not Working”

Why the U.S. Budget Airline Model Is Running Out of Runway

China’s Oil Shock Absorber: How Beijing Kept Crude Prices Half of What Analysts Predicted

CRH Nears Biggest-Ever Deal to Acquire Arcosa

U.S. Inflation at a Three-Year High: How the Iran War Turned an Economic Recovery Into a Stagflation Risk

IPO Summer 2026: Anthropic, OpenAI, and the Race to Price Artificial Intelligence on Public Markets

Strait of Hormuz Crisis 2026: How a Waterway War Broke Global Oil Markets

Kevin Warsh’s Fed Debut: Rate Hikes Now on the Table as U.S. Monetary Policy Enters a New Era

SpaceX IPO 2026: Inside the $85.7 Billion Listing That Made Elon Musk the World’s First Trillionaire

PSX KSE-100 Up 500+ Points: The Geopolitical Impact on Stocks

Did Anthropic Talk Its Way Into an AI Export Ban?

Big Bonuses for South Korea’s Chip Workers Put Central Bank on Inflation Alert

Easing Iran Tensions Push Mortgage Rates Lower — But a Potential Fed Hike Clouds the Outlook

Paramount’s $111 Billion Warner Bros. Discovery Merger Clears DOJ, But Faces New Hurdles

China Overhauls the World’s Biggest Surveillance Network with Advanced AI

How AI Is Forcing McKinsey and Its Peers to Rethink Pricing

SpaceX IPO: Inside the $2 Trillion Market Debut

KPMG Australia CEO Resigns After Whistleblower Claims Exposed Investigation Failures

PwC China Partner Payouts Cut Amid Evergrande Audit Fraud

Broadcom Market Value Loss: Revenue Forecast Disappoints

The Guardrails Are Down: How Meta and Google’s AI Models Fold Under Pressure

Pakistan Budget FY 2026-27: Relief, Prospects, and the Tightrope Walk

Benefitbay Raises $18M to Build the Plumbing for America’s ICHRA Shift

Nasdaq Tumbles 4% as Chip and Memory Stocks Sink: A $1.2 Trillion Wipeout

Here’s How Much It’ll Cost You to Be Part of SpaceX’s Record-Breaking $75 Billion IPO

Japanese Mid-Sized Firms Flock to Southeast Asia for Growth

Southeast Asia Energy Shock: Economies Struggle to Cope

Singapore Puts a Clock on Wealth: MAS Orders Banks to Halve Account-Opening Times
-

 Markets & Finance6 months ago
Top 15 Stocks for Investment in 2026 in PSX: Your Complete Guide to Pakistan’s Best Investment Opportunities
-

 Analysis4 months ago
Top 10 Stocks for Investment in PSX for Quick Returns in 2026
-

 Analysis5 months ago
Brazil’s Rare Earth Race: US, EU, and China Compete for Critical Minerals as Tensions Rise
-

 Analysis4 months ago
Johor’s Investment Boom: The Hidden Costs Behind Malaysia’s Most Ambitious Economic Surge
-

 Banks5 months ago
Best Investments in Pakistan 2026: Top 10 Low-Price Shares and Long-Term Picks for the PSX
-

 Investment5 months ago
Top 10 Mutual Fund Managers in Pakistan for Investment in 2026: A Comprehensive Guide for Optimal Returns
-

 Global Economy6 months ago
15 Most Lucrative Sectors for Investment in Pakistan: A 2025 Data-Driven Analysis
-

 Global Economy6 months ago
Pakistan’s Export Goldmine: 10 Game-Changing Markets Where Pakistani Businesses Are Winning Big in 2025