
Markets & Finance
Top 7 Banking Stocks for Investment in PSX: Pakistan’s Lenders Are Still Printing Money


Karachi’s trading floor went quiet for a half-second on June 15, 2026, then erupted. The State Bank of Pakistan had just held its policy rate at 11.5% for the second straight review, and bank stocks — which had braced for a cut — instead got six more weeks of fat spreads. Top banking stocks for investment in PSX remain the single most consequential trade on the exchange right now, and the reasons go well beyond a single rate decision.
Pakistan’s commercial banking sector posted its highest-ever half-year profit after tax in 2025, and the momentum hasn’t broken since. What follows isn’t a recycled “buy these banks” list. It’s a sector-by-sector dissection of why seven specific names — and not the other thirteen listed lenders — deserve a place in a PSX portfolio in the second half of 2026.
The Macro Bridge: Why Banks, Why Now
Pakistan’s banking sector recorded a combined profit after tax of $1.15 billion in the first half of 2025, a 19% year-on-year jump, according to an Arif Habib Limited report cited by Business Recorder. That windfall was built on the back of a punishing rate cycle: the policy rate fell from a record 23% in mid-2024 to as low as 10.5% by early 2026, before an unexpected 100-basis-point hike in April 2026 pushed it back to 11.5%, where it has held through June’s review, according to Trading Economics.
That whiplash matters. Banks that hold heavy government paper — Treasury bills, PIBs — earn exceptional spreads in a high-rate environment, and Pakistan’s lenders have feasted on that arrangement for two years running. Headline inflation, meanwhile, accelerated to 11.7% in May 2026, its highest level since June 2024, which is precisely why the central bank chose to hold rather than cut. For equity investors, a “higher for longer” rate stance is uncomfortable for leveraged sectors — but it’s oxygen for banks.
The banking sector hasn’t just participated in the KSE-100’s rally; it has driven it. In a single October 2025 session, Meezan Bank, UBL, Bank AL Habib, HBL, and NBP contributed 1,827 points to the index’s advance, with the Express Tribune reporting Meezan Bank alone gaining 8.65% in a day on aggressive mutual fund buying.
The full-year numbers are more striking still. UBL’s share price surged 121–140% over the trailing twelve months, even as its trailing price-to-earnings ratio sat at a modest 6.08x — a valuation that would look absurdly cheap for a systemically important bank almost anywhere else in the region, per The Economy’s February 2026 PSX analysis. Meezan Bank crossed an all-time high of Rs. 505 in January 2026. MCB delivered a steadier but still substantial 33% return over the same window, according to a PSX investing guide published in April 2026.
Three structural forces explain why this isn’t a bubble built on momentum alone:
- IMF-anchored macro stability. A roughly $7 billion extended fund facility has compressed Pakistan’s sovereign risk premium and restored some foreign portfolio investor confidence.
- A captive deposit base. Pakistan’s banking penetration remains low relative to its population, leaving room for organic deposit growth independent of GDP cycles.
- Fee-income diversification. Digital banking and transaction fee growth are reducing banks’ historical over-reliance on interest rate spreads — a buffer for when rate cuts eventually resume.
How We Picked These Seven — Beyond the Headline Rally
What separates a defensive banking bet from a momentum trap?
The strongest PSX banking picks combine three traits: a dominant or growing deposit franchise, earnings resilience that doesn’t collapse when rates fall, and a valuation that hasn’t fully priced in the next leg of growth. Beta matters too — lower-beta names like Meezan Bank offer smoother exposure for risk-averse capital, while higher-beta names like UBL suit investors chasing momentum.
Picking banking stocks purely on trailing twelve-month returns is the mistake most retail screens make. UBL’s eye-catching rally, for instance, has to be weighed against the reality that net interest margins compress as the SBP’s easing cycle eventually resumes — something the rate hold in April 2026 only delayed, not cancelled. The seven names below were filtered for balance-sheet scale, market capitalization, dividend discipline, and — critically — demonstrated earnings durability through at least one full rate-cutting cycle.
1. United Bank Limited (UBL) — The Valuation Anomaly
UBL is Pakistan’s largest bank by market capitalization and third-largest by total assets, with total assets of roughly Rs. 12.63 trillion and total equity near Rs. 426.4 billion as of 2025, per its Wikipedia-sourced corporate filings summary. It’s a domestic systemically important bank under SBP designation, majority-owned by Bestway Group at 62.13%. The combination of a triple-digit one-year return and a sub-7x trailing P/E is the kind of dislocation value investors wait years to see.
2. Meezan Bank Limited (MEBL) — The Islamic Finance Compounder
Meezan isn’t riding a cyclical wave; it’s riding a structural one. As Pakistan’s largest Islamic bank, MEBL captures a deposit segment that conventional banks cannot compete for by definition — a regulatory and religious moat unique to this name. The bank posted consolidated profit after tax of Rs. 22.42 billion for the quarter ended March 31, 2025, with total assets of Rs. 3.90 trillion and net income of Rs. 101.50 billion for full-year 2024, according to its corporate profile. Its reported beta of 0.89 — the lowest among major banking peers — makes it the defensive anchor of this list.
3. Habib Bank Limited (HBL) — Scale as a Moat
HBL is the country’s oldest post-independence bank and its largest by assets and deposits, founded in 1941 and now operating 1,732 locations nationwide. Revenue reached Rs. 361.1 billion in 2025, with total assets of Rs. 7.71 trillion, per the bank’s public profile. HBL touched an all-time high of Rs. 369.99 in January 2026 before a pullback that some analysts flagged as a buy-on-dip setup ahead of its February 19 earnings release.
4. MCB Bank — The Quiet Compounder
MCB doesn’t generate the headlines UBL or Meezan do, but it has delivered a steady 33% one-year return with none of the volatility associated with higher-beta banking names. Its appeal lies precisely in its lack of drama: consistent profitability, disciplined cost management, and a long history of dividend payouts that reward patient capital rather than momentum traders.
5. Bank Alfalah Limited (BAFL) — The Growth-at-a-Reasonable-Price Pick
Bank Alfalah posted Rs. 171.23 billion in revenue and Rs. 38.31 billion in net income for 2024, on total assets of Rs. 3.71 trillion, according to its corporate filings summary. Backed by Abu Dhabi United Group ownership, BAFL has built a reputation for aggressive digital banking expansion, a strategy that’s beginning to show up in fee-income growth rather than pure interest-rate dependence.
6. Allied Bank Limited (ABL) — The Ibrahim Group Anchor
Allied Bank, founded in 1942 in Lahore as Australasia Bank, posted Rs. 404.74 billion in revenue and Rs. 43.11 billion in net income for 2024, with total equity of Rs. 233.90 billion, per its public profile. ABL’s relatively conservative balance sheet management and steady capital adequacy ratios have made it a recurring institutional favorite for portfolios seeking banking exposure without the volatility of smaller-cap names.
7. National Bank of Pakistan (NBP) — The State-Backed Turnaround Story
NBP is majority state-owned (75.20% via the State Bank of Pakistan) and has historically traded at a discount to private-sector peers — but that discount is exactly the opportunity for contrarian investors. With total assets of Rs. 6.74 trillion and net income of Rs. 26.86 billion in 2024, per its corporate profile, NBP offers the highest torque to any further improvement in public-sector governance or balance-sheet cleanup — a higher-risk, higher-reward addition to round out a seven-stock basket.
The single biggest risk to this entire basket is also the most predictable one: rate normalization. Every analyst note referenced in this piece flags the same tension — banks have feasted on a “higher for longer” environment, and that environment is, by definition, temporary. When the SBP eventually resumes its easing cycle, net interest margins across the sector will compress, and the highest-beta names — UBL chief among them — will feel it first and hardest.
That doesn’t make the sector uninvestable; it changes the holding-period calculus. Investors entering banking stocks now should think in terms of a 12–18 month window that captures the remainder of this elevated-rate phase, rather than assuming today’s spreads are permanent. Diversifying across higher-beta names (UBL, NBP) and lower-beta compounders (Meezan, MCB) is the most direct way to manage that transition risk within the sector itself, rather than exiting banking exposure altogether.
Pakistan’s GDP growth registered 3.7% in FY26, supported primarily by services and industrial activity — modest, but enough to sustain loan book growth even as margins normalize. Fee income, digital transaction growth, and Islamic banking penetration are the three levers analysts point to as the sector’s next earnings driver once the rate tailwind fades.
Not every voice on Pakistan’s banking rally is bullish. The Pakistan Business Forum has openly criticized the SBP’s rate stance as artificially restrictive, arguing borrowing costs are being held high “without economic justification” — a position that, if it prevails, implies faster-than-expected rate cuts and sharper margin compression than current bank valuations assume.
There’s a credit-quality argument too. Pakistan’s banking profits have been overwhelmingly rate-driven rather than loan-growth-driven over the past two years — a structural feature that draws direct parallels to concerns U.S. analysts have raised about deteriorating credit conditions among American regional banks heading into the second half of 2026. If Pakistan’s domestic credit cycle turns before fee-income diversification matures, the banks most exposed to government securities — rather than diversified loan books — could see earnings quality questioned even as headline profits stay elevated.
Currency risk compounds this. The Pakistani rupee’s stability has been a quiet enabler of this entire rally; any renewed pressure on reserves, which analysts estimate need to surpass $18 billion by mid-2026 to maintain import cover, could reintroduce volatility that the equity market hasn’t priced in.
Pakistan’s banking sector occupies an unusual position right now: structurally inexpensive by global standards, propped up by a rate environment that won’t last forever, and increasingly diversified beyond the interest-rate dependence that has defined it for two years. The seven names profiled here — UBL, Meezan Bank, HBL, MCB, Bank Alfalah, Allied Bank, and National Bank of Pakistan — span the full spectrum from high-beta momentum trades to defensive compounders to contrarian state-backed turnarounds.
That spread is the point. A sector this cheap and this profitable doesn’t stay underappreciated indefinitely. The question for investors isn’t whether Pakistan’s banks can keep compounding — it’s how the position is sized for the rate cycle that eventually turns against them.
Discover more from The Economy
Subscribe to get the latest posts sent to your email.


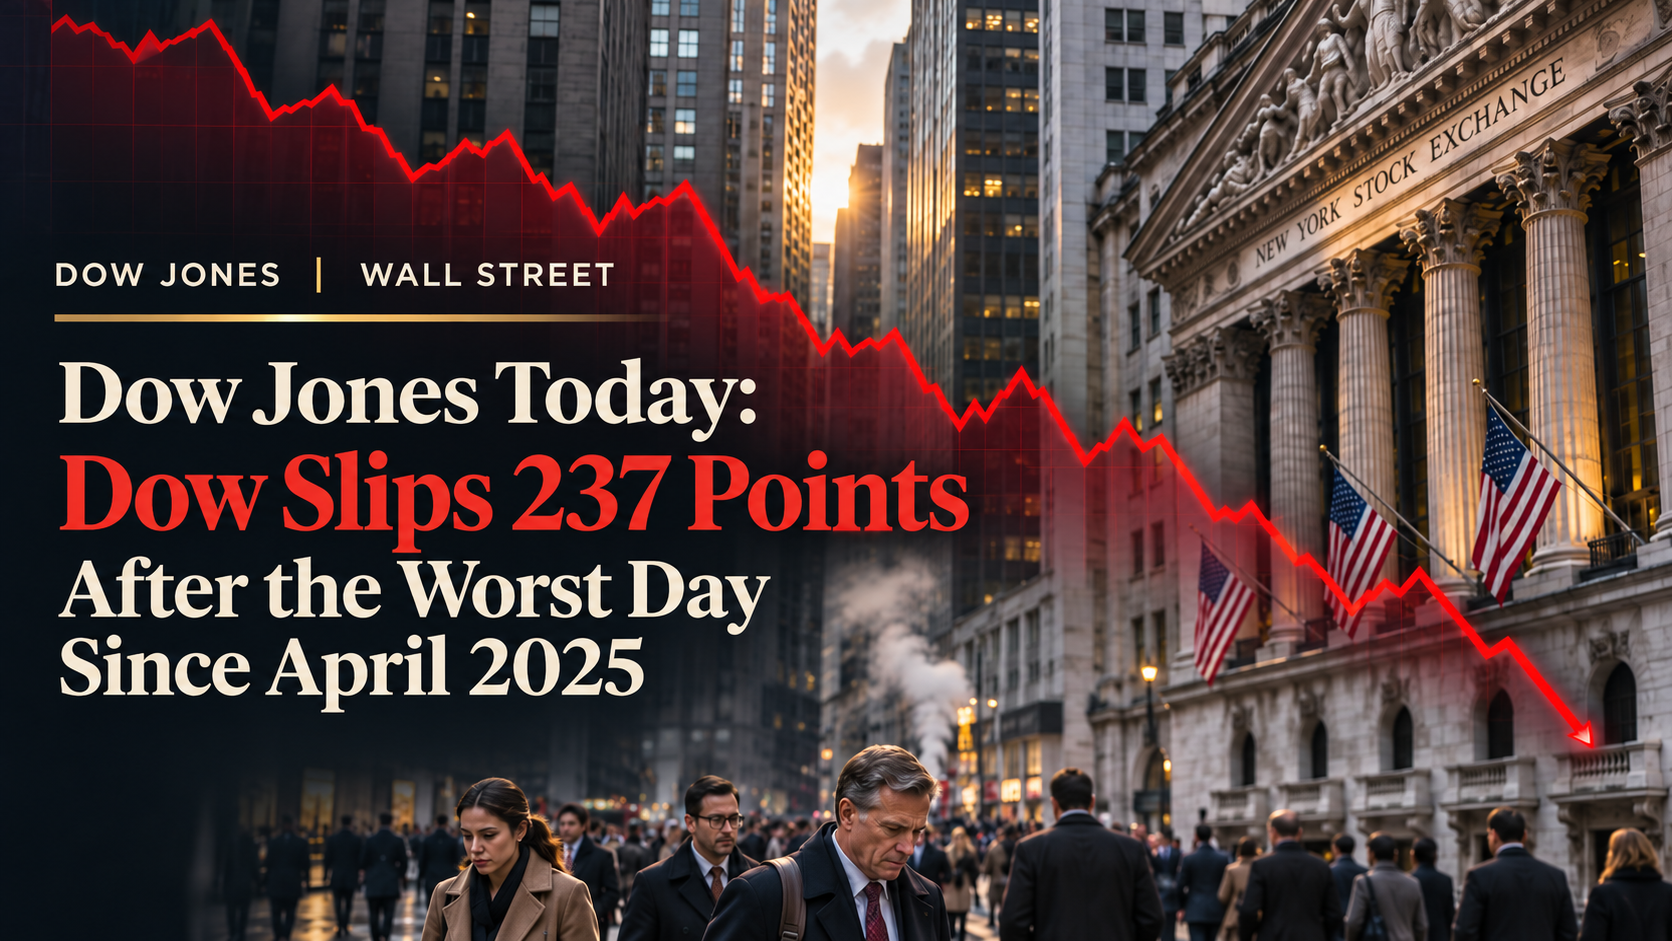
The Dow Jones Industrial Average closed Friday, November 6, 2026, at 51,285.73, down 237.33 points (0.46%). That followed Thursday’s 1,833.06-point (3.4%) plunge to 51,523.06, the worst session for the major averages since April 2025. Over the two days, the Dow lost roughly 3.9%, while the Nasdaq Composite, hit hardest on Thursday, bounced 1.09% on Friday. A much stronger-than-expected October jobs report added a new variable by lifting the odds of a December Fed rate hike.
Where the market stands after Friday’s close
| Index | Thu, Nov 5 | Fri, Nov 6 close | Fri change |
|---|---|---|---|
| Dow Jones Industrial Average | 51,523.06 (−1,833.06, −3.4%) | 51,285.73 | −237.33 (−0.46%) |
| S&P 500 | 7,353.73 (−334.89, −4.4%) | 7,376.86 | +0.31% |
| Nasdaq Composite | 24,315.00 (−1,421.52, −5.5%) | 24,579.42 | +1.09% |
| Russell 2000 | n/a | 2,758.64 | +1.05% |
Sources: CNBC live coverage, Yahoo Finance, TheStreet, Yahoo Finance/Zacks market news.
Calculated from those closes (our arithmetic, not a published figure): from Wednesday’s close to Friday’s, the Dow fell about 3.9%, the S&P 500 about 4.1% and the Nasdaq about 4.5%. The Dow also sits roughly 6.3% below its 52-week high of 54,744.33, per Yahoo Finance’s index page.
What happened on Thursday, November 5
Thursday was a broad rout. All 30 Dow components and all 11 S&P 500 sectors closed lower, according to Zacks via Yahoo Finance. The Nasdaq’s 5.5% drop left it more than 10% below its most recent high, which Wall Street treats as a correction (CNBC).
Reports tie the selling to worries that AI infrastructure could face tighter regulation after Democratic gains in the midterm elections, which triggered profit-taking in technology shares. TheStreet reported that the Nasdaq 100 fell 6.3%, erasing about $2.3 trillion in value, while the S&P 500 lost about $2.8 trillion. Treat the causal story as the market’s leading explanation rather than a proven fact: no one can assign a precise share of the decline to any single trigger.
What happened on Friday, November 6
Friday was a split session. Chip and AI shares rebounded, with Nvidia up 3.9% and AMD up 10.8%, lifting the Nasdaq and S&P 500. The Dow lagged and slipped, with losses in financials, healthcare and consumer services offsetting gains in technology, industrials and consumer goods (Investing.com, Yahoo Finance). The S&P 500 still finished its worst week since June.
Two points deserve attention. First, the Dow’s relative weakness is a reversal: on Thursday the Nasdaq fell hardest, while on Friday the Dow trailed. That is a reminder that a 30-stock average and a tech-heavy index can diverge sharply in both directions. Second, the rebound was narrow. Even with the S&P 500 higher, roughly 182 stocks advanced against 312 decliners at the close, according to one market recap (a lower-authority source, so verify against your terminal before relying on it).
The jobs report that changed the Fed conversation
At 8:30 a.m. ET Friday, the Bureau of Labour Statistics reported that employers added 165,000 jobs in October and unemployment fell to 4.1% from 4.2%. Economists had expected roughly 59,000 to 65,000 jobs (Morningstar, Kiplinger). September payrolls were reported at 60,000, and the trade press noted upward revisions to August and September.
The data matters for stocks because of where the Fed is. Policymakers held the federal funds rate in late October after a September hike, the first in three years, and September inflation data showed prices accelerating. After the report, market-implied odds of a quarter-point hike in December rose to about 80% from 67% (Scotsman Guide). Strong hiring is good news for the economy but a headwind for richly valued growth stocks if it means higher rates for longer. That tension explains why a good jobs number did not produce a clean rally.
One positive offset: the University of Michigan’s preliminary November consumer sentiment reading came in at 51.0, above the 47.5 consensus (CNBC).
Why point losses mislead: how the Dow works
The Dow’s 1,833-point headline sounded dramatic, but the percentage was the better yardstick, and the index’s construction explains why points alone mislead.
- It is price-weighted. The Dow tracks 30 large U.S. companies, and a stock with a higher share price moves the average more than a stock with a lower one, regardless of company size. The S&P 500 and Nasdaq are weighted by market capitalization.
- Points depend on the starting level. A 1,000-point move means far less with the index above 51,000 than it did when the Dow was at 15,000. Use percentages for comparison.
- The divisor adjusts for splits. Stock splits change nominal share prices without changing company value, so the index uses a divisor to keep the average continuous. That makes it risky to say a single company “caused” a point drop.
That is also why the Nasdaq and S&P 500 told a more complete story on Thursday. The Nasdaq carries far more technology and growth exposure, so an AI-driven repricing hit it harder (5.5%) than the Dow (3.4%).
Does the Dow still matter?
Yes, within limits. Its heavier mix of industrial, financial, healthcare and consumer companies cushioned the swings seen in the Nasdaq, as Yahoo Finance noted. But 30 companies cannot represent the whole economy. For a fuller read, pair it with the S&P 500, Nasdaq, small caps, Treasury yields and credit spreads.
What to watch next
- October inflation report (November 10). A hot reading would strengthen the case for a December hike.
- FOMC minutes (November 18) for how divided policymakers were. Two of 12 voters reportedly favored a hike in October.
- November jobs report (December 4).
- Policy signals on AI infrastructure and data-centre permitting, which drove Thursday’s sell-off.
- Breadth and credit. Watch whether weakness spreads to banks, transports and consumer stocks, or whether the sell-off stays contained to technology.
Dates are from Rio Times; confirm against the BLS and Federal Reserve calendars.
FAQ
How much did the Dow fall on November 5, 2026? 1,833.06 points, or about 3.4%, to close at 51,523.06.
Where did the Dow close on November 6, 2026? At 51,285.73, down 237.33 points (0.46%).
Is the Dow the entire stock market? No. It holds 30 large U.S. companies and is price-weighted.
Why use percentage changes instead of points? Percentages scale to the index level, so moves are comparable across years and indexes.
Why did the Nasdaq fall more than the Dow? It holds far more technology and AI-related stocks, which led the sell-off.
Discover more from The Economy
Subscribe to get the latest posts sent to your email.

The November 5 decline was severe. Calling it a systemic crash, however, requires evidence beyond a frightening index percentage.
The November 5 decline was severe. Calling it a systemic crash, however, requires evidence beyond a frightening index percentage. This analysis draws on primary documents and contemporaneous reports available on November 6, 2026; subsequent market movements or policy announcements may change the outlook.
On November 5, 2026, the Dow Jones Industrial Average lost about 3.4%, the S&P 500 declined 4.4% and the Nasdaq Composite dropped 5.5%, according to the Associated Press market recap. Chipmakers and AI infrastructure shares were especially hard hit. Reuters also documented a steep slump in the Philadelphia Semiconductor Index.
These movements demand serious coverage, but the term “stock market crash” has no single universal percentage threshold. A large daily decline can be part of a correction, a panic, a bear market or a crisis. Each description implies something different about duration, economic damage and financial stability. The most useful answer is therefore diagnostic rather than theatrical.
Crash, correction and bear market are not synonyms
A common market convention describes a correction as a decline of at least 10% from a recent high and a bear market as a decline of at least 20%. These are descriptive conventions, not mechanical forecasts of what happens next. A crash usually refers to a rapid, disorderly fall, but usage varies. A systemic financial crisis is more demanding: it implies dysfunction in credit provision, payments or major institutions.
When a single sector falls much more than the broad index, concentration and leverage become important. The NASDAQ can enter correction territory without the entire U.S. financial system being in distress.
What was being repriced?
The November move centred on highly valued AI and technology names. Investors questioned returns on data-centre expansion, financing conditions and political constraints on new construction. Companies with strong current revenue can sell off if expected future cash flows no longer justify their market capitalisation.
The IMF had already highlighted an AI-expectations reassessment as a risk in its October outlook. That does not prove that the IMF predicted a specific trading session; it shows why the underlying vulnerability matters beyond the day’s market narrative.
What would make this a broader financial danger?
Watch high-yield credit spreads, funding rates, banking stress, margin calls and liquidity in government bond markets. A widening spread indicates investors are demanding more compensation for credit risk. Disorderly selling in unrelated assets may indicate attempts to raise cash. But ordinary volatility in equities—even severe volatility—does not itself establish a breakdown of the financial system.
Economic vulnerability also depends on consumers and companies. If share declines cause businesses to cancel capital spending or households to sharply reduce consumption, market turbulence can spill into real activity. If financing and employment remain resilient, a market correction may stay contained.
How to avoid being misled by panic headlines
Always identify the time interval. “Down 5% today” is different from “down 5% from the all-time high.” Distinguish the official close from intraday lows. Check whether quoted returns include dividends or currency translation. Compare equal sessions rather than a U.S. Thursday close with an Asian Friday intraday figure.
The correct response to uncertainty is a decision framework, not a binary bottom call. Investors should consider liquidity needs, diversification, concentration and suitability for their own circumstances. No article can responsibly guarantee that selling or buying immediately after a large decline will be profitable.
What a closer look at the source record shows
The available record supports a useful separation between confirmed developments and interpretation. The first column below identifies the type of evidence; the second explains the analytical use, not an independently measured market statistic.
| Research focus | How it informs this story |
|---|---|
| Confirmed evidence | AP market close |
| Interpretive opportunity | Define crash precisely |
| Secondary question | Credit stress checklist |
| Next verification | Update after each U.S. market close; avoid mixing session-level and cumulative declines. |
The research priority is relevance rather than sheer citation volume. Repeated references to the same press release do not represent independent confirmation, and authoritative data can support a narrower claim than an ambitious headline suggests. Wherever a numerical fact is used, the source date and stated coverage should travel with it.
How to interpret the evidence without overclaiming
A frightening move is not itself a credit failure. A systemic crisis requires more evidence than equity price volatility. Funding spreads, bank conditions and collateral liquidity provide important context. In this article’s subject—the 2026 stock market crash 2026—that distinction prevents superficially precise figures from becoming misleading conclusions. A credible account should explain exactly which evidence supports each inference and what would change the analysis.
Risk management begins before a headline. Time horizon, cash needs and concentration determine an investor’s vulnerability. A universal buy-or-sell instruction ignores personal circumstances. Update after each U.S. market close; avoid mixing session-level and cumulative declines. These checks are important because individual data points can be correct while the story assembled from them is incomplete.
Three specific tests make the coverage stronger:
- Define crash precisely. Ask what the underlying observation actually measures, which population or companies it covers, and how recent it is. A relevant primary document outweighs a popular unsourced claim.
- Credit stress checklist. Compare plausible explanations and resist attributing every market or policy movement to one event. When an observed change has several possible causes, explain which are supported and which remain hypotheses.
- Avoid false predictive certainty. Describe what new fact would falsify the prevailing interpretation. Reporting that cannot be revised in the face of new evidence is advocacy, not analysis.
Distinguishing three kinds of market aftermath
A contained correction. Earnings expectations and risk appetite adjust while banks and credit markets continue functioning. Prices may stabilise after volatile sessions, though the original peak may take time to regain. The confirmation is not a single green trading day; it is a sustained narrowing in funding stress, less forced selling and resilient corporate guidance across sectors.
A wider demand shock. If declining equity values, expensive borrowing and cancelled infrastructure projects cause companies to cut hiring or spending, markets can influence the real economy. Widening credit spreads and weaker employment would matter more than another dramatic intraday quote. Policymakers might face difficult trade-offs if inflation remains elevated at the same time.
A leadership shift. Highly valued AI equities could underperform while cash-generating industrial, consumer or defensive businesses hold up comparatively well. The indexes might stay choppy without a generalised failure of finance. Watch earnings dispersion and sector breadth. Historical labels such as “correction” and “bear market” describe price behaviour; they cannot reliably tell readers when the next sustained advance begins.
A practical research checklist
A reader evaluating this issue should first open the primary sources linked in the article and check their publication dates. Next, identify the specific claim being tested, its units and its geographic or institutional scope. Then compare that evidence with at least one independent account, asking whether the sources are reporting the same underlying data or repeating one another. Finally, distinguish a dated observation from a prediction and note the developments that would demand an update.
For a working editorial desk, this sequence is equally important. A clearly dated article can remain valuable after prices or politics change if its explanations endure and its volatile numbers are identified as snapshots. An article that quietly presents yesterday’s quote as today’s fact, by contrast, loses credibility even when the broader argument is sensible.
A final distinction worth checking
A comparison with past crashes requires more than matching the size of a daily move. The starting valuation, interest-rate setting, banking system, policy response and market plumbing can differ substantially. Two days with identical index losses may have radically different consequences for household wealth and corporate financing. For readers searching for an actionable signal, these structural differences deserve priority over charts suggesting that a historic pattern will automatically recur. Market history is a set of comparisons, not a reliable calendar for the next rebound.
Questions readers are asking
Did U.S. stocks crash on November 5?
They experienced a severe sell-off; whether to call it a crash depends on definition and subsequent developments.
What is a correction?
A commonly used convention is a drop of at least 10% from a recent market high.
Does a crash cause a recession?
Not always. Market losses can affect economic activity, but recession outcomes depend on credit, employment, spending and policy.
What should I check before reacting?
Official close, cumulative drawdown, portfolio concentration, credit conditions and whether the news changed underlying fundamentals.
The judgement
The November 5 decline was severe. Calling it a systemic crash, however, requires evidence beyond a frightening index percentage. The most responsible conclusion is conditional: Update after each U.S. market close; avoid mixing session-level and cumulative declines. The argument should evolve when new source material is published, rather than being defended simply because it made a compelling headline on November 6. For readers, the value is a clearer distinction among what has already happened, what remains uncertain and what developments would actually change the decision.
Discover more from The Economy
Subscribe to get the latest posts sent to your email.

Singapore’s stock market has a different vulnerability from the Nasdaq: banks, dividends, interest margins and the currency policy that shapes returns.
Singapore’s stock market has a different vulnerability from the Nasdaq: banks, dividends, interest margins and the currency policy that shapes returns. This analysis draws on primary documents and contemporaneous reports available on November 6, 2026; subsequent market movements or policy announcements may change the outlook.
Singapore’s Straits Times Index gained 0.5% to 5,296.25 on November 5, according to The Business Times, even as technology shares elsewhere were under pressure. The same session saw diverging performances among DBS, OCBC and UOB. This is a reminder that the STI is not a miniature Nasdaq. Its sector composition, income characteristics and investor base create different drivers.
The Monetary Authority of Singapore’s October 2026 statement kept the Singapore dollar on an appreciating policy path, expecting both core and headline inflation to average 1.5%–2.5% in 2027. The central bank also warned of risks from higher energy prices and a possible slowdown in the AI-driven cycle.
What bank-heavy’ really means
A bank-heavy index reacts to loan growth, deposit costs, net interest margins, provisions and dividend expectations. A strong economy supports credit demand, but margins can compress even when borrowers remain healthy. Conversely, higher interest rates may temporarily help asset yields while increasing deposit competition and credit risk.
DBS, OCBC and UOB cannot be treated as interchangeable. Each has a different business mix and geographic exposure; results and management commentary should drive comparisons. The November 5 session illustrated the point: DBS and OCBC rose modestly while UOB declined, according to the same local report.
Currency policy is an investment variable.
MAS targets the exchange rate rather than a conventional domestic policy interest rate. A gradually appreciating Singapore dollar can restrain imported inflation, particularly relevant when oil and food prices are volatile. But it may also affect translated overseas earnings and the returns of foreign investors.
The relevant calculation is total return in the investor’s base currency: price change, dividends and currency appreciation or depreciation. A headline STI gain in Singapore dollars is not necessarily identical to the outcome for someone financing a portfolio in U.S. dollars, Malaysian ringgit or another currency.
REITs are not simply a bond substitute.
S-REITs offer exposure to property cash flows, but distributions depend on occupancy, rents, debt refinancing and asset values. When funding costs remain high, leverage and upcoming debt maturities matter as much as the headline distribution yield. The distinction becomes sharper in a world where global government bond yields are elevated.
A credible screening process examines interest coverage, weighted average debt maturity, hedging, tenancy concentration and asset location. A high yield may represent a sound income asset—or a warning that investors expect a distribution cut. The yield alone cannot tell the reader which.
The 2027 outlook hinges on earnings quality.
Singapore benefits from finance, logistics, wealth management and high-value manufacturing but is highly exposed to global trade. MAS expects AI-related regional activity to moderate into 2027. That creates both a threat to manufacturing momentum and potential relief from some imported input costs if the cycle cools in an orderly fashion.
The best base case is not that the STI will evade every global sell-off. It is that bank profitability and resilient dividends can provide an alternative source of return. A bearish scenario would combine shrinking margins, credit losses, high refinancing costs and weaker global demand.
What a closer look at the source record shows
The available record supports a useful separation between confirmed developments and interpretation. The first column below identifies the type of evidence; the second explains the analytical use, not an independently measured market statistic.
| Research focus | How it informs this story |
|---|---|
| Confirmed evidence | The Business Times Nov 5 report |
| Interpretive opportunity | Bank margins versus STI return |
| Secondary question | FX-adjusted performance |
| Next verification | Monitor each bank’s margin guidance, REIT refinancing calendars and the next MAS policy update. |
The research priority is relevance rather than sheer citation volume. Repeated references to the same press release do not represent independent confirmation, and authoritative data can support a narrower claim than an ambitious headline suggests. Wherever a numerical fact is used, the source date and stated coverage should travel with it.
How to interpret the evidence without overclaiming
Returns should include dividends and currency. Singapore blue-chip investors often consider income alongside capital appreciation. Sustainable distribution policy and changes in the Singapore dollar can alter the comparison with other markets. In this article’s subject—the Singapore stock market outlook 2027—that distinction prevents superficially precise figures from becoming misleading conclusions. A credible account should explain exactly which evidence supports each inference and what would change the analysis.
Property and banking are economically connected. Financing costs influence both commercial property values and bank lending profitability. They may respond differently, though, because banks and leveraged property trusts have different asset-liability structures. Monitor each bank’s margin guidance, REIT refinancing calendars and the next MAS policy update. These checks are important because individual data points can be correct while the story assembled from them is incomplete.
Three specific tests make the coverage stronger:
- Bank margins versus STI return. Ask what the underlying observation actually measures, which population or companies it covers, and how recent it is. A relevant primary document outweighs a popular unsourced claim.
- FX-adjusted performance. Compare plausible explanations and resist attributing every market or policy movement to one event. When an observed change has several possible causes, explain which are supported and which remain hypotheses.
- REIT debt maturity analysis. Describe what new fact would falsify the prevailing interpretation. Reporting that cannot be revised in the face of new evidence is advocacy, not analysis.
A Singapore investor’s 2027 scenario map
Dividends hold, and margins normalise gently. If credit quality stays strong and loan growth offsets some narrowing in lending margins, the major banks may remain an important source of total return. For income investors, sustainable distribution policies would matter more than the STI’s ability to match the Nasdaq in a technology rally. MAS’s appreciating currency path could also cushion imported price pressure.
Funding costs expose fragile yields. High global yields and softening property rents could pressure highly leveraged REITs; expensive deposits and weak loan demand could test bank profitability. In this scenario, a superficially generous distribution yield would be less attractive when weighed against refinancing risk and possible cuts. Study debt maturities and asset quality rather than chasing the highest published yield.
The index proves resilient but slow. A third outcome is steady dividends with limited capital appreciation as global trade cools and Singapore’s exceptional manufacturing boost fades. That may still suit a long-horizon income mandate, but international investors must account for currency effects. The relevant benchmark is a risk-adjusted, dividend-inclusive return compared with alternatives of similar risk.
A practical research checklist
A reader evaluating this issue should first open the primary sources linked in the article and check their publication dates. Next, identify the specific claim being tested, its units and its geographic or institutional scope. Then compare that evidence with at least one independent account, asking whether the sources are reporting the same underlying data or repeating one another. Finally, distinguish a dated observation from a prediction and note the developments that would demand an update.
For a working editorial desk, this sequence is equally important. A clearly dated article can remain valuable after prices or politics change if its explanations endure and its volatile numbers are identified as snapshots. An article that quietly presents yesterday’s quote as today’s fact, by contrast, loses credibility even when the broader argument is sensible.
A final distinction worth checking
One additional constraint deserves attention: financial-sector concentration can make the benchmark appear stable even while many smaller Singapore-listed businesses experience weaker trading volume. The STI is not a complete measure of the exchange’s breadth. Before labelling Singapore a safe haven, compare advance-decline statistics, dividend coverage and credit trends beyond the three largest lenders. A foreign investor should also calculate returns after currency conversion and any applicable withholding treatment. These checks reveal whether resilience comes from sustainable operating cash flows or merely from limited exposure to the companies currently being sold.
Questions readers are asking
What is the STI?
The Straits Times Index is Singapore’s principal blue-chip equity benchmark, with substantial exposure to banks and other established businesses.
Does MAS set policy like the U.S. Fed?
No. Singapore’s monetary framework primarily manages the Singapore dollar nominal effective exchange-rate policy band.
What matters most for bank stocks?
Net interest margin, loan growth, asset quality, fee income, capital ratios and sustainable dividends.
Are REIT yields guaranteed?
No. Distributions and unit prices fluctuate with financing, leasing and property conditions.
The judgment
Singapore’s stock market has a different vulnerability from the Nasdaq: banks, dividends, interest margins and the currency policy that shapes returns. The most responsible conclusion is conditional: Monitor each bank’s margin guidance, REIT refinancing calendars and the next MAS policy update. The argument should evolve when new source material is published, rather than being defended simply because it made a compelling headline on November 6. For readers, the value is a clearer distinction among what has already happened, what remains uncertain and what developments would actually change the decision.
Discover more from The Economy
Subscribe to get the latest posts sent to your email.

Dow Jones Today: Dow Slips 237 Points After the Worst Day Since April 2025

Australia’s AI-Driven Economic Strategy Is Redefining National Resilience

2027 Federal Tax Brackets: New IRS Rates and Standard Deductions Explained

Democrats Won Congress. Can They Fix the U.S. Economy

Stock Market Crash 2026? What the November Rout Actually Tells Us

IMF Global Outlook 2027: The Recovery Is Real, but the Divide Is Growing

World Bank Debt Report 2026: The $9.4 Trillion Burden Behind the Recovery

Singapore Stock Market Outlook 2027: The STI’s Bank-and-Yield Test

Asian Stock Markets: Why the AI Rout Is Dividing the Region

Global Markets Today: The AI Sell-Off Has Become a Test of Liquidity

Global Finance 2027: Debt, Inflation and AI Are Pulling the Economy Apart

Brian Kemp’s Georgia Legacy: Economic Growth, Elections and the Costs of His Policy Choices

Dow Futures vs Dow Jones: What E-mini Contracts Really Tell You Before Wall Street Opens

China Tape Maker Stock Debut: Crown New Materials Soared 787%

Crude Oil & Petroleum Market Analysis: OPEC+ Decisions and Price Forecasts

Top US Convenience Store Chains: Store Counts, EV Charging, and Sales Trends

Social Security Extra $90 Deposit: Who Qualifies for the October 2026 Medicare Rebate?

Gold Price Outlook 2026: The Forces Behind the Forecasts—and What Could Reverse Them

Stock Market Crash in 2026? Warning Signs, Scenarios and a Calm Investor Checklist

US–Iran Conflict in October 2026: Hormuz, Oil Prices and Diplomacy

US–China Critical Minerals Competition: Why a Trade Deal Cannot Fix Every Supply Risk

Anthropic Bans Sustained Abuse of Claude AI Under New Usage Policy Effective November 12, 2026

SSI November 2026 Payment: Why Benefits Arrive October 30

US–China AI Export Controls in 2026: Chips, Testing Rules and Corporate Risk

China’s AI Microdrama Boom: How Beijing Is Reshaping Global Media

Pakistan IMF Programme 2026: Why Bailouts Keep Returning

Jeff Bezos Three-Day Workweek View: What He Really Said

Q3 2026 Earnings Preview: Can Record Profit Expectations Keep Wall Street’s Rally Alive?
-

 Markets & Finance10 months ago
Top 15 Stocks for Investment in 2026 in PSX: Your Complete Guide to Pakistan’s Best Investment Opportunities
-

 Analysis9 months ago
Johor’s Investment Boom: The Hidden Costs Behind Malaysia’s Most Ambitious Economic Surge
-

 Analysis9 months ago
Top 10 Stocks for Investment in PSX for Quick Returns in 2026
-

 Banks10 months ago
Best Investments in Pakistan 2026: Top 10 Low-Price Shares and Long-Term Picks for the PSX
-

 Analysis9 months ago
Brazil’s Rare Earth Race: US, EU, and China Compete for Critical Minerals as Tensions Rise
-

 Investment10 months ago
Top 10 Mutual Fund Managers in Pakistan for Investment in 2026: A Comprehensive Guide for Optimal Returns
-

 Global Economy10 months ago
15 Most Lucrative Sectors for Investment in Pakistan: A 2025 Data-Driven Analysis
-

 Global Economy10 months ago
Pakistan’s Export Goldmine: 10 Game-Changing Markets Where Pakistani Businesses Are Winning Big in 2025