
Analysis
Tokyo’s Soaring Property Prices: Supply Constraints as a Double-Edged Sword Under PM Sanae Takaichi’s Watch

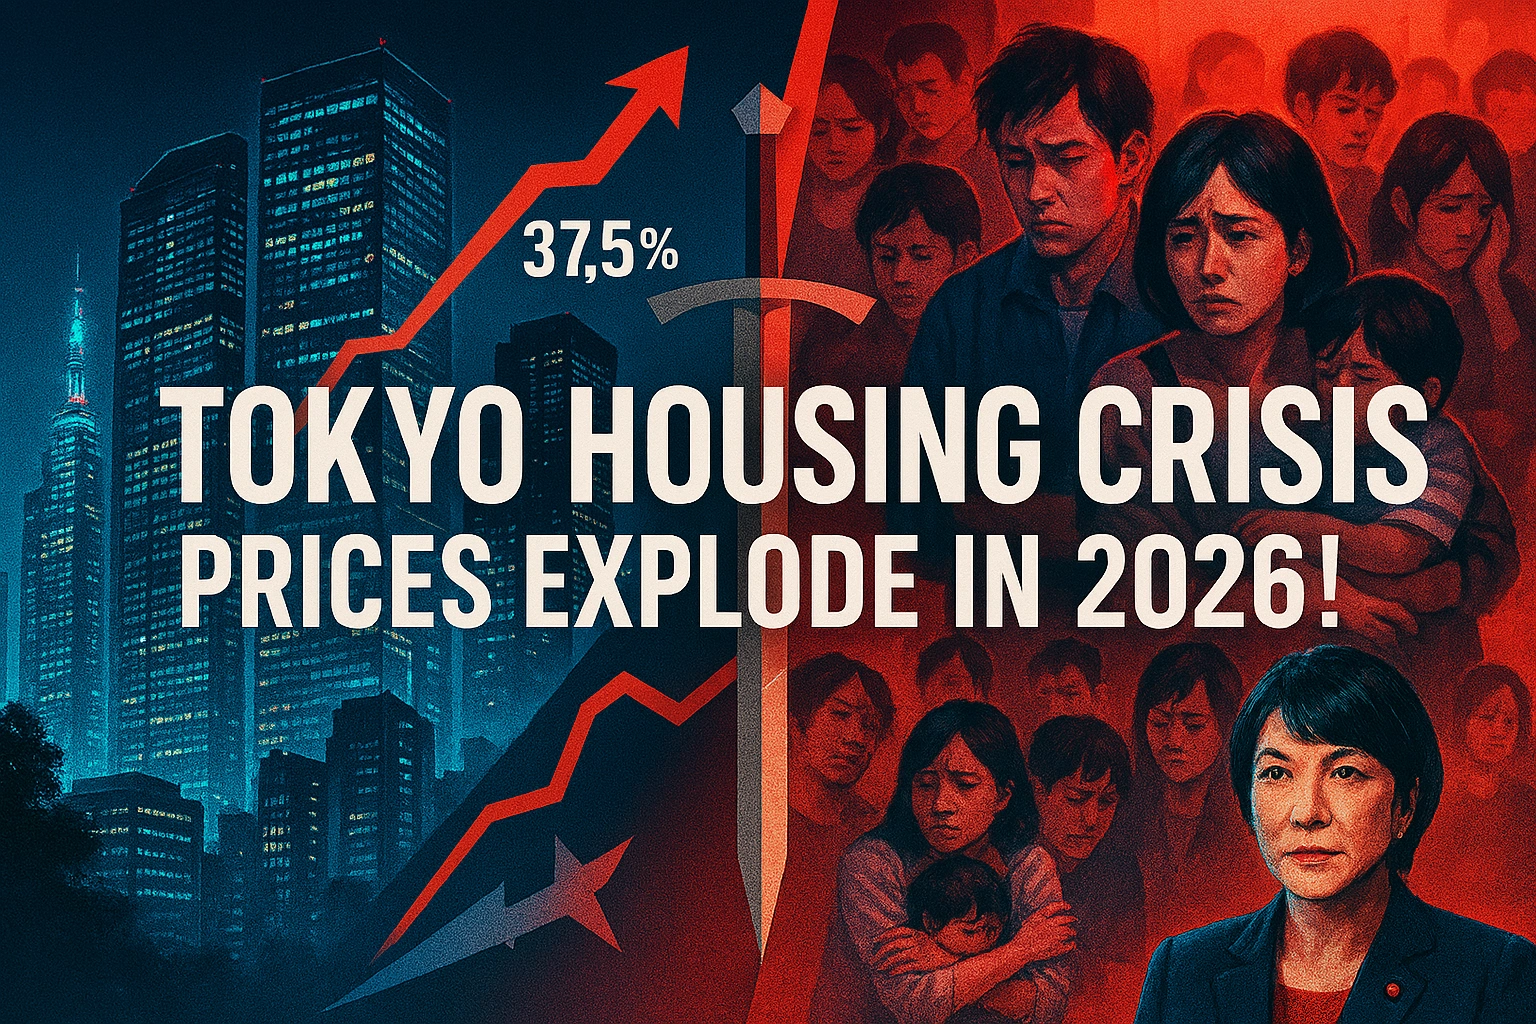
A landslide electoral victory has empowered Japan’s first female Prime Minister to reshape immigration and housing policy—but her agenda may deepen the affordability crisis gripping Asia’s megacities
Two days after Japan’s historic February 8 election, Tokyo’s real estate brokers are fielding anxious calls from foreign buyers wondering if their property dreams are about to evaporate. Prime Minister Sanae Takaichi’s landslide victory—securing 316 of 465 seats in the Diet, the largest mandate since World War II—has crystallized a political pivot with profound implications for one of Asia’s most overheated housing markets. Her campaign promises of stricter immigration controls and tougher requirements for foreign property owners are colliding with an uncomfortable economic reality: Tokyo’s property prices averaged ¥91.8 million ($597,810) in 2025, a 17% surge that reflects not foreign speculation, but a structural crisis decades in the making.
The newly empowered Prime Minister faces a dilemma that echoes across Asia’s booming capitals, from Seoul to Sydney. Housing affordability has become a political lightning rod, and the instinct to blame foreign buyers is politically expedient. Yet the data tells a different story—one where supply constraints, demographic shifts, and domestic demand dynamics are the true architects of this affordability catastrophe.
The Anatomy of Tokyo’s Price Explosion
Walk through Tokyo’s Minato ward on a Tuesday morning and the construction cranes tell only half the story. Despite the skyline’s perpetual evolution, Tokyo’s new condominium supply in 2025 plunged to its lowest level since 1973. This supply drought, combined with surging construction costs and a labor shortage that has contractors competing ferociously for workers, has created a perfect inflationary storm.
The numbers are staggering. In March 2025, the average price of new apartments in Greater Tokyo hit ¥104.85 million, representing a 37.5% year-over-year increase—only the second time in history that monthly averages exceeded ¥100 million. In Tokyo’s central 23 wards, prices soared even higher, reaching ¥136.1 million, a 21.8% jump from 2024. The six core municipalities—Chiyoda, Chūō, Minato, Shinjuku, Shibuya, and Bunkyō—saw the average new condominium price rocket to ¥195 million.
Even the used apartment market, traditionally more stable, experienced unprecedented turbulence. Used apartments in Tokyo’s 23 wards posted a 28.3% year-over-year increase in April 2025, the highest growth rate since data collection began. Property analysts project that Tokyo property prices will continue to increase by 5-6% annually in 2026, representing a slight deceleration from 2025’s blistering pace but still far outstripping wage growth.
“Developers are focusing on central locations where they can sell luxury condos and justify the pricing,” Zoe Ward, CEO of brokerage Japan Property Central, explains. “A lot of their inputs will be construction costs and land pricing.” This concentration on high-margin luxury developments has created a bifurcated market where the wealthy secure prime real estate while middle-class Japanese families are increasingly priced out of ownership in their own capital.
Takaichi’s Conservative Mandate and the Immigration Scapegoat
Takaichi’s electoral triumph on February 8 was built partly on promises to address what she frames as “anxiety and a sense of unfairness” about foreigners in Japan. During her campaign, she pledged tougher immigration policies, including stricter requirements for foreign property owners and caps on foreign residents. Her coalition agreement with the Japan Innovation Party includes formulating a “population strategy” by the end of fiscal year 2026, complete with numerical targets for accepting foreigners.
Within days of taking office in October 2025, Takaichi established a ministerial meeting on foreign policy and created a new cabinet position—minister of “a society of well-ordered and harmonious coexistence with foreign nationals”—headed by Economic Security Minister Kimi Onoda. The government has already announced that starting in fiscal year 2026, foreign nationals will be required to declare their nationality when purchasing property, with copies of passports or residence cards submitted to authorities.
The political calculus is clear. Japan’s property prices have become a flashpoint for public frustration, and immigration provides a convenient target. Takaichi’s rhetoric taps into genuine anxieties—real wages have stagnated while housing costs have skyrocketed—but directs blame toward a demographic that represents just 3% of Japan’s population and accounts for roughly 27% of property transactions nationwide (and 20-40% of new apartments in central Tokyo, according to Mitsubishi UFJ Trust & Banking Corp).
Yet here’s the uncomfortable truth the data reveals: foreign buyers aren’t driving Tokyo’s affordability crisis. They’re beneficiaries of it.
The Real Culprits: Supply Shortages and Structural Dysfunction
Tokyo’s housing crisis is fundamentally a supply story. New condominium supply in the Tokyo metropolitan area declined 4.5% in 2025 to just 21,968 units—the lowest point in more than half a century. Meanwhile, demand remains robust. Net migration continues to favor Tokyo and the capital region as young professionals flee provincial cities for better opportunities. Household formation rates, driven by younger workers and an increasing number of single-person households, continue to outpace new construction.
The weak yen has certainly attracted foreign capital—the currency’s depreciation has increased the costs of imported raw materials while making Japanese assets cheaper for international buyers. But foreign investment is flowing into a market already constrained by:
Labor shortages: Japan’s construction industry faces a severe demographic crunch, with an aging workforce and insufficient young workers entering the trades. This scarcity drives up labor costs and slows project timelines.
Rising construction costs: Beyond labor, material costs have surged. New buildings must meet stricter energy efficiency standards to qualify for tax incentives, further inflating development expenses.
Regulatory complexity: Land use regulations and planning processes remain byzantine, delaying projects and limiting density in areas where demand is highest.
Investor behavior: With ultra-low interest rates (the Bank of Japan only recently raised its policy rate to 0.75%, still historically modest), Japanese investors and homeowners have reinvested massive capital gains back into the housing market, widening the gap for first-time buyers.
The residential property price index in the Tokyo Metropolitan Area rose 8.14% year-over-year in January 2025—but when adjusted for inflation, growth was a more modest 3.95%. Nationally, residential prices increased 10.7% in 2025. These aren’t speculative bubbles driven by foreign money; they’re the inevitable consequence of structural undersupply meeting persistent demand.
Asia’s Affordability Crisis: A Regional Epidemic
Tokyo is not an outlier. Across the Asia-Pacific region, major cities are grappling with parallel crises that expose the limits of blaming foreign investment for homegrown policy failures.
In Seoul, apartment prices rose roughly 8.7% in 2025—the fastest annual gain in nearly two decades, according to Korea Real Estate Board data. Prime districts like Songpa-gu, Yongsan-gu, and Seocho-gu posted monthly gains above 2% in late 2025. Seoul homes now average 1.4 billion KRW while the national average sits near 470 million KRW, making Seoul roughly three times pricier than the rest of South Korea. The city’s unique jeonse rental system—where tenants pay lump-sum deposits of 50-80% of property value—is pushing more renters toward outright purchases, further inflaming demand.
Seoul’s affordability crisis shares Tokyo’s structural DNA: supply constraints driven by limited land availability, high construction costs, and regulatory hurdles. Foreign investors now account for a significant portion of Seoul’s premium real estate market, but as with Tokyo, they’re capitalizing on—not creating—the supply-demand imbalance.
Further south, Australia presents perhaps the starkest illustration of housing dysfunction. Over the past five years, median advertised rents rose approximately 48% for both houses and units, with the strongest increases in Hobart (64%), Adelaide (57%), and Perth (50%). Australian home values climbed 47.3% since March 2020, adding about $280,000 to the median dwelling value, while median annual household income increased just 15%. Tenants now dedicate a record 33.4% of their income to rent.
The Australian case exposes the futility of immigration scapegoating. Despite foreign buyer restrictions implemented in recent years, supply shortages persist. The National Housing Supply and Affordability Council projects that 938,000 new dwellings will be built over the five-year Housing Accord period—a shortfall of 262,000 dwellings relative to the 1.2 million target. Labor shortages, high material costs, and financing constraints continue to weigh on new supply.
The Double-Edged Sword of Supply Constraints
Supply constraints function as a double-edged sword in Tokyo’s housing market. On one edge, limited new construction protects existing property owners’ equity, creating a politically powerful constituency that benefits from scarcity. Homeowners who purchased properties years ago have seen valuations soar—wealth accumulation that reinforces the LDP’s traditional base.
On the other edge, this same scarcity devastates affordability for younger Japanese, first-time buyers, and middle-class families. The price-to-income ratio has stretched to unsustainable levels. In Tokyo’s eastern suburbs, it would take an average wage earner 35 years to save a 20% deposit for a median-priced house. Even clearing that hurdle, servicing the mortgage would consume one-and-a-half times their income.
Takaichi’s immigration restrictions, even if fully implemented, won’t resolve this fundamental tension. Requiring foreign buyers to declare nationality and submit documentation may provide political theater, but it does nothing to address the core problem: Japan isn’t building enough housing where people want to live.
The government’s own data shows a cumulative shortfall of approximately 600,000 housing starts over the past four years due to delays in permits and construction. Seoul’s apartment move-in volume in 2026 is projected to fall to 16,412 units, a 48% drop from 2025. These supply crunches dwarf any impact from foreign investment flows.
What Takaichi’s Government Should Actually Do
If the new Prime Minister is serious about addressing Tokyo’s housing affordability crisis—and the cost-of-living pressures that animated her electoral mandate—her government must confront the structural impediments to supply expansion. Political expedience will tempt her toward performative restrictions on foreign buyers, but meaningful reform requires harder choices:
1. Streamline Planning and Zoning: Tokyo’s land use regulations must be modernized to allow greater density near transit hubs and employment centers. The current system protects low-density neighborhoods at the expense of housing abundance.
2. Invest in Construction Capacity: Address labor shortages through vocational training programs, immigration pathways for skilled construction workers (yes, immigration can be part of the solution), and productivity improvements through technology adoption.
3. Reduce Development Costs: Review energy efficiency mandates and other regulatory requirements that, while well-intentioned, inflate construction costs without proportionate benefits. Standardize processes to reduce complexity.
4. Public Housing Expansion: Increase government investment in public and social housing to provide affordable options for low- and middle-income families. This addresses demand pressure without relying solely on market mechanisms.
5. Tax Incentives for Developers: Offer targeted tax breaks for developers who build affordable housing units, particularly in high-demand areas currently dominated by luxury developments.
6. Transparency on Foreign Investment: Rather than restricting foreign capital outright, implement comprehensive data collection to understand its actual impact. Evidence-based policy requires understanding the problem’s true scale.
7. Address the Weak Yen Strategically: The weak yen makes Japanese assets attractive to foreign buyers but also inflates construction costs through expensive imports. Coordinated monetary policy that stabilizes the currency could ease both dynamics.
The Cost of Political Convenience
Takaichi’s electoral success demonstrates the political potency of immigration skepticism in an era of economic anxiety. Her pledge to “stand firm” against foreigners resonates with voters struggling to afford housing in their own capital. But scapegoating immigration for Japan real estate supply constraints—and by extension, Tokyo property prices 2026 projections—risks squandering Japan’s best chance at securing the workforce it needs for economic vitality.
Japan’s demographic crisis is severe. The working-age population is shrinking, birth rates remain stubbornly low, and without immigration, labor shortages will only intensify. The construction sector—already constrained—will face even greater challenges replacing aging workers. Takaichi’s administration created a ministerial post for “harmonious coexistence with foreign nationals” while simultaneously pursuing policies that frame foreigners as threats. This contradiction epitomizes the challenge: Japan needs foreign labor and capital, but political expediency demands treating both as problems to be managed rather than assets to be cultivated.
The data from Seoul and Australia reinforces a sobering lesson: restricting foreign investment doesn’t automatically increase housing affordability. What it does is provide political cover for avoiding harder structural reforms. Seoul implemented various restrictions on foreign land purchases, yet prices in prime districts continue surging. Australia tightened foreign buyer rules, yet the housing shortage persists and rents have climbed 48% in five years.
A Regional Reckoning
Tokyo’s crisis is a microcosm of a broader Asian and global phenomenon. Cities worldwide face similar pressures: rapid urbanization concentrating demand in limited geographic areas, construction industries struggling with labor and cost constraints, and political systems that find restricting foreign investment easier than confronting NIMBYism and regulatory dysfunction.
The Asia-Pacific commercial real estate market, as CBRE’s 2025 outlook notes, will see “steady growth, split performance” reflecting these divergent dynamics. Tokyo, Seoul, and Australian cities will continue experiencing rental and price growth driven by supply constraints, while secondary markets struggle with oversupply and demographic headwinds.
For Tokyo specifically, the forecast is clear: absent meaningful supply-side reforms, property prices will continue rising 5-6% annually through 2026 and beyond, with luxury properties potentially seeing 6-7% growth. The contract rate for new condominiums remains robust at 68.8% in Tokyo’s 23 wards, indicating that despite high prices, demand persists among those who can afford it—a self-reinforcing dynamic that further marginalizes middle-class aspirations.
Conclusion: The Path Forward
Sanae Takaichi’s historic electoral mandate gives her the political capital to pursue transformative reforms. Her landslide victory, fueled by “Sanamania” among young voters and conservatives disillusioned with previous LDP leadership, provides a rare opportunity to tackle Japan’s structural challenges head-on.
The question is whether she will spend that capital on performative restrictions that provide political satisfaction but economic dysfunction, or on the harder work of actually increasing Tokyo’s housing supply. The latter requires confronting powerful constituencies—existing homeowners who benefit from scarcity, construction companies comfortable with the status quo, local governments protective of low-density neighborhoods, and NIMBYs who oppose any development near them.
Japan’s demographic trajectory—declining population, shrinking workforce, aging society—leaves little room for error. The nation cannot afford to alienate foreign capital and foreign workers while simultaneously failing to build enough housing for its own citizens. Affordable housing Japan immigration policy must recognize this dual imperative: Japan needs both foreign contributions and domestic supply expansion.
Tokyo property prices 2026 will continue their upward march unless fundamental reforms materialize. The supply constraints that drive this crisis are double-edged precisely because solving them requires political courage—the willingness to prioritize long-term housing abundance over short-term electoral advantage.
Prime Minister Takaichi has demonstrated political acumen and charisma. She’s built an unlikely coalition, connected with young voters through social media, and positioned herself as a decisive leader willing to make bold moves. Now she must decide: will she channel that boldness toward the structural reforms Japan desperately needs, or will she take the politically convenient path of blaming foreigners for a crisis rooted in decades of policy failure?
Asia’s housing affordability epidemic—from Tokyo to Seoul to Sydney—awaits her answer. The region’s other leaders are watching closely, because Tokyo’s choices will either illuminate a path forward or demonstrate, once again, how political convenience trumps economic rationality in the housing policy arena.
The February 8 election results are two days old. The real test of Takaichi’s premiership begins now.
Discover more from The Economy
Subscribe to get the latest posts sent to your email.



Key Takeaways
- Rolex’s secondary market rose approximately 7.9% year-over-year as of 2026 (per WatchCharts data) — trailing Patek Philippe (+16.2%) and Tudor (+11.4%) but still outperforming Audemars Piguet (+3.4%).
- Rolex raised U.S. retail prices 4–9% in January 2026 (steel models ~5.6%, gold models ~8.7%), narrowing the historical gap between retail and pre-owned pricing.
- Not every model appreciates: steel sports references (Submariner, GMT-Master II, Daytona) have held value far better than two-tone or widely available dress references like the standard Datejust.
- The Lady-Datejust posted the sharpest 2026 gain among tracked collections — up 22.73%, from roughly $9,269 to $11,376 — driven by demand for smaller, “everyday luxury” watches.
- Gold’s rise past $2,400/oz has directly lifted the investment case for Rolex’s precious-metal references (Day-Date, Sky-Dweller, Yacht-Master).
The Model-by-Model Picture
| Category | 2026 Trend |
|---|---|
| Lady-Datejust | +22.73% (strongest performer among tracked collections) |
| Steel sports models (Submariner, GMT-Master II) | Held value well; corrected from 2022 peak but stabilized above retail |
| Daytona | Corrected from highs above $50,000 to the mid-$30,000s; still among the most sought-after references |
| Two-tone/widely available Datejust | Flat to negative — “holds value” is an overstatement for this category |
| Gold references (Day-Date, Sky-Dweller) | Lifted by gold’s rise above $2,400/oz |
Why the “Rolex Always Appreciates” Myth Is Fading
The pandemic-era boom pushed some references — the Daytona above all — to speculative highs disconnected from historical norms. Since the March 2022 peak, steel sports models have compressed meaningfully, and dealers who bought inventory near the top have in some cases faced 20–40% markdowns on liquidation. The lesson for 2026 buyers: Rolex as a category is not a monolith. Value retention depends heavily on specific reference, condition, and whether the piece comes with box and papers (“full set”).
What’s Actually Driving 2026 Strength
- Retail price increases raise the floor. When a new Submariner retails at $10,050 (up from $9,500), a pre-owned example at $11,000–$12,000 suddenly represents a smaller premium — narrowing the gap without secondary prices actually moving.
- Supply discipline remains Rolex’s core lever. The brand has never confirmed production numbers, and secondary-market premiums remain entirely a function of Rolex’s own manufacturing decisions — a risk factor as much as a support.
- Certified Pre-Owned rollout. Rolex’s now fully rolled-out CPO program has changed how buyers transact in the used market, adding a layer of brand-verified legitimacy that supports pricing.
The Case for Rolex as a Portfolio Diversifier
Financial advisors increasingly frame luxury watches not as a replacement for equities or bonds, but as a tangible, historically low-correlation diversifier — one that carries its own risks (illiquidity, condition-dependent pricing, no yield) but has demonstrated multi-decade resilience for specific references.
Is Rolex a good investment in 2026?
It depends heavily on the specific reference. Steel sports models like the Submariner and Daytona have held or grown in value; two-tone and widely available dress models generally have not. Overall, Rolex’s secondary market rose about 7.9% year-over-year in 2026, trailing Patek Philippe but ahead of Audemars Piguet.
Discover more from The Economy
Subscribe to get the latest posts sent to your email.

Navigating Mortgage and Loan Refinancing in a High-Yield Environment
Global public debt crossing critical thresholds has kept central bank policies volatile, resulting in fluctuating US Treasury yields throughout 2026. For homeowners and commercial property holders burdened by previous high-interest borrowing cycles, finding optimal refinance windows has become a high-stakes financial puzzle. Stalled disinflation and stubborn employment numbers mean rate cuts are incremental, requiring borrowers to act with precision.
Timing your mortgage or commercial loan refinance in this environment requires a deep understanding of yield curve movements and lender risk appetites.
Decoding 2026 Refinance Dynamics
The 10-Year Treasury Yield Benchmark
Mortgage rates continue to track closely with the 10-year US Treasury yield. When macroeconomic anxiety spikes debt issuance, yields rise, tightening consumer borrowing capacity. Savvy borrowers monitor weekly Treasury auctions to lock in rates during brief dip windows.
Hybrid ARMs and Alternative Structures
With fixed rates remaining elevated, 7/1 and 10/1 adjustable-rate mortgages (ARMs) have surged in popularity. These products offer lower initial monthly payments, giving borrowers breathing room until central bank easing cycles fully materialize.
| Loan Product | Current Rate Range | Best For | Key Risk Factor |
| 30-Year Fixed Mortgage | 6.2% – 6.8% | Long-term predictability | Higher initial monthly outlay |
| 7/1 Hybrid ARM | 5.5% – 5.9% | Short-term ownership / flipping | Rate reset risk after year 7 |
| Commercial Refinance | 7.0% – 8.2% | Corporate asset restructuring | Strict DSCR lender covenants |
Actionable Steps for Successful Refinancing
To maximize your chances of securing favorable refinance terms in a volatile market, follow a disciplined preparation strategy.
Boost Your Credit Score Immediately: Lenders in 2026 are applying stringent credit tiering; a 20-point increase can drop your APR by a crucial quarter-point.
Shop Regional Credit Unions: Smaller financial institutions often offer portfolio loans with more flexible underwriting than major national banks.
Calculate the Break-Even Point: Ensure your total closing costs are recouped through monthly savings within 24 months of closing.
“Market Strategist View: Refinancing in 2026 is an exercise in opportunistic timing. Borrowers must maintain immaculate financial profiles ready to strike the moment Treasury yields dip.”
Mastering the complexities of today’s debt environment ensures you can successfully lower your debt service costs and protect your long-term financial stability.
Discover more from The Economy
Subscribe to get the latest posts sent to your email.

The days of pulling generic auto insurance quotes based purely on your zip code and age are officially over. In 2026, insurance comparison engines are powered entirely by generative AI and real-time telematics. These platforms digest thousands of live data points—ranging from your driving smoothness via connected vehicle sensors to real-time traffic congestion patterns—to generate hyper-personalized premiums instantly.
For consumers, this evolution represents both a massive opportunity for savings and a hidden trap for penalty pricing. Understanding how AI algorithms evaluate risk is essential for anyone looking to lower their monthly auto insurance premiums.
How AI Comparison Engines Evaluate Your Risk Profile
Behavioral Telematics and Connected Cars
Modern cars stream performance data directly to insurance aggregators. Generative AI models analyze braking sharpness, acceleration curves, cornering G-forces, and phone distraction metrics. Drivers who maintain smooth, defensive habits are rewarded with dynamic rate cuts of up to 40% compared to traditional rating tiers.
Predictive Traffic and Weather Modeling
AI tools now cross-reference your daily commute route with predictive weather and accident probability models. If your standard parking location or driving corridor has a statistically higher incidence of uninsured motorist claims, your quotes will reflect that hyper-local risk assessment.
| Comparison Factor | Traditional Rating Model | 2026 Generative AI Model | Impact on Premium |
| Mileage & Usage | Annual estimated odometer reading | GPS tracking & live trip duration | High (up to 35% savings) |
| Driving Behavior | MVR driving record & accidents | Real-time braking, speed, & G-force | Critical (determines tier) |
| Vehicle Tech | Make, model, and safety rating | ADAS calibration & repair cost data | Moderate |
Strategies to Lower Your AI-Driven Insurance Quote
To outsmart the algorithm and secure the lowest possible premium in 2026, drivers must proactively manage their digital footprint on insurance platforms.
Opt-In for Telematics Trial Periods: Many insurers offer immediate 15% discounts just for installing their driving app; let it track safe habits for 30 days to lock in permanent savings.
Scrub Unverified Public Records: Ensure your motor vehicle report is free of clerical errors that AI risk models misinterpret as reckless behavior.
Compare AI Aggregators: Use platforms that integrate multi-carrier API feeds rather than single-brand comparison sites to find the best risk-adjusted rate.
“Industry Note: AI-driven pricing rewards transparency and precision. Drivers who actively manage their telematics data consistently out-save those relying on legacy quote calculators.”
Embracing AI comparison tools allows savvy policyholders to customize coverage limits precisely to their driving habits, eliminating wasted premium spend while ensuring robust protection.
Discover more from The Economy
Subscribe to get the latest posts sent to your email.

Russia Sanctions Waiver: What Asian Oil Buyers Gain

Asia Markets Weekly: How Oil, US Yields and the Fed Reach Tokyo, Kuala Lumpur and Karachi

Gold Near $4,000: Buy, Hold or Wait? A Pakistan Tola Price Guide

US 10-Year Treasury Yield Near 5%: The Hidden Cost for Pakistani Investors

Fed Meeting on October 28: Hike or Hold—and Why Pakistan Investors Should Care

Can Pakistan Turn US–Iran Mediation Into an Economic Dividend?

Oil Above $100: How Higher Crude Prices Reach Pakistan’s Rupee, Petrol and Imports

SBP Interest Rate at 11.5%: What Will Decide Pakistan’s Next Policy Move?

The Global South: Debt, Climate Finance and Investment in 2026

Energy Security Is the New Economic Security

Can Global Tourism Survive Geopolitical Shocks?

Global Maritime Hegemony: How China Secured Over 81% of All New Shipbuilding Orders

The Coming Battle Over AI, Jobs and Wages

Why Developing Economies Face a Sharper Inflation Problem

Crude Oil & Petroleum Market Analysis: OPEC+ Decisions and Price Forecasts

Silver Price Today: Why the Xi-Trump AI Standoff Is Fueling a Safe-Haven Rally

Algorithmic Dogfights: Why the U.S. and China Must Establish Rules of Engagement for Autonomous Air Power

Top US Convenience Store Chains: Store Counts, EV Charging, and Sales Trends

Who Is Shivon Zilis? The Neuralink Executive at the Center of the Musk–OpenAI Trial

Social Security Extra $90 Deposit: Who Qualifies for the October 2026 Medicare Rebate?

Corporate America Faces a New Debt Test as US Borrowing Costs Surge

Global Economic Outlook 2026: 7 Forces Reshaping Markets, Trade and Business

Gold Falls 3.7% as Yields Surge: Is Gold Still a Safe Haven in 2026?

Stock Market Today: Dow, S&P 500, and Nasdaq Retreat as Treasury Yields

MAS Allocates S$1.45 Billion to Five Asset Managers in Third EQDP Batch: Total Deployment Reaches S$5.4 Billion

Anthropic Bans Sustained Abuse of Claude AI Under New Usage Policy Effective November 12, 2026

Gold Price Outlook 2026: The Forces Behind the Forecasts—and What Could Reverse Them

US 10-Year Yield Hits 5.24%: What the Historic Bond Market Sell off Means for Mortgages and Investors
-

 Markets & Finance10 months ago
Top 15 Stocks for Investment in 2026 in PSX: Your Complete Guide to Pakistan’s Best Investment Opportunities
-

 Analysis8 months ago
Johor’s Investment Boom: The Hidden Costs Behind Malaysia’s Most Ambitious Economic Surge
-

 Analysis8 months ago
Top 10 Stocks for Investment in PSX for Quick Returns in 2026
-

 Banks9 months ago
Best Investments in Pakistan 2026: Top 10 Low-Price Shares and Long-Term Picks for the PSX
-

 Analysis9 months ago
Brazil’s Rare Earth Race: US, EU, and China Compete for Critical Minerals as Tensions Rise
-

 Investment10 months ago
Top 10 Mutual Fund Managers in Pakistan for Investment in 2026: A Comprehensive Guide for Optimal Returns
-

 Global Economy10 months ago
15 Most Lucrative Sectors for Investment in Pakistan: A 2025 Data-Driven Analysis
-

 Global Economy10 months ago
Pakistan’s Export Goldmine: 10 Game-Changing Markets Where Pakistani Businesses Are Winning Big in 2025